
Employee productivity measures how efficiently workers convert time, skills, technology and organizational resources into useful economic output. Productivity remains a central business concern as employers balance rising labour costs with investments in artificial intelligence, automation, digital tools and flexible work arrangements. The latest data show that productivity growth is still positive in the U.S., but performance varies considerably by industry, region, workplace model and employee experience.
At the same time, factors such as engagement, burnout, meetings, unclear expectations and access to effective technology continue to shape how much employees can accomplish during the workday. AI is also becoming a more visible productivity driver, with several recent studies reporting measurable improvements in task speed, output and time savings. The statistics in this article examine these trends across industries, demographics, remote work, technology adoption, employee engagement and the broader labor market.
Editor’s Choice
- U.S. nonfarm business productivity was 2.2% higher in Q2 2026 than a year earlier, despite hours worked increasing by only 0.2%.
- Productivity increased at a 5.2% annualized rate in Q3 2025, making it the strongest quarterly U.S. nonfarm business productivity increase of 2025.
- Private nonfarm business productivity averaged 2.2% annual growth from 2019 through 2025, compared with 1.5% from 2007 through 2019.
- Across developed economies, 29 countries recorded labor productivity gains in 2024, although only 11 exceeded their average 2010-2019 growth rates.
- Preliminary figures show European Union labor productivity growth accelerated from 0.2% in 2024 to 1.4% in 2025.
- U.S. wholesale trade productivity climbed 4.4% in 2025, while retail trade productivity rose 2.9%.
- Clothing stores recorded an 11.2% productivity increase in 2025, the largest gain among the 10 biggest four-digit wholesale and retail industries by employment.
- Oil and gas extraction labor productivity increased 13.9% in 2025, as output grew 2.9% while hours worked dropped 9.6%.
- In workplace-level research, an AI assistant raised customer-support productivity by 14% overall, with much larger benefits among less-experienced employees.
- Employees in modern knowledge-work environments can receive a meeting, email or notification interruption approximately every two minutes during the workday.
Recent Developments
- U.S. nonfarm business labor productivity increased at a 1.4% annualized rate in Q2 2026, as output rose 1.7% and hours worked increased 0.3%.
- Compared with Q2 2025, U.S. nonfarm business productivity increased 2.2% in Q2 2026, while hourly compensation rose 3.7%.
- Unit labor costs increased 1.4% year over year in the U.S. nonfarm business sector in Q2 2026, indicating that compensation grew faster than productivity over the period.
- Manufacturing productivity increased 1.9% at an annualized rate in Q2 2026, alongside a 4.6% increase in real sectoral output.
- The 2025 annual data show nonfarm business productivity increased 2.1%, compared with 3.0% for private nonfarm business productivity in 2024.
- Total factor productivity in private nonfarm businesses grew 0.8% in 2025, down from 1.5% in 2024.
- Global workplace data published in 2026 show that 20% of employees worldwide were engaged in 2025, down from 21% in 2024 and 23% in 2023.
- Employee wellbeing improved slightly in 2025, with 34% of workers globally classified as thriving, up from 33% in 2024.
- In addition, 52% of employees worldwide said in 2025 that it was a good time to find a job where they lived, highlighting a labor market in which employers must balance productivity with retention.
- AI adoption has also moved into workforce planning, with 82% of surveyed leaders expecting to use digital labor to expand workforce capacity within the following 12 to 18 months.
How Employees Spend an Average 8-Hour Workday
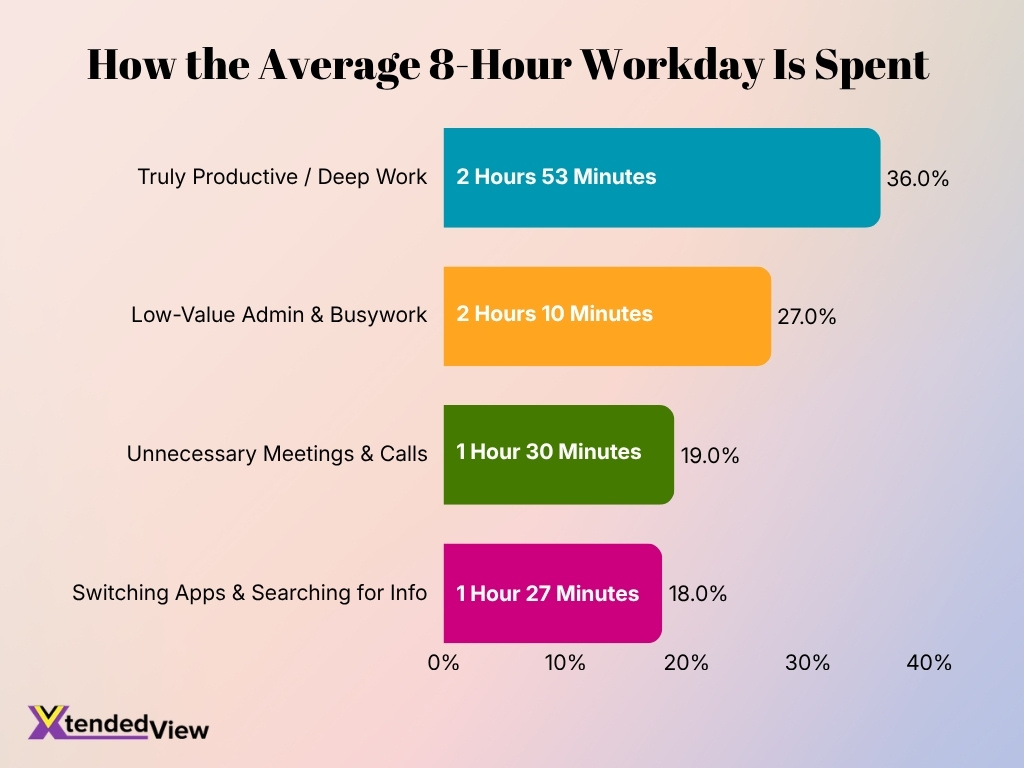
- Employees spend just 2 hours 53 minutes, or 36% of the workday, on truly productive or deep work.
- Low-value administrative tasks and busywork consume around 2 hours 10 minutes per day, accounting for 27% of working time.
- Unnecessary meetings and calls take up approximately 1 hour 30 minutes, representing 19% of the average workday.
- Switching between apps and searching for information costs employees another 1 hour 27 minutes daily, equivalent to 18% of working hours.
- Overall, the data indicates that nearly 64% of the workday is spent on admin work, meetings, app switching, and information searches, leaving only 36% for focused productive work.
Global and Regional Employee Productivity Trends
- Across developed economies, economy-wide labor productivity increased 1.2% in 2024, compared with 0.6% in 2023.
- The United States recorded 2.2% labor productivity growth in 2024, more than double its average growth rate during 2010-2019.
- The European Union recorded only 0.2% productivity growth in 2024, but preliminary estimates show growth accelerating to 1.4% in 2025.
- Preliminary estimates put U.S. total-economy labor productivity growth at about 1.7% in 2025, moderating from 2.2% in 2024.
- Poland recorded 5.1% labor productivity growth in 2024, while Bulgaria posted 4.4% and Denmark recorded 3.0%.
- Productivity declined in several major economies in 2024, including Italy at -1.4%, Japan at -1.3%, the U.K. at -0.7% and Germany at -0.4%.
- Korea recorded 1.8% productivity growth in 2024, while Mexico reached 2.0%. Australia moved in the opposite direction with a 0.7% decline.
- Output per hour worked ranged from approximately $18.70 in Colombia to $135.70 in Ireland in 2024 when measured in constant 2020 purchasing power parity dollars, illustrating the scale of productivity differences between economies.
- Excluding Ireland and Luxembourg, Norway reached about $99.70 of GDP per hour worked in 2024, while Denmark reached $92.20 and the U.S. stood at $84.10.
- The EU’s productivity level stood at roughly 75% of the U.S. level in 2024, down from about 90% in 2000. Japan’s relative level declined from 73% of the U.S. level to 62% over the same period.
Employee Productivity by Industry
- U.S. wholesale trade labor productivity increased 4.4% in 2025 as output rose 3.1% and hours worked declined 1.2%.
- Retail trade productivity increased 2.9% in 2025, with output rising 2.5% while hours worked fell 0.4%.
- Productivity increased in 12 of 15 three-digit wholesale and retail trade industries during 2025.
- At a more detailed industry level, productivity increased in 35 of 46 four-digit wholesale and retail industries in 2025.
- Wholesale electronic markets and agents and brokers posted a 13.4% productivity increase in 2025, the largest gain among the three-digit trade industries.
- Appliance and electric goods merchant wholesalers recorded 15.2% productivity growth in 2025. Output increased 12.8% while labor hours declined 2.1%.
- Vending machine operators recorded an 18.2% productivity increase in 2025, their largest increase on record, as hours worked fell 16.0%.
- Manufacturing productivity increased in 39 of 80 covered four-digit manufacturing industries in 2025. Other transportation equipment manufacturing led durable industries with a 14.9% gain.
- Textile and fabric finishing mills led nondurable manufacturing with 16.1% productivity growth in 2025, while their hours worked fell 17.3%.
- Mining showed sharp internal differences in 2025, oil and gas extraction productivity rose 13.9%, while support activities for mining fell 9.8%.
U.S. Labor Productivity Growth
- U.S. nonfarm business labor productivity increased 1.4% in Q2 2026 at a seasonally adjusted annualized rate. Output increased 1.7%, compared with a 0.3% increase in hours worked.
- Compared with Q2 2025, productivity was 2.2% higher in Q2 2026, while output increased 2.5%.
- U.S. productivity increased just 0.8% in Q1 2026 at an annualized rate before accelerating to 1.4% in Q2.
- Nonfarm business productivity grew 2.1% for full-year 2025, supported by 2.5% output growth and only 0.4% growth in hours worked.
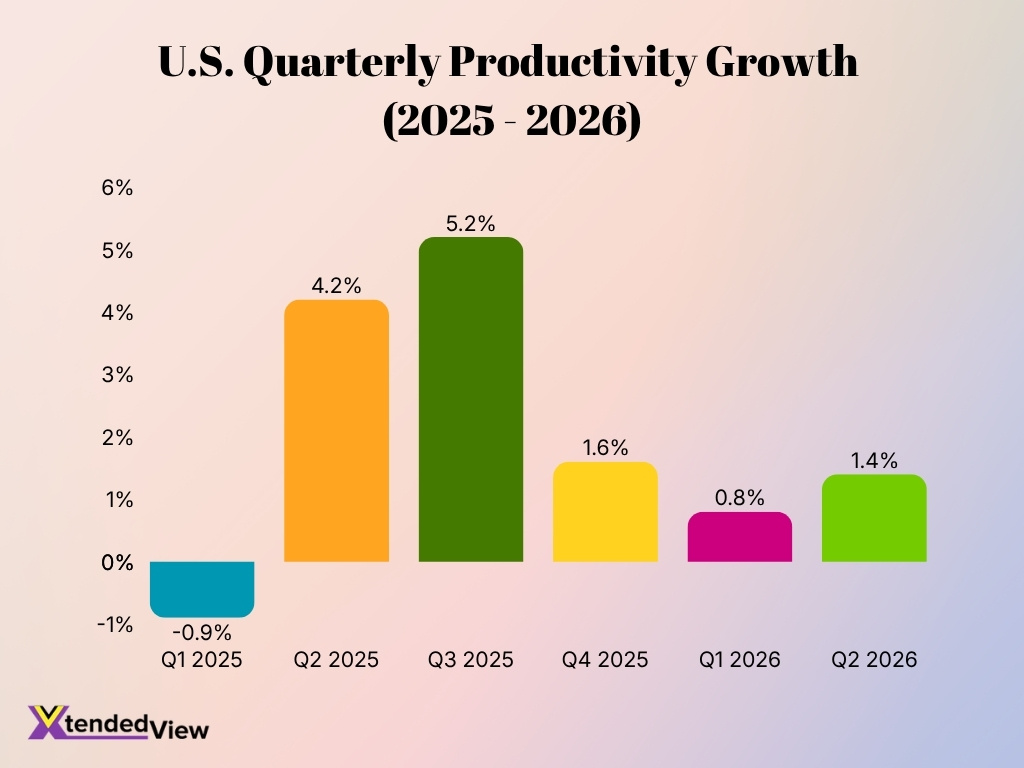
- Quarterly productivity growth fluctuated considerably during 2025, it fell 0.9% in Q1 before increasing 4.2% in Q2, 5.2% in Q3 and 1.6% in Q4, measured at annualized rates.
- Private nonfarm business labor productivity increased 3.0% in 2024, while output rose 3.0% and hours worked decreased 0.1%.
- From 2019 through 2025, private nonfarm business labor productivity grew at an average annual rate of 2.2%, compared with 1.5% from 2007 through 2019.
- Over the longer 1987-2025 period, U.S. private nonfarm business labor productivity increased at an average annual rate of 2.0%.
- Q2 2026 manufacturing productivity stood 0.9% above its Q2 2025 level, while durable manufacturing productivity increased 2.2% and nondurable manufacturing productivity declined 0.3%.
- The long-term U.S. productivity picture also shows stronger recent momentum, average private nonfarm productivity growth of 2.2% during 2019-2025 exceeded the 1.5% annual average recorded during 2007-2019.
Employee Engagement and Productivity Statistics
- Global employee engagement fell to 20% in 2025, down from 21% in 2024 and the 23% peak recorded in 2022 and 2023.
- Another 64% of employees were not engaged in 2025, while 16% were actively disengaged. Together, four in five workers lacked strong engagement with their jobs.
- Low employee engagement cost the global economy an estimated $10 trillion in lost productivity in 2025, equivalent to roughly 9% of global GDP.
- Manager engagement declined particularly sharply, dropping from 27% in 2024 to 22% in 2025. By comparison, engagement among non-managers increased from 18% to 19%.
- Employees in the U.S. and Canada recorded a 31% engagement rate in 2025, the highest of the 10 major global regions measured.
- Remote employees reported a 30% engagement rate, compared with 25% among hybrid workers, 24% among remote-capable on-site workers and 17% among workers in jobs that cannot operate remotely.
- Managers remained more engaged than individual contributors in 2025, at 22% versus 19%, although the gap narrowed substantially following the decline in manager engagement.
- Female employees recorded a 21% global engagement rate, slightly above the 19% rate among male employees. Workers ages 35 and older also led workers younger than 35, 21% to 19%.
Remote and Hybrid Work Productivity Statistics
- Working from home represented approximately 25% of paid U.S. workdays in 2025 among workers ages 20 to 64.
- Across a balanced sample of 22 countries, employees worked from home an average of 1.27 days per week in 2024-2025, compared with 1.33 days in 2023 and 1.6 days in 2022.
- English-speaking economies recorded some of the world’s highest work-from-home levels, averaging roughly 1.5 to 2 days per week in the latest international survey.
- European workers generally averaged about 1 to 1.5 remote days per week, while workers in Asian economies averaged approximately 0.5 to one day.
- A 2025 study of a large call center found that moving employees fully remote increased workforce productivity by 10%, largely through shorter call durations in quieter working environments.
- The same fully remote model enabled the employer to increase its proportion of graduate employees by 14% without raising wages, partly because remote hiring expanded access to women and workers in rural and smaller communities.
- Research involving more than 1,600 employees found that working remotely two days per week caused no measurable decline in productivity or promotion rates compared with fully office-based work.
- Across more than 150,000 U.S. businesses surveyed from late 2024 through early 2025, employees averaged one work-from-home day per week, and employers expected the average to remain at one day five years later.
- Only 7% of surveyed U.S. firms said on-site work was more productive than working from home, while 2% rated remote work as more productive. The most common assessment was that productivity was similar.
- Among executives overseeing hybrid or fully remote workers, only 12% planned a return-to-office mandate during the following year, indicating that most organizations expected flexible arrangements to continue.
AI Usage Frequency Among US Employees
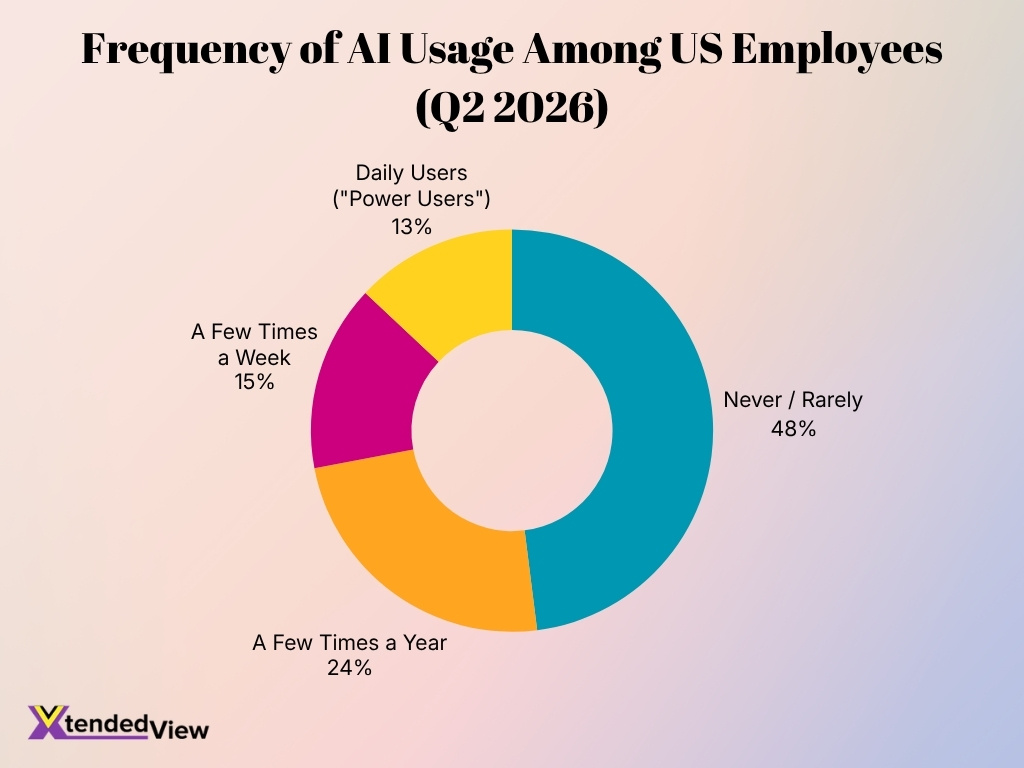
- 48% of US employees said they never or rarely use AI, making this the largest workforce segment.
- 24% of employees use AI only a few times a year, indicating relatively limited adoption among nearly one-quarter of workers.
- 15% of the workforce reported using AI a few times a week, showing a smaller but more regularly engaged user group.
- Daily AI users, or “power users,” account for 13% of US employees, representing the most intensive AI adopters.
- Combined, 28% of employees use AI at least a few times a week, compared with 72% who use it only occasionally or rarely.
Time Lost to Distractions and Meetings
- Knowledge workers received a meeting, email or chat interruption approximately every two minutes during core working hours in 2025.
- Across a full day, workplace communication generated an estimated 275 interruptions per employee through meetings, emails and chats.
- About 60% of meetings were ad hoc rather than scheduled, making it more difficult for employees to protect predictable periods of uninterrupted work.
- Approximately 30% of meetings crossed multiple time zones, and their share had increased by eight percentage points since 2021.
- Workplace chats sent outside the traditional 9-to-5 workday increased 15% year over year, reflecting a continued expansion of communication beyond standard working hours.
- Employees received an average of 58 chat messages outside regular working hours, increasing the likelihood that work communication extends into personal time.
- Meetings held after 8 p.m. increased 16% year over year, with cross-time-zone collaboration contributing to the growth.
- In a randomized experiment involving 7,137 knowledge workers, frequent users of an integrated generative AI tool spent 3.6 fewer hours per week on email, a 31% reduction relative to their previous email time.
- The same experiment found that AI access reduced email time but produced no statistically significant reduction in meeting time, showing that collaboration requirements can remain even when individual administrative work becomes faster.
Technology and Workplace Productivity Statistics
- 53% of business leaders said their organizations needed to increase productivity, highlighting growing pressure to generate more output from existing resources.
- At the same time, 80% of employees and leaders said they lacked enough time or energy to complete their work, creating a gap between expected output and workforce capacity.
- 82% of leaders expected to use AI-driven digital labor to expand workforce capacity within 12 to 18 months.
- Organizations described as advanced AI adopters showed a substantial capacity advantage, 71% of their employees said their companies were thriving, compared with 37% of workers overall.
- In those advanced AI organizations, 55% of employees said they could take on additional work, compared with only 20% across the broader workforce.
- Across 15 developed economies, firms adopting advanced digital technologies generally recorded higher productivity than non-adopters, although part of the advantage reflected stronger worker skills and existing digital capabilities.
- The productivity advantage associated with AI adoption was particularly connected with education, ICT skills and existing digitalization, indicating that technology and human capital work together rather than independently.
- Economic modeling estimates that AI could add approximately 0.2 to 1.3 percentage points to annual productivity growth across G7 economies, depending on adoption levels and country conditions.
- Across studies using different assumptions, modeled AI-driven productivity gains range from approximately 0.5 to 3.5 percentage points per year over a 10-year period, underscoring the uncertainty around the technology’s economy-wide impact.
Mental Health, Burnout, and Productivity Statistics
- 40% of employees worldwide experienced substantial stress during the previous day in 2025, unchanged from 2024 and still above the 38% recorded in 2019.
- Employee wellbeing improved slightly, with 34% of workers globally thriving in 2025, compared with 33% in 2024. Another 56% were struggling and 9% were suffering.
- Stress was highest among employees in the U.S. and Canada, where 50% reported experiencing significant daily stress in 2025.
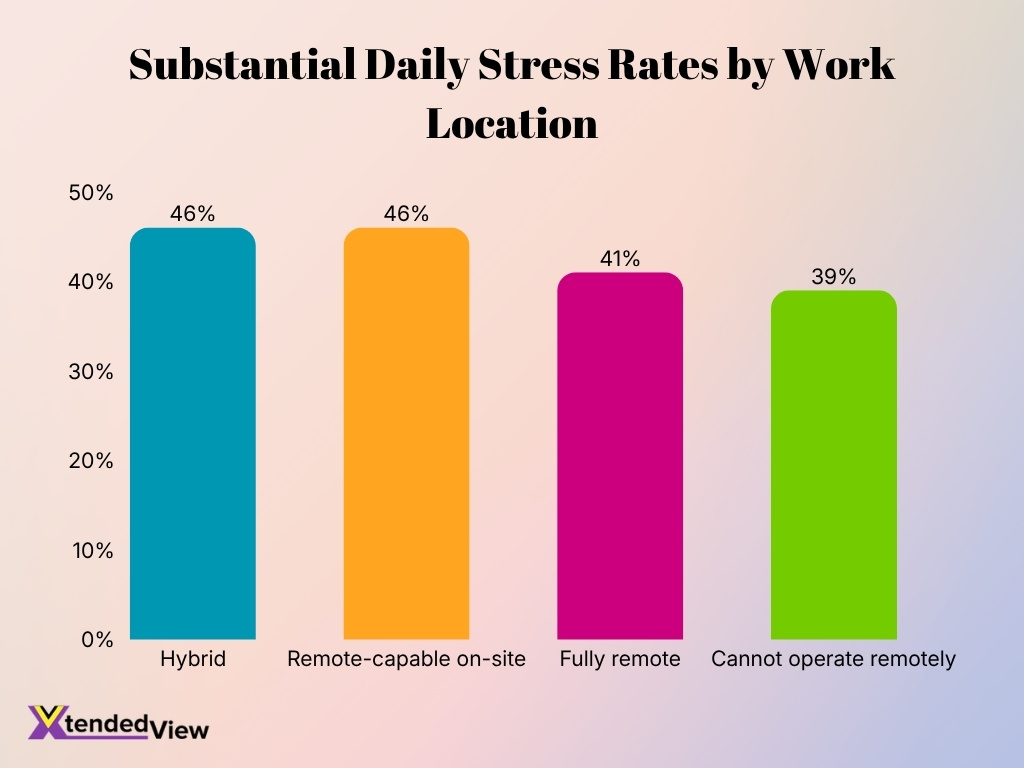
- Hybrid and remote-capable on-site workers each recorded a 46% daily stress rate, compared with 41% for fully remote employees and 39% for workers whose jobs could not be performed remotely.
- Managers reported more daily stress than individual contributors, at 45% versus 39%, despite managers also recording higher engagement and wellbeing.
- Among U.S. workers surveyed in 2025, 54% said job insecurity significantly affected their stress levels.
- Around 65% of employed U.S. adults said their organization had experienced effects from recent government policy changes, while 20% described those effects as significant or drastic.
- Only 10% of employees satisfied with their manager relationship described their workplace experience as toxic, compared with 55% among workers dissatisfied with their manager relationship.
- Workers living with a disability reported 45% emotional exhaustion, nearly twice the 23% rate among workers without a disability. They also reported lack of motivation or energy at rates of 37% versus 24%.
- Globally, 43% of female employees experienced substantial daily stress, compared with 39% of male employees, showing a four-point difference in 2025.
Demographics and Employee Productivity Statistics
- Workers ages 35 and older had a 21% engagement rate in 2025, compared with 19% among employees younger than 35.
- Younger workers nevertheless reported more daily stress, 42% of employees under 35 experienced substantial stress, compared with 40% of employees ages 35 and older.
- Female workers recorded slightly higher engagement than male workers in 2025, at 21% versus 19%.
- Female employees were also more likely to report thriving in their overall lives, at 37% versus 33% among men.
- Working from home accounted for a share of paid workdays that was about two percentage points higher for women than men in the U.S. in 2025.
- U.S. workers with children younger than 8 recorded a work-from-home rate seven percentage points higher than workers without young children in their households.
- In the latest international working-arrangements survey, employees with children were more likely to use hybrid schedules, while workers without children were comparatively more likely to work either fully remotely or completely on-site.
- A 2025 remote-work field study found that allowing fully remote work increased access to women, married women and rural workers and helped the employer raise its share of graduate employees by 14% without increasing wages.
- Workers with disabilities reported 37% lack of interest, motivation or energy, compared with 24% among workers without disabilities. In addition, 23% expressed a desire to quit, compared with 15% of workers without disabilities.
- A 2026 study of firms affected by an increase in retirement age found that retaining more older employees did not reduce average labor productivity, while firm value added and employment of younger workers increased.
Factors Affecting Employee Productivity
- 67% of U.S. workers said low salaries had a significant effect on their workplace stress in 2025. Financial pressure can make retention harder and reduce employees’ ability to stay focused at work.
- A lack of growth or advancement opportunities affected workplace stress for 58% of employees, making career progression one of the most commonly reported work-related pressures.
- Heavy workloads had a significant stress impact on 56% of workers. Excessive workload can reduce sustainable productivity when employees must prioritize speed over concentration, quality or recovery time.
- Long working hours also affected 56% of employees, suggesting that adding more hours does not automatically create more productive working time.
- Work interfering with personal or family time significantly affected stress for 55% of workers, highlighting the productivity value of clearer boundaries between work and nonwork time.
- Another 55% cited unrealistic job expectations as a significant source of stress. Unrealistic targets can encourage overwork while weakening the connection between effort and attainable performance goals.
- In Q1 2026, frequent AI use reached 86% among employees who strongly agreed that AI integrated well with their existing work systems, compared with 52% among employees without that strong level of integration.
- Manager support also shaped technology use. Frequent AI adoption reached 79% when employees strongly agreed that their manager actively supported AI use, versus 46% when employees lacked that level of managerial support.
- Employees whose managers actively supported AI were 8.7 times as likely to strongly agree that the technology had transformed how work gets done in their organization.
Biggest Causes of Employee Productivity Loss
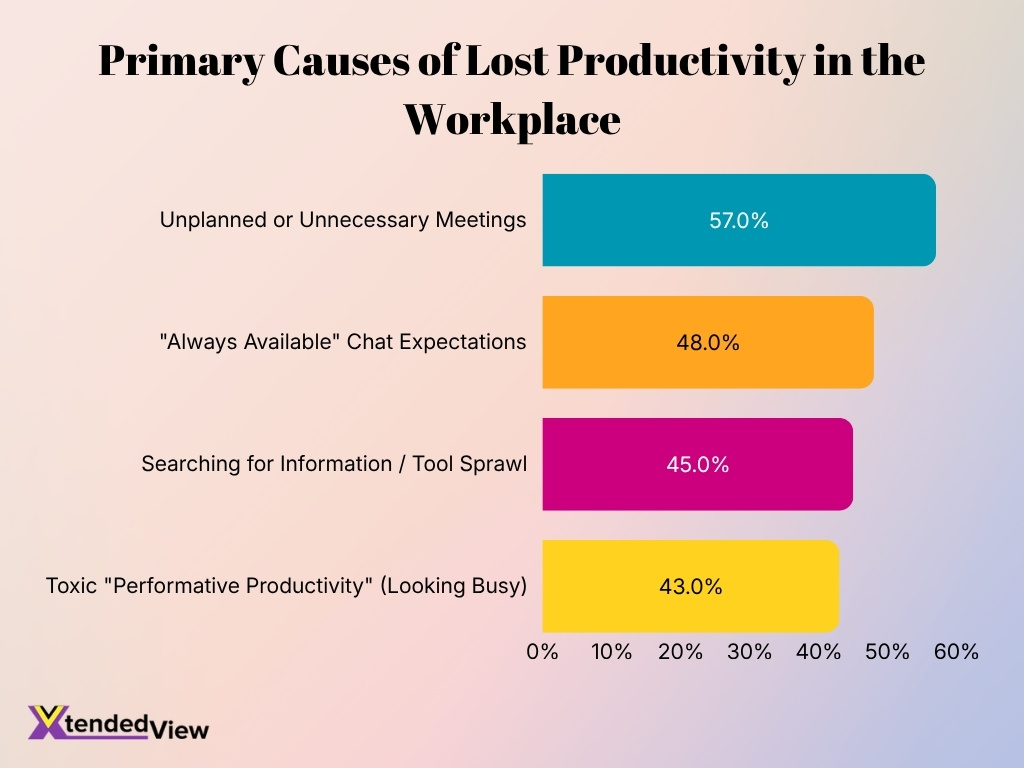
- Unplanned or unnecessary meetings are the biggest productivity obstacle, cited by 57% of employees, highlighting the cost of excessive meeting time.
- “Always available” chat expectations affect 48% of employees, suggesting constant messaging can disrupt focus and deep work.
- Searching for information and tool sprawl is a major productivity barrier for 45% of employees, pointing to inefficiencies caused by fragmented workplace systems.
- Performative productivity, or the pressure to appear busy rather than deliver meaningful results, is cited by 43% of employees as a significant obstacle.
- The relatively narrow 14-percentage-point gap between the highest and lowest figures shows that lost productivity stems from multiple overlapping workplace distractions, rather than a single dominant issue.
Measuring and Tracking Employee Productivity
- A 2026 international survey found that 23% of executive leaders had no formal workplace productivity KPIs or did not know whether their organization had them.
- 43% of organizations in the same research used output and task-completion rates as workplace productivity measures, making them the most commonly reported metrics.
- Employee retention and turnover were tracked as productivity-related indicators by 40% of organizations. These metrics can help businesses identify whether performance gains depend on unsustainable workforce churn.
- Revenue per employee served as a productivity KPI for 32% of organizations, connecting workforce size directly with financial output.
- Workplace utilization and occupancy data were monitored by 26% of organizations, although these figures measure how space gets used rather than employee output directly.
- In a 2025 performance-management survey, 82% of employees said their performance goals were clear and understandable, while 71% said the number of goals assigned to them felt appropriate.
- However, just 38% of employees strongly agreed that their performance-management process made them more productive. An equal 38% said it helped them produce higher-quality work.
- Only 36% strongly agreed that performance management helped them understand their weekly priorities, while 32% said it helped them know where they stood each day.
- Just 22% of employees strongly agreed in August 2025 that they had received meaningful feedback during the previous week. Regular feedback remains one of the clearest gaps in day-to-day performance tracking.
- U.S. labor productivity provides a broader economic benchmark, it measures real output divided by total hours worked. In Q2 2026, this measure increased 1.4% at an annualized rate as output increased 1.7% and hours increased 0.3%.
Productivity Gains From Workplace Interventions
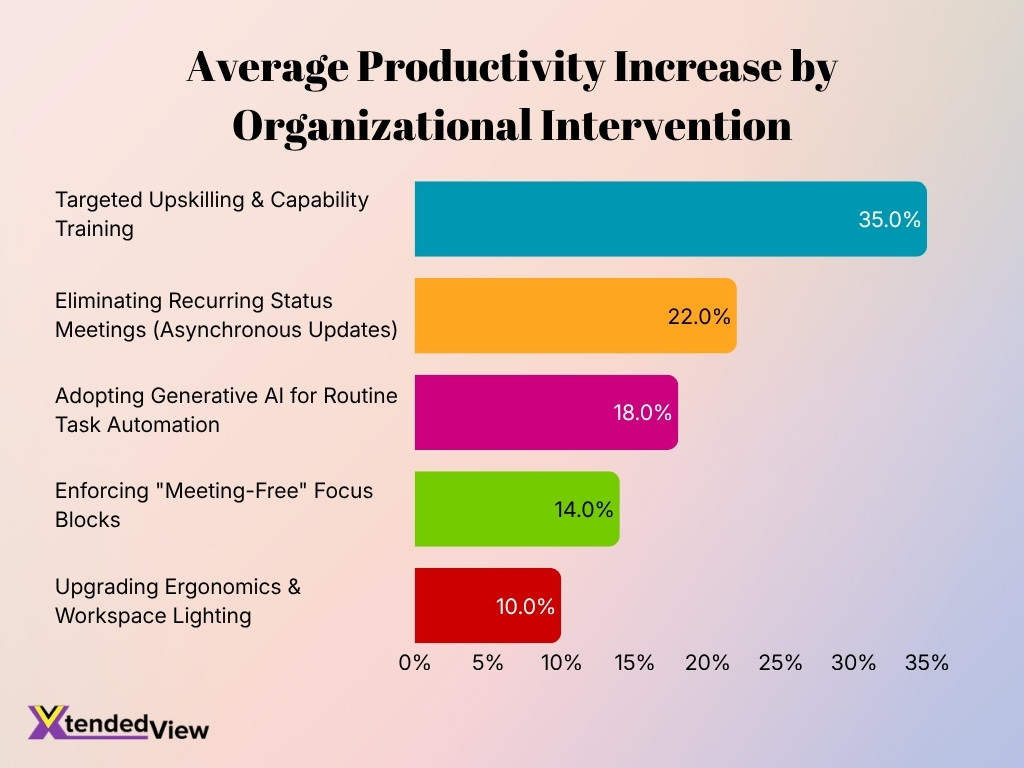
- Targeted upskilling and capability training delivers the largest productivity improvement, increasing employee output by an average of 35%.
- Replacing recurring status meetings with asynchronous updates can raise productivity by 22%, highlighting the cost of unnecessary meetings.
- Using generative AI for routine task automation produces an average productivity boost of 18%, freeing employees for higher-value work.
- Introducing meeting-free focus blocks improves productivity by 14%, giving employees more uninterrupted time for concentrated work.
- Improvements to workplace ergonomics and lighting generate a 10% productivity increase, the smallest gain among the interventions measured but still a meaningful uplift.
Future of Workplace Productivity
- Structural labor-market changes could affect 22% of today’s formal jobs by 2030, combining both newly created roles and jobs expected to disappear.
- Current projections indicate that approximately 170 million new jobs could emerge globally through 2030 as technology, demographic change, the energy transition and other forces reshape employment.
- At the same time, approximately 92 million existing jobs could disappear, producing large-scale workforce reallocation even if total employment grows.
- The difference would create a net gain of roughly 78 million jobs, equivalent to about 7% of current employment represented in the underlying dataset.
- Workers can expect approximately 39% of their existing skills to change or become outdated between 2025 and 2030. That figure has improved from 44% in the 2023 edition of the same research.
- Of every 100 workers, approximately 59 are expected to require upskilling or reskilling by 2030. Eleven may not receive the required training, leaving more than 120 million workers at medium-term risk.
- 63% of employers identify skills gaps as a major barrier to business transformation, making workforce capability one of the key constraints on future productivity gains.
- AI could add around 0.5 to 1 percentage point to annual labor productivity growth across G7 economies under a central adoption scenario over the next decade.
- Under faster AI adoption and expanded technological capabilities, estimated annual productivity gains could reach 1.3 percentage points in some economies. Under slower adoption, the estimated contribution drops to roughly 0.2 to 0.4 points.
- Employee concerns are already changing alongside the technology. In Q1 2026, 18% of U.S. employees believed technological innovation could eliminate their job within five years, rising to 23% among employees at organizations that had implemented AI.
Frequently Asked Questions (FAQs)
U.S. nonfarm business labor productivity increased 1.4% at an annualized rate in Q2 2026 and was 2.2% higher year over year.
Global employee engagement fell to 20% in 2025, and low engagement was estimated to cost the world economy $10 trillion, or 9% of global GDP, in lost productivity.
Enterprise AI users reported saving an average of 40 to 60 minutes per active workday, while some technical and communications roles reported savings of 60 to 80 minutes per day.
Work from home accounted for approximately 25% of paid workdays among Americans ages 20 to 64 in 2025.
Approximately 39% of workers’ core skills are expected to change or become outdated by 2030 as technology and workplace requirements evolve.
Conclusion
Employee productivity reflects a workplace where economic output, technology, management practices and employee experience are increasingly connected. U.S. labor productivity has maintained stronger momentum than in some earlier periods, while individual industries continue to show wide differences in output per hour. At the same time, persistent challenges such as low engagement, workplace stress, interruptions, skills gaps and unclear performance expectations can limit how effectively employees use their working time.
AI, automation and digital workplace tools offer significant opportunities to increase output per hour, but the data also show that technology produces stronger results when organizations combine it with effective management, training and well-designed workflows. Remote and hybrid work remain established parts of the labor market, while employee wellbeing and flexibility continue to influence retention and performance. Looking toward 2030, sustainable productivity growth will depend less on simply extending working hours and more on combining human capability, effective technology, clear goals, strong management and continuous skills development.