
Meta Platforms, Inc. (Meta) continues to shape how billions of people connect, communicate, and consume content. Its global footprint spans social networks, messaging apps, and emerging AI services, impacting industries from advertising and e‑commerce to entertainment and customer service. For instance, brands increasingly allocate ad budgets to Meta’s family of apps to reach global audiences, and enterprises deploy Meta’s AI capabilities behind chatbots, content moderation,n and user‑insight systems.
Editor’s Choice
Here are seven standout statistics for 2025 at a glance:
- Meta’s “family of apps” surpassed 3.98 billion monthly active users in 2025.
- Daily active people across Meta’s apps reached about 3.35 billion globally.
- Meta AI achieved 1 billion monthly active users as of mid‑2025.
- Q2 2025 revenue rose by 22% year‑over‑year, reaching about $47.5 billion.
- Meta is committed to investing $60–65 billion in capital expenditures in 2025 for AI infrastructure.
- A new metadata centre investment: $1.5 billion in Texas, gigawatt‑scale and data‑centre focus.
- Meta announced a $27 billion joint‑venture financing (80% by partner) for its Hyperion campus in Louisiana.
Recent Developments
These recent moves illustrate Meta’s evolving strategy in 2025:
- In October 2025, Meta committed $1.5 billion to build a new data centre in Texas with 1‑gigawatt capacity.
- Meta entered a joint venture with funds managed by Blue Owl Capital for the Hyperion data‑centre campus in Louisiana, $27 billion total cost, and Meta retains 20% equity.
- Meta’s infrastructure team published key insights on how AI workloads require new hardware, networks, and data‑centre designs.
- Meta publicly stated that 2025 would be a “defining year for AI, targeting multi‑billion‑dollar AI investment.
- Meta’s press‑release archive shows multiple announcements in October 2025, e.g., a joint venture for its data centre campus, increased focus on AI safety, and infrastructure.
- The company continues to evolve its core apps, for example, the announcement of AI user‑growth metrics (see later sections).
- Regulatory, privacy, and data‑cost pressures remain, influencing Meta’s strategy across the ad business, infrastructure, and global operations.
- Meta’s AI unit and Reality Labs hardware arm remain pivotal, though with differing performance and scrutiny.
Meta Platforms Overview
A concise snapshot of Meta’s scope and key metrics in 2025:
- Meta owns the core “Family of Apps” including Facebook, Instagram, WhatsApp, and Messenger.
- As of 2025, the monthly active users across these apps stood at about 3.98 billion.
- Daily active people across the Family of Apps reached 3.35 billion.
- Meta’s Q1 2025 results mention that “Meta AI … now has almost 1 billion monthly actives.”
- Meta reported strong ad‑demand and monetisation enhancements in its Q2 metrics.
- Meta’s capital expenditure guidance for 2025 is significantly higher than 2024, reflecting the shift to infrastructure and AI.
- Meta’s platform reach in terms of global internet users: one estimate says 70% of active internet users access Meta’s services monthly.
Meta User Growth and Demographics
This section examines how Meta’s user base is expanding and evolving:
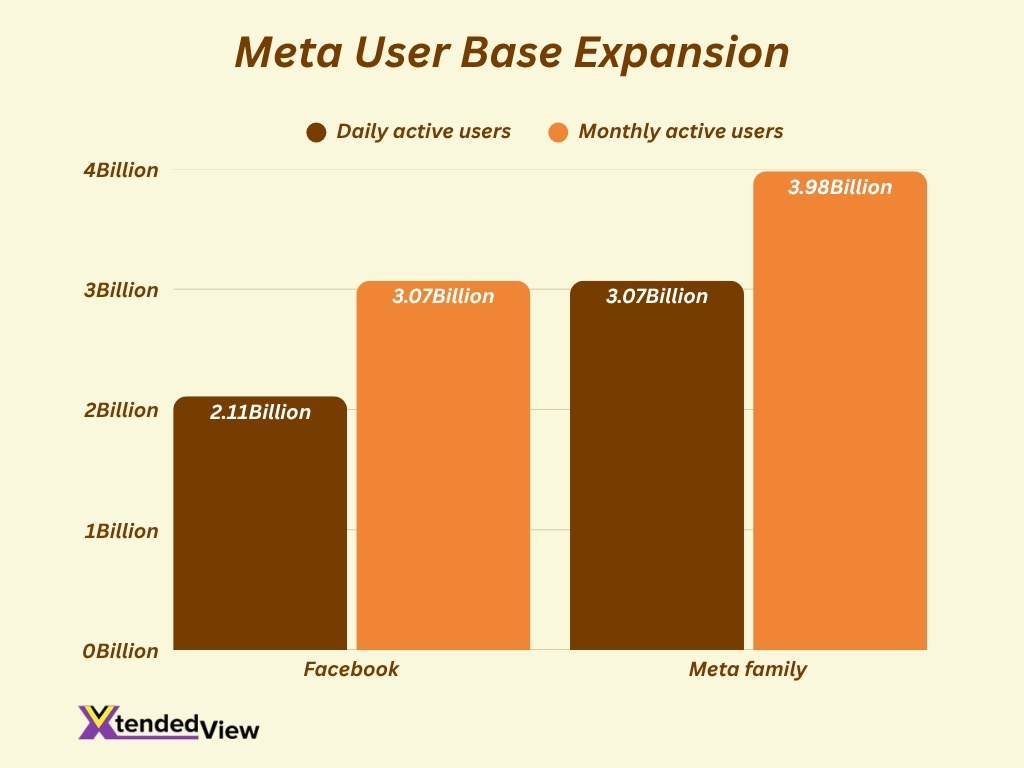
- Meta’s total monthly active people across its apps: 3.98 billion in 2025.
- Daily active people: 3.35 billion.
- For Facebook alone: 3.07 billion monthly active users in 2025.
- Facebook’s daily active users: 2.11 billion.
- In Q1 2025, Meta reported crossing 3.43 billion daily active users across its products.
- Meta AI’s user base doubled from 500 million monthly users in late 2024 to 1 billion by mid‑2025.
- The average global internet user’s access: 70% use Meta’s services monthly.
- Growth in regions, for example, Meta identified rapid uptake of its AI and core offerings in India and emerging markets.
- The overlap of platform users (people using more than one Meta app) means reach statistics reflect “people, not accounts.”
Daily and Monthly Active Users
Let’s look more closely at DAUs (daily active users) and MAUs (monthly active users):
- MAUs across Meta’s family of apps: 3.98 billion in 2025.
- DAUs across Meta’s family: 3.35 billion.
- Facebook alone: 3.07 billion MAUs in 2025.
- Facebook DAUs: 2.11 billion.
- In Q1 2025, Meta reported DAP (daily active people) as 3.43 billion.
- The share of monthly users who log in daily: 80% for Meta’s family of apps.
- Daily penetration: 60.56% of active internet users globally use Meta’s services daily.
- Relative global scale: 48.89% of the world’s total population uses Meta’s services monthly.
Revenue and Financial Statistics
- In Q1 2025, Meta Platforms, Inc. reported revenue of $42.31 billion, up 16 % year‑over‑year.
- In Q2 2025, Meta posted revenue of $47.52 billion, marking 22 % growth vs. the same quarter last year.
- For Q2 2025, approximately $46.6 billion of that revenue (≈98 %) stemmed from advertising.
- Meta guided full‑year 2025 revenue to be in the range of $39.5 billion to $41.8 billion for Q1 and capital expenditures of $60–65 billion.
- The company’s 2024 revenue was reported at $164.5 billion, up 21.9 % from the prior year.
- Meta estimates that it controls about 21.4 % of global digital advertising spend.
- In the U.S., Instagram is projected to generate $32.03 billion in U.S. ad revenue in 2025, up 24.4 % over 2024.
- Ad impressions for Meta’s family of apps increased 5 % year‑over‑year in Q1 2025.
- Average price‑per‑ad rose 10 % in the same quarter.
Meta Ad Revenue Forecast
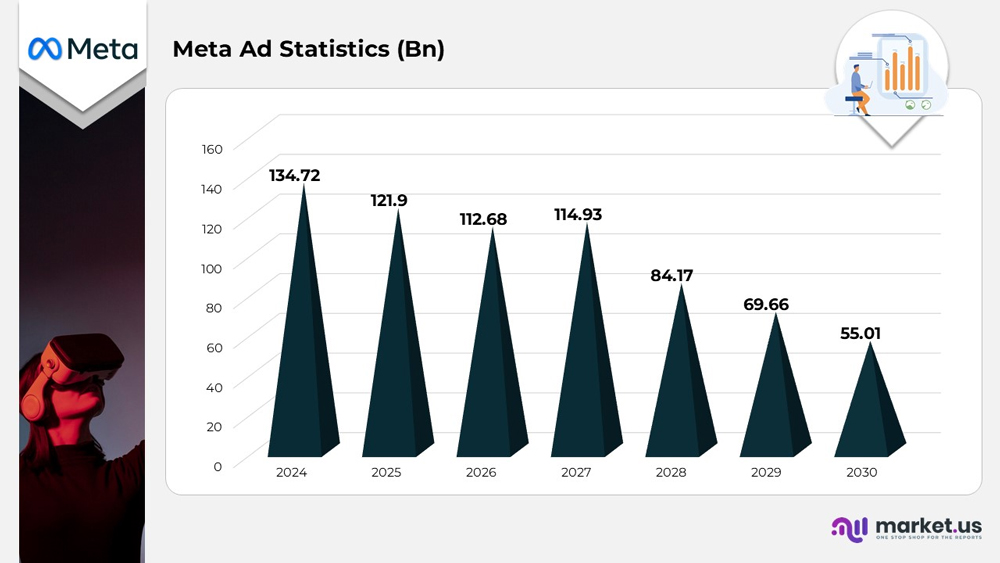
- 2024: Meta’s advertising revenue peaked at $134.72 billion, the highest in the 7-year projection.
- 2025: Revenue is projected to decline slightly to $121.90 billion, marking a 9.5% drop from 2024.
- 2026: A continued decline brings ad revenue down to $112.68 billion.
- 2027: A mild rebound is expected with revenue climbing to $114.93 billion.
- 2028: A significant drop is projected, with revenue falling to $84.17 billion, a 26.7% decrease from 2027.
- 2029: The downtrend continues, hitting $69.66 billion, nearly 50% lower than 2024 levels.
- 2030: Meta’s ad revenue is forecasted to fall further to $55.01 billion, indicating a 59% decline from the 2024 peak.
Platform Usage Breakdown (Facebook, Instagram, WhatsApp, Messenger)
- Across Meta’s “family of apps,” monthly active people reached 3.98 billion in 2025.
- Facebook alone had 3.07 billion monthly active users in 2025.
- WhatsApp is reported to have 2 billion monthly active users as of 2025.
- Instagram is estimated to have 2 billion monthly users in 2025.
- 80 % of Instagram users are also active on Facebook.
- 77 % of WhatsApp users are also active on other Meta apps.
- Facebook’s daily active users (DAUs) numbered 2.11 billion in 2025.
- 80.15 % of Meta’s monthly active users log in daily.
Facebook Users by Country
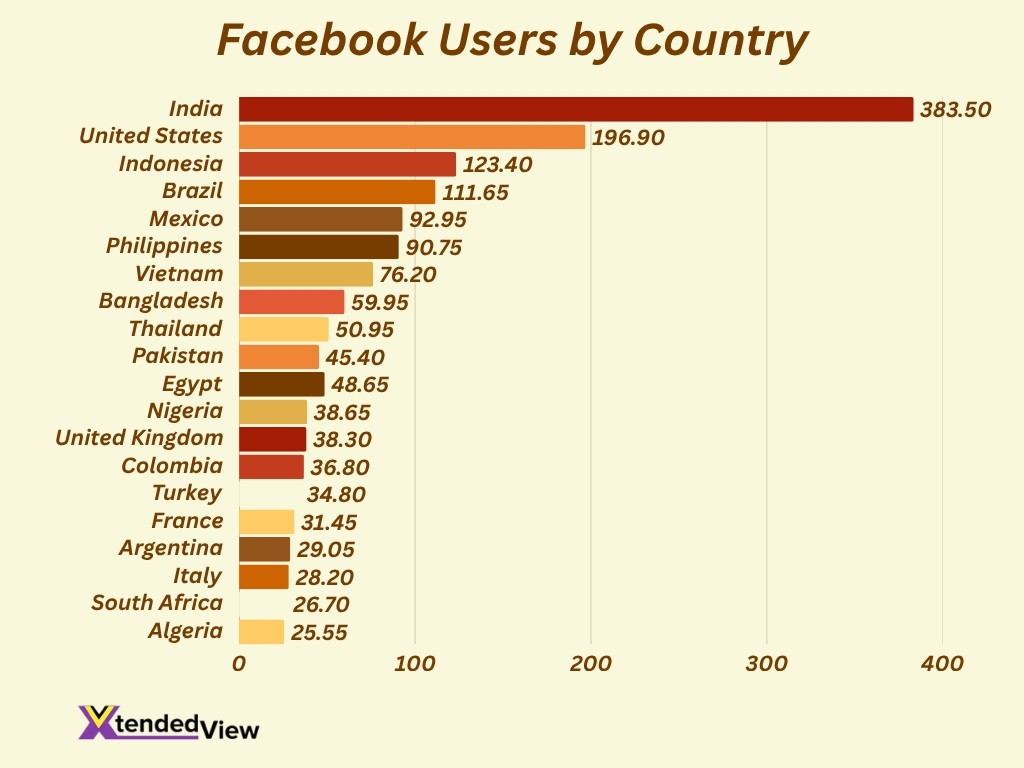
- India tops the global list with 383.5 million Facebook users, nearly double that of the second-ranked country.
- The United States follows with 196.9 million users, maintaining a strong digital presence despite slower growth.
- Indonesia ranks third with 123.4 million users, showcasing Southeast Asia’s high social media engagement.
- Brazil comes fourth with 111.65 million users, the largest in South America.
- Mexico secures fifth place with 92.95 million users, reflecting strong adoption in Latin America.
- The Philippines and Vietnam each have 90.75 million and 76.2 million users, respectively, emphasizing Facebook’s dominance in Asia.
- Bangladesh (59.95M), Thailand (50.95M), and Egypt (48.65M) complete the top ten, marking Facebook’s continued expansion in developing markets.
- Pakistan (45.4M) and Nigeria (38.65M) highlight Africa and South Asia’s growing online user bases.
- The United Kingdom (38.3M) remains Europe’s leading Facebook market, followed closely by France (31.45M) and Italy (28.2M).
- Latin American countries like Colombia (36.8M) and Argentina (29.05M) show steady engagement levels.
- South Africa (26.7M) and Algeria (25.55M) round out the list, reinforcing Africa’s increasing digital connectivity.
- The top five countries (India, the U.S., Indonesia, Brazil, and Mexico) collectively represent over 60% of the total user base among the top 20 nations.
- The data underscores Facebook’s continued dominance in emerging markets, particularly across Asia and Africa, where mobile connectivity is rapidly expanding.
Meta Users Demographics Statistics (by Age and Gender)
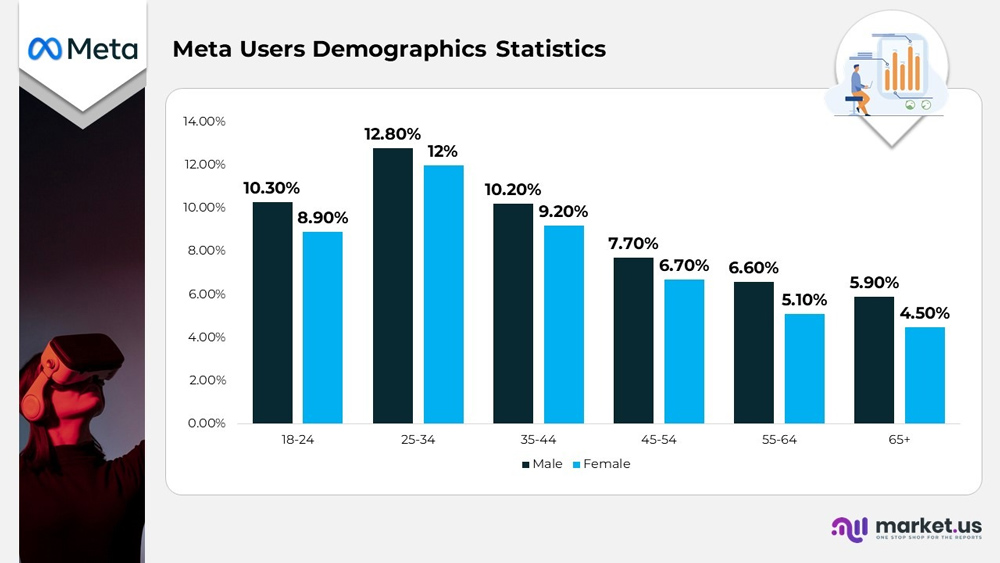
- The largest user group on Meta platforms is aged 25–34, with 12.8% male and 12% female users, showing peak engagement among young adults.
- The 18–24 age group follows closely, with 10.3% male and 8.9% female users, indicating strong usage among younger audiences.
- Among users aged 35–44, participation slightly declines to 10.2% male and 9.2% female, maintaining a solid middle-aged demographic.
- For ages 45–54, engagement drops to 7.7% male and 6.7% female, suggesting reduced activity as users age.
- The 55–64 age group shows 6.6% male and 5.1% female users, still a significant portion of the platform’s audience.
- The 65+ demographic represents the smallest share, with 5.9% male and 4.5% female users, reflecting lower adoption among older adults.
- Overall, men lead in every age group, but the gender gap is relatively narrow, especially among younger users.
- The data highlights Meta’s strongest engagement within the 18–34 age range, the core demographic driving social media activity and digital marketing reach.
- User participation declines steadily after age 35, indicating generational shifts in online behavior and platform preferences.
Device and App Usage Statistics
- 98.5 % of Facebook users launch the platform via a mobile device.
- 81.8 % use only a phone (not a desktop).
- Global mobile apps are projected to reach 299 billion downloads in 2025.
- 80.3 % of Instagram users also use Facebook.
- Meta’s apps are accessed primarily through smartphones.
Engagement Rates and Time Spent
- Meta’s Family of Apps reported 3.43 billion daily active users in March 2025.
- Meta delivered a 5 % year‑over‑year increase in ad impressions in Q1 2025.
- Average price per ad rose 10 % year‑over‑year.
- Average engagement on Facebook is 1.7 % across industries.
- 48.89 % of the world’s total population uses Meta‑owned services monthly.
- 80.15 % of monthly users log in daily.
- Engagement per cost on Facebook is 0.046 %, with sports teams at 0.23 %.
- Passive viewing and short‑form video are increasing.
- Facebook Reels see 1.76 % engagement for small accounts.
- Engagement per impression remains modest.
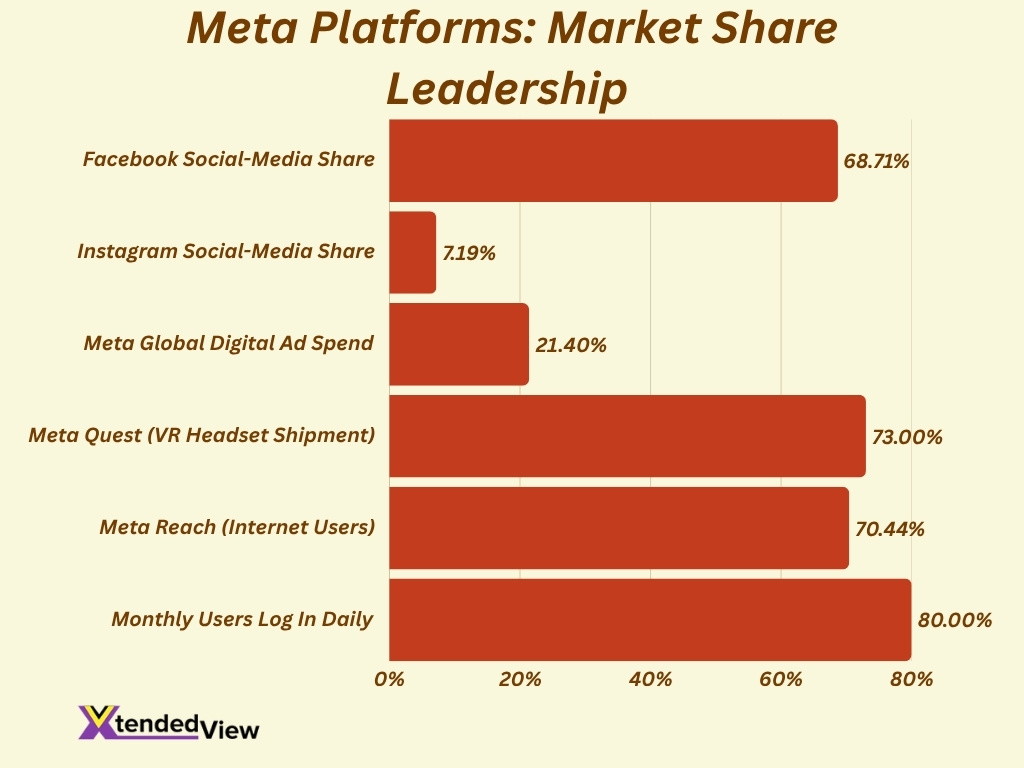
Meta Platforms Market Share
- Meta Platforms has a market capitalisation of approximately $1.56 trillion.
- Facebook holds 68.71% share of worldwide social‑media usage.
- Instagram follows with 7.19%.
- Meta commands 21.4% of global digital ad spend.
- Meta Quest ships 73% of all VR headsets worldwide.
- Instagram ad revenue exceeded $32 billion in 2025.
- Meta reaches 70.44% of active internet users monthly.
- 80% of monthly users log in daily.
Metaverse Statistics
- Global metaverse market to reach $153.4 billion in 2025.
- Another estimate forecasts $203.7 billion in 2025.
- 79% of people express concern about data misuse.
- 47% worry about simulated reality addiction.
- Meta Quest is projected to have its most‑engaged year in 2025.
- The hardware segment captures 53% of the metaverse market.
- Monetisation remains peripheral compared to Meta’s core ad business.
Threads and New Product Growth
- Threads reported over 175 million monthly active users as of January 2025.
- Meta’s monthly active users (MAUs) rose to 3.98 billion in 2025.
- Meta AI surpassed 1 billion monthly active users.
- Threads is still minimally monetised.
- Meta invests in XR, Ray‑Ban Meta glasses, and AI assistants.
- User overlap boosts advertiser reach.
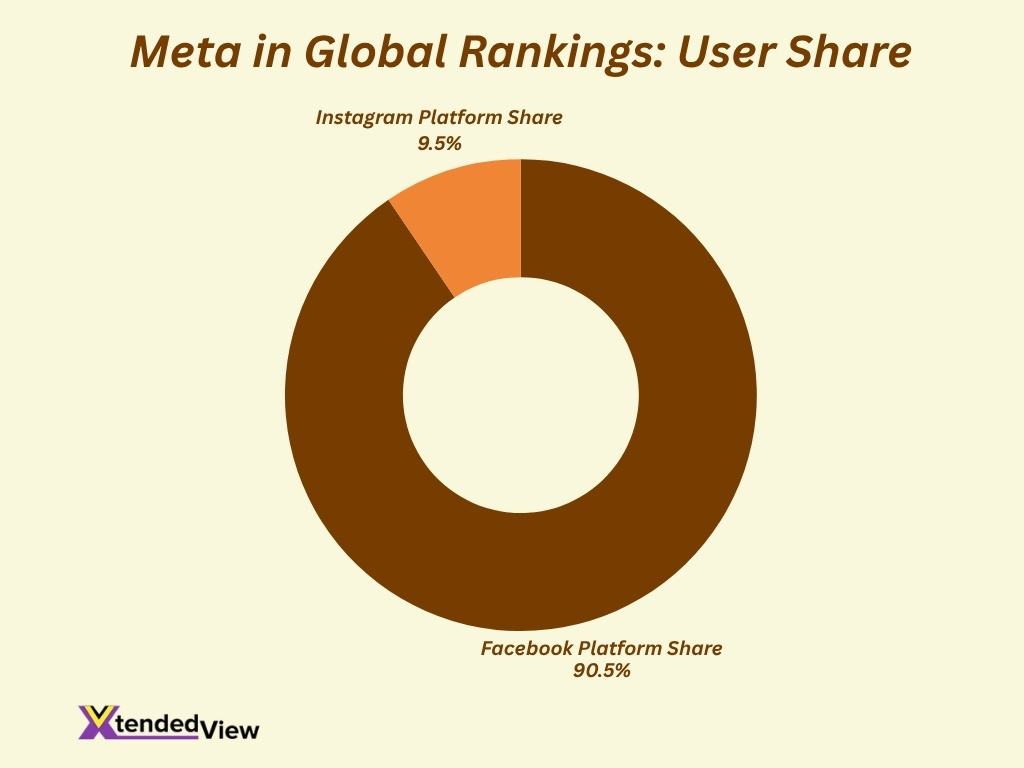
Global Rankings and Comparisons (Market Cap, User Base, etc.)
- Meta’s market cap ranges between $1.56‑1.93 trillion in 2025.
- Meta’s monthly active people equal 48.9% of the world’s total population.
- Facebook had 3.07 billion MAUs in 2025.
- Facebook platform share: 68.7%, Instagram: 7.2%.
- Meta’s ad reach and monetisation lead globally.
Privacy, Data, and Security Statistics
- 83% of consumers worry about data safety.
- Meta trackers collect form data more often than Google trackers.
- 21.5% of VR apps lack a valid privacy policy.
- 79% fear metaverse data misuse.
- WhatsApp reportedly sees 500,000 account thefts daily.
- “Consent‑or‑pay” model attracts EU regulatory scrutiny.
- Security and regulation threaten Meta’s data advantage.
Future Growth Projections
- Meta AI could generate $460 billion to $1.4 trillion by 2035.
- Metaverse market to reach $3.37 trillion by 2034.
- Capital expenditures are projected at $60‑65 billion in 2025.
- User growth is slowing, making monetisation more important.
- ARPU and AI integrations will drive the next growth phase.
Frequently Asked Questions (FAQs)
Approximately 3.98 billion monthly active people in 2025.
Revenue grew by about 22% year‑over‑year in Q2 2025.
They are projected to hold about 54.7% of the global ad market in 2025.
Meta AI reached approximately 1 billion monthly active users.
Around 70.44% of active internet users access Meta’s services monthly.
Conclusion
Meta’s scale, reach, and investment make it a standout in the digital‑economy landscape. With nearly 4 billion monthly users, a market cap in the trillions of dollars, and intensive investment in AI, X, R, and monetisation, its core app ecosystem remains dominant. At the same time, rising regulatory pressure, privacy concerns, and evolving engagement dynamics underline that raw scale alone no longer guarantees smooth growth. For marketers, investors, and strategists in the U.S. and beyond, Meta’s numbers signal both opportunity and challenge.