


Instagram has evolved far beyond a photo-sharing app into a platform that powers digital marketing, ecommerce, creator businesses, and customer engagement. Retail brands use it to drive product discovery, while creators, publishers, and local businesses rely on it to build audiences and generate revenue. The latest statistics highlight how Instagram continues to influence consumer behavior in the US and worldwide. Explore the data below to understand the platform’s latest growth trends and market impact.
Editor’s Choice
- Instagram reached 3 billion monthly active users in 2025, becoming one of the world’s largest social platforms.
- Meta’s advertising tools indicate Instagram’s global advertising audience exceeded 1.7 billion users in early 2025.
- The average Instagram user globally falls within the 25–34-year-old age group, making Millennials and Gen Z the platform’s largest audience.
- Instagram’s global advertising audience consists of 52.7% male users and 47.3% female users.
- Instagram users share more than 4.5 billion Reels every day across Meta’s platforms.
- Meta reported a 19% year-over-year increase in ad impressions across its Family of Apps during Q1 2026, reflecting continued advertising demand that includes Instagram.
- Instagram remains one of the leading platforms for creator monetization, ecommerce discovery, influencer campaigns, and brand storytelling across both B2C and D2C industries.
Recent Developments
- Instagram announced that it has grown to 3 billion monthly active users, reaching a milestone previously achieved by only a handful of social platforms.
- Instagram is testing a Reels-first mobile experience in selected markets to increase short-form video engagement.
- Messaging continues to become a larger part of Instagram, with DMs now serving as the primary method for sharing photos and videos among users.
- Users now reshare over 4.5 billion Reels daily across Meta’s ecosystem.
- Meta reported 33% year-over-year revenue growth during Q1 2026, supported by stronger advertising performance across its apps.
- Average advertising prices increased 12% year over year during Q1 2026 as advertisers continued investing in Meta’s AI-powered advertising products.
- AI recommendation systems continue to improve feed personalization and content discovery across Instagram, helping boost engagement.
- Instagram continues expanding creator-focused features while integrating AI recommendations, messaging improvements, and commerce experiences into one platform.
Instagram’s Global User Growth Over Time
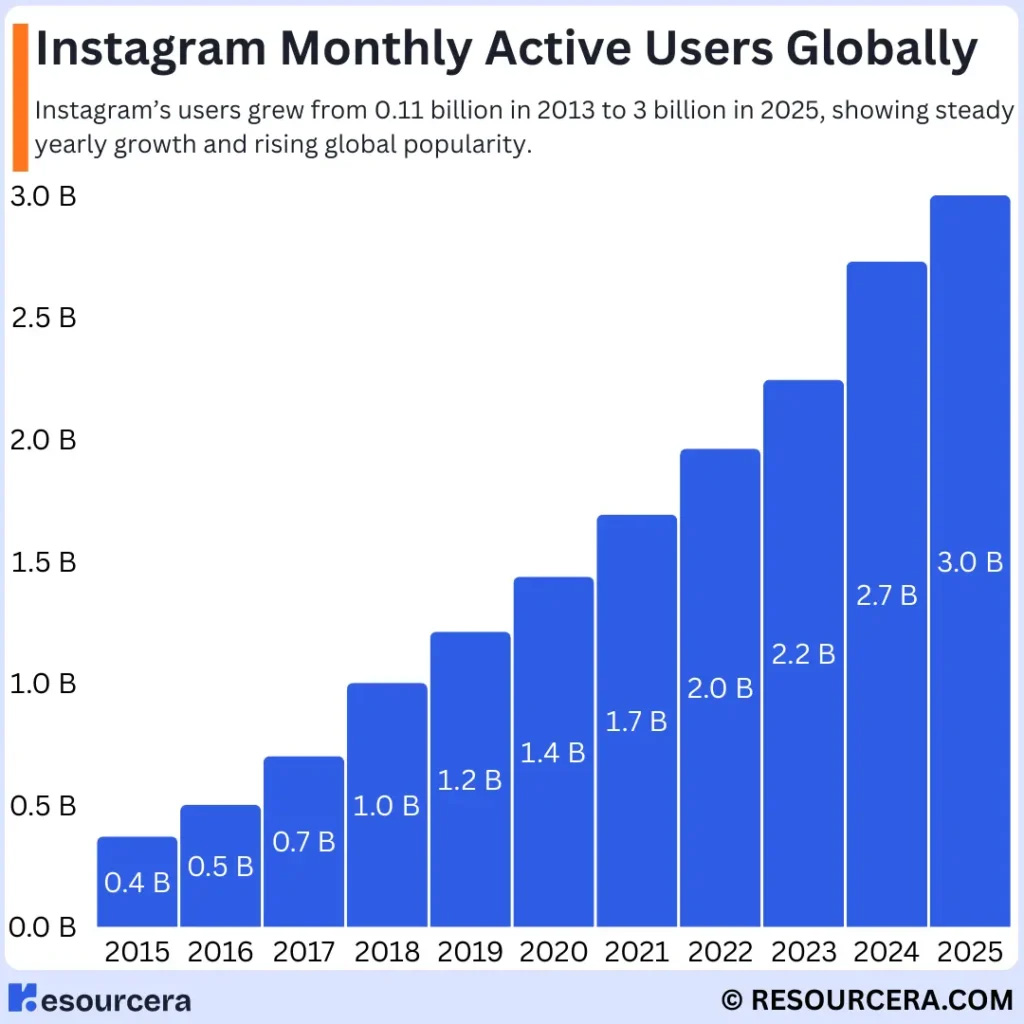
- Instagram’s monthly active user base increased from 400 million in 2015 to 3 billion in 2025, reflecting remarkable global expansion.
- The platform reached the 1 billion user milestone in 2018, doubling from 500 million users in 2016 within just two years.
- Instagram added approximately 200 million users annually between 2018 and 2020, growing from 1 billion to 1.4 billion.
- User growth accelerated after 2020, with monthly active users rising from 1.4 billion in 2020 to 2 billion in 2022.
- Instagram gained around 500 million users between 2023 and 2024, representing one of the largest annual increases shown in the data.
- By 2025, Instagram had reached 3 billion monthly active users, an increase of 300 million compared with 2.7 billion in 2024.
- Overall, Instagram’s audience expanded by approximately 650% over the decade, highlighting its continued popularity and global reach.
Global Instagram Usage Statistics
- Instagram now serves approximately 3 billion monthly active users worldwide.
- Meta’s advertising tools show Instagram can potentially reach more than 1.7 billion people through advertising worldwide.
- India remains Instagram’s largest advertising market with approximately 481 million reachable users by late 2025.
- Instagram’s potential advertising audience in India increased by 89.5 million users between October 2024 and October 2025.
- Instagram’s user base continues expanding because of short-form video, creator content, messaging, and ecommerce adoption.
- Instagram remains one of Meta’s primary platforms for digital advertising alongside Facebook, Messenger, and WhatsApp.
- More than 3.56 billion people use at least one Meta app daily, demonstrating the scale of Instagram’s ecosystem.
- Instagram continues to rank among the world’s most downloaded and frequently used social networking applications across Android and iOS.
Instagram User Demographics
- The 25–34 age group represents Instagram’s largest global audience segment.
- Users aged 18–34 account for the majority of Instagram’s worldwide audience.
- 52.7% of Instagram’s global advertising audience is male.
- 47.3% of Instagram’s global advertising audience is female.
- Gen Z continues driving adoption of Reels, creator content, and social commerce across Instagram.
- Younger audiences increasingly use Instagram for product discovery, entertainment, and messaging rather than only photo sharing.
- Creator-led content continues attracting younger users across education, fashion, beauty, travel, fitness, and gaming categories.
- Instagram’s audience remains attractive to advertisers because of its concentration of digitally active consumers with strong purchasing influence.
Instagram Geographic Audience Breakdown
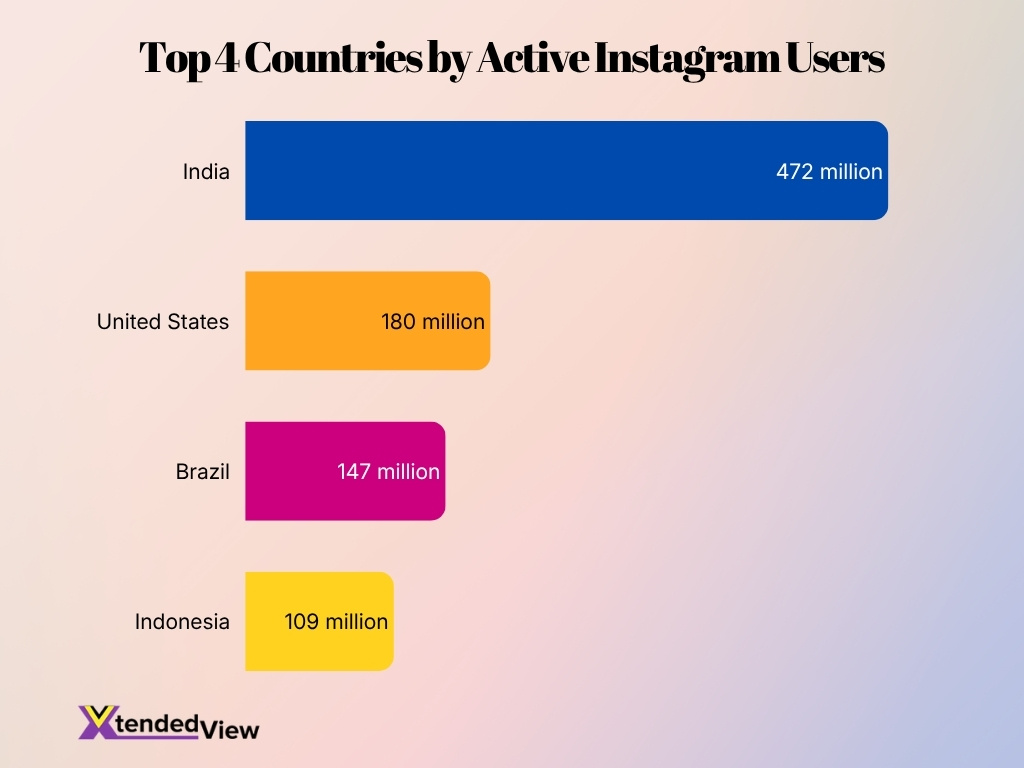
- India holds the highest number of Instagram users globally with over 472 million active accounts.
- The United States ranks second worldwide, accounting for nearly 180 million monthly active users.
- Brazil follows closely as the third-largest market, boasting 147 million active users on the platform.
- Indonesia represents a massive Southeast Asian audience with 109 million active Instagram users.
- In Turkey, Instagram reaches a staggering 90.4% of the country’s total adult population.
- The Asia-Pacific region accounts for almost half of the global audience with 953 million users.
- Europe represents the second-largest continental market with roughly 403 million active users.
- Latin America has grown to become a dominant region with 379 million active monthly users.
- Japan leads the East Asian market with approximately 61.6 million active Instagram users.
Instagram Age and Gender Distribution
- Users aged 25–34 represent Instagram’s largest age segment, making up 33.3% of the global audience.
- The 18–24 age bracket forms the second largest group, accounting for 29.7% of active users worldwide.
- Over 60% of Instagram’s entire global user base is aged between 18 and 34 years old.
- Globally, Instagram’s gender distribution is nearly equal, with 52.5% male and 47.5% female users.
- In the United States, the platform leans female, with women making up 55.4% of the total user base.
- India features a highly male-dominated audience, consisting of roughly 67.2% men and 32.8% women.
- Less than 4% of Instagram’s global audience falls into the 65 and older demographic category.
- Around 76% of adults aged 18–29 in the US actively use the platform.
Instagram Content Format Statistics
- Reels generate 67% higher engagement than traditional static feed posts.
- More than 4.5 billion Reels are reshared daily across the platform.
- Carousel formats average 1.92% engagement, nearly 4x more than single images.
- An average Reel reaches 30.81% of followers, doubling the reach of other formats.
- Users spend 46% of their total app time specifically watching Reels.
- Mixed-media carousels combining images and video hit a 2.33% engagement rate.
- Short Reels under 30 seconds achieve an impressive 5.8% average engagement rate.
- Carousel posts generate 9 times more saves compared to single-image content.
- Approximately 55% of Reel views originate from non-followers.
- Live video broadcasts generate up to 10x more engagement than standard feed posts.
Instagram Usage Time Trends Across Age Groups
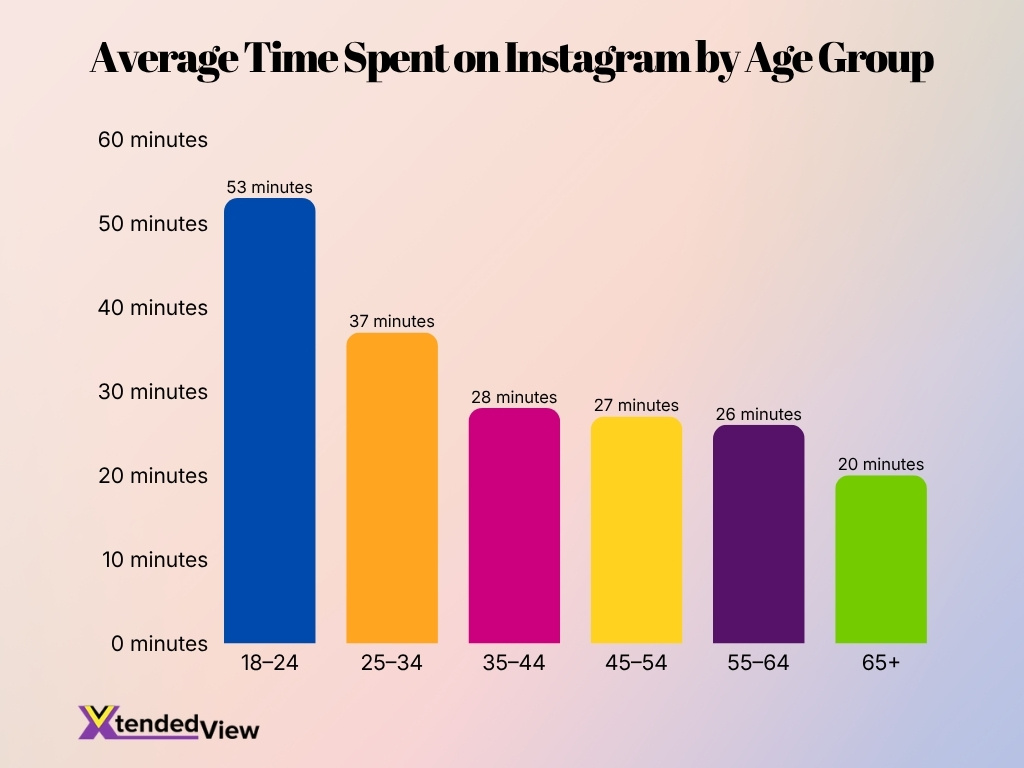
- Users aged 18–24 spend the most time on Instagram, averaging 53 minutes, which highlights the platform’s strong appeal among younger adults.
- The 25–34 age group averages 37 minutes on Instagram, showing continued engagement but a noticeable drop from the youngest users.
- People aged 35–44 spend about 28 minutes on the platform, suggesting usage gradually declines as users move into older age groups.
- Instagram users aged 45–54 average 27 minutes, only slightly below the time recorded for the 35–44 demographic.
- The 55–64 age group spends an average of 26 minutes on Instagram, indicating relatively stable usage across middle-aged and older adults.
- Users aged 65 and above spend the least time on Instagram, averaging 20 minutes compared with all other age groups.
- Overall, average Instagram usage falls from 53 minutes to 20 minutes as age increases, revealing a clear age-based engagement gap.
Instagram Engagement Rate Statistics
- Nano-influencers with 1K-10K followers average a 4-4.5% engagement rate, vastly outperforming celebrity accounts, which average just 0.35%.
- Carousels earn 9 times more saves than other formats, proving that saves and shares are now the strongest engagement signals.
- Reels account for over 50% of time spent on the platform and generate 67% more engagement than standard videos.
- Less-produced, authentic content receives 1.8 to 2.0 times more comments than highly polished, promotional posts.
- Accounts maintaining a consistent schedule of 4-7 Reels per week see a 23% increase in overall reach.
- Educational accounts and tutorials consistently achieve high interaction levels, boasting an average engagement rate of 3.26%.
- Engagement on Reels is heavily dependent on the first few seconds, as audiences typically watch for only 4 seconds before scrolling.
- With overall average engagement rates dropping 20% in recent years, businesses are shifting focus from vanity metrics to quality interactions.
Instagram Hashtag Usage Statistics
- Using 3 to 5 highly targeted hashtags yields stronger results than using the maximum limit of 30.
- Posts utilizing 9 to 11 relevant hashtags can experience up to a 79.5% increase in overall reach.
- Adding just 1 hashtag to a post boosts interactions by 29% for accounts with under 1,000 followers.
- Over 60% of active users continue to discover new accounts through strategic hashtag searches.
- Consistent branded hashtags now account for 70% of all hashtags used across the platform.
- Hashtags containing 21 to 24 characters typically perform 20% better than shorter, generic tags.
- Research analyzing over 7 million Instagram hashtags confirms that niche community tags drive the highest engagement.
- The massively popular #love hashtag remains the most used globally, featured on over 2.1 billion posts.
Instagram Brand Content Engagement Insights
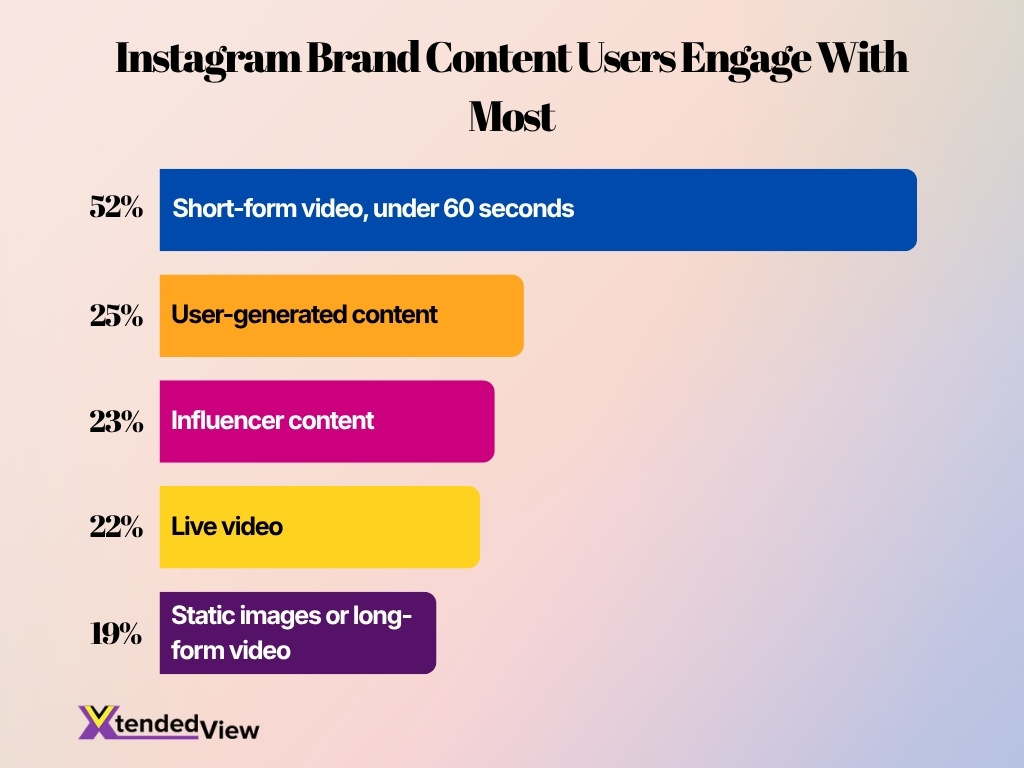
- Short-form videos under 60 seconds lead Instagram engagement, with 52% of users most likely to interact with this format.
- User-generated content ranks second at 25%, showing that authentic customer-created posts can strongly influence audience interest.
- Influencer content attracts 23% of users, highlighting the continued value of creator partnerships for brands on Instagram.
- Live video appeals to 22% of social users, suggesting that real-time and interactive content can support stronger audience connections.
- Static images and long-form videos receive the lowest engagement share at 19%, indicating a clear preference for faster, more dynamic content.
- Overall, Instagram users are more than twice as likely to engage with short-form video as with any other listed content type.
Instagram Stories Statistics
- Instagram Stories currently engage over 500 million daily active users globally.
- Brand-generated Stories achieve a highly impressive 88.2% completion rate among viewers.
- 58% of consumers report increased interest in a brand or product after viewing it on Stories.
- Exactly 50% of users have visited a website to make a purchase after seeing a product on Stories.
- Approximately 4 million businesses actively utilize Stories ads on a monthly basis.
- Stories ads that are organically shot on mobile outperform studio-shot ads 63% of the time.
- Utilizing interactive stickers like polls and quizzes boosts Story engagement by 15% to 25%.
- The average reach rate for an organic Instagram Story is approximately 4.8% of followers.
- Businesses and brands typically post an average of 13 to 15 Stories per month.
Instagram Reels Statistics
- Users reshare more than 4.5 billion Reels every day across Meta’s family of apps.
- In India, 89% of Gen Z users engage with Reels daily.
- Reels improve product discovery by 81% compared with other evaluated short-video platforms in commissioned consumer research.
- Reels influence 47% of purchase decisions across surveyed audiences in India.
- Creator engagement on Reels is approximately 60% higher than on other surveyed short-form video platforms.
- Beauty, fashion, lifestyle, fitness, comedy, and sports rank among the most-engaged Reels content categories.
- Reels remain Instagram’s primary discovery surface for creators seeking new audiences beyond existing followers.
- Businesses increasingly prioritize short, vertical videos because Reels consistently receive broader algorithmic distribution than many traditional feed posts.
U.S. Instagram Ad Revenue Trends
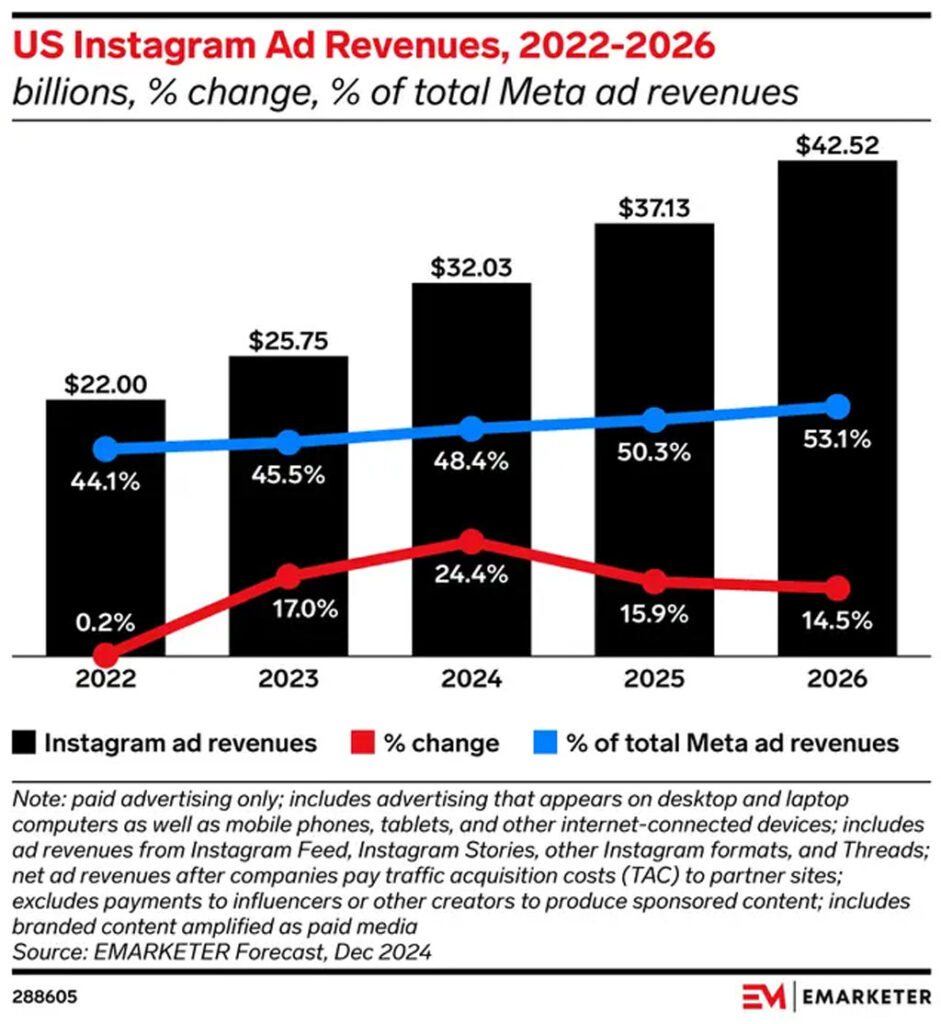
- U.S. Instagram ad revenue is projected to rise from $22.00 billion in 2022 to $42.52 billion in 2026, nearly doubling in four years.
- The strongest annual growth is expected in 2024, when revenue increases by 24.4% to reach $32.03 billion.
- Revenue growth remains positive throughout the period, although it slows to 15.9% in 2025 and 14.5% in 2026.
- Instagram’s share of Meta’s total U.S. ad revenue grows steadily from 44.1% in 2022 to 53.1% in 2026.
- Instagram is expected to account for more than half of Meta’s U.S. ad revenue for the first time in 2025, reaching 50.3%.
- Between 2023 and 2026, Instagram ad revenue is forecast to increase by $16.77 billion, highlighting its growing importance within Meta’s advertising business.
Instagram Shopping and Ecommerce Statistics
- Around 70% of Instagram users actively shop on the platform by browsing products or tapping tags.
- Instagram generated an estimated $37.2 billion in global social commerce revenue in 2024.
- Over 130 million users interact with shopping posts or product tags every single month.
- Approximately 54% of consumers have purchased a product after seeing it featured on Instagram.
- About 42% of U.S. social media users have bought at least one product directly through Instagram.
- More than 200 million users visit at least one business profile on a daily basis.
- An estimated 47% of U.S. social buyers are expected to make purchases on Instagram in 2026.
- Roughly 83% of active users say they rely on Instagram to discover new brands and products.
- Around 40% of Instagram shoppers spend more than $200 annually using the app’s shopping features.
- Over 25 million businesses worldwide currently utilize shoppable posts and in-app checkout tools.
Instagram Influencer Marketing Statistics
- The global influencer marketing industry is projected to reach $32.55 billion in 2025 and expand further into 2026.
- Instagram remains the most used platform, with 80% of marketers running influencer campaigns there in 2025.
- Nano creators with 1K to 10K followers hold the highest average engagement rate on Instagram at 4.5%.
- Instagram Reels deliver 22% more reach than standard feed posts for creators without paid boosting.
- Influencer marketing campaigns generate an average return on investment of $5.78 for every $1 spent.
- Short-form video dominates performance, with Instagram Reels generating nearly double the engagement of static images.
- Around 49% of consumers make a purchase at least once a month based on an influencer recommendation.
- Mid-tier creators with 100K to 500K followers deliver an average cost per thousand impressions of $9.60.
- Over 64% of branded Instagram accounts currently fall between the 100K and 1M follower range.
Instagram’s Position Among the Largest Social Platforms
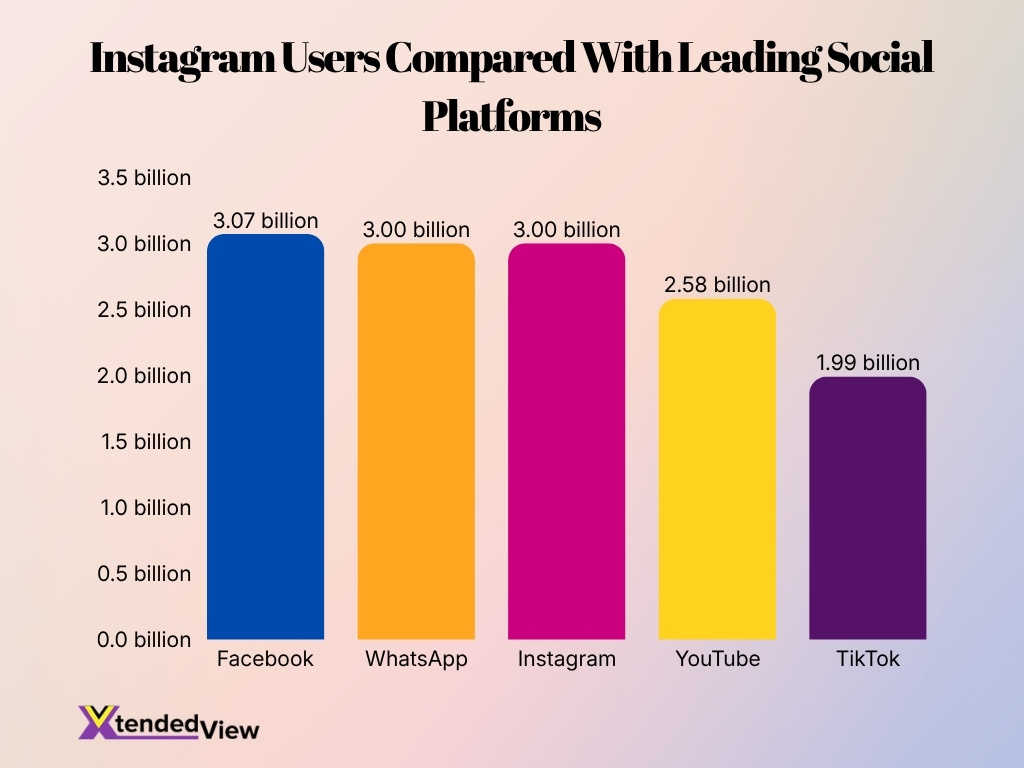
- Instagram has 3.00 billion monthly active users, making it the third-largest social platform worldwide.
- Instagram is tied with WhatsApp at 3.00 billion users, while Facebook leads with 3.07 billion.
- The gap between Instagram and Facebook is only 70 million users, showing Instagram’s massive global reach.
- Instagram has around 420 million more users than YouTube, which records 2.58 billion monthly active users.
- Compared with TikTok’s 1.99 billion users, Instagram reaches approximately 1.01 billion more people each month.
- Meta owns Facebook, WhatsApp, and Instagram, giving it control of all three leading social platforms in the ranking.
Instagram Creator Economy Statistics
- Over 4.5 billion Reels are shared daily across Meta platforms to maximize creator reach.
- The global creator economy is projected to reach an estimated $1.05 trillion by 2033.
- A significant 93.1% of brands prioritize Instagram as their primary influencer marketing channel.
- Paid subscriptions now account for up to 30% of total revenue for active creators.
- Instagram Reels consistently drive engagement by consuming 46% of total user time in-app.
- Businesses are expected to spend $42.5 billion on Instagram advertising campaigns throughout 2026.
- Over 75% of creators leverage AI tools and recommendation systems for content creation.
- Nearly 90% of brands intend to dedicate 20% of their marketing budgets toward creator partnerships.
- There are currently more than 64 million active influencers monetizing content globally on Instagram.
- Micro-influencers on the platform can reliably earn between $100 and $500 per sponsored post.
Instagram Algorithm and Reach Statistics
- Reels now account for 46% of the total time users spend on the platform.
- Direct message shares are weighted 3 to 5 times higher than likes for reaching new audiences.
- Original content receives 40% to 60% more distribution compared to repeatedly reposted material.
- Accounts posting 10 or more reposts in a 30-day window are completely excluded from Explore recommendations.
- Reels consistently generate an average engagement rate of 1.48% across all account sizes.
- Carousel posts featuring 7 to 10 slides produce 23% more engagement than shorter carousels.
- Over 78% of Explore page content is now surfaced directly by AI-powered recommendations.
- A video completion rate above 50% serves as the strongest algorithmic signal for wider Reels distribution.
- Adding a clear call to action (CTA) in captions increases overall user engagement by 42%.
Frequently Asked Questions (FAQs)
Instagram reached 3 billion monthly active users in 2025.
Instagram’s global advertising audience reached approximately 1.74 billion users in early 2025.
Instagram had approximately 481 million users in India by the end of 2025, making it the platform’s largest national audience.
Meta reported $56.31 billion in revenue for Q1 2026, representing a 33% year-over-year increase.
Meta’s ad impressions across its Family of Apps increased by 19% year over year in Q1 2026.
Conclusion
Instagram continues strengthening its position as one of the world’s most influential social media platforms, supported by continued user growth, AI-powered recommendations, short-form video adoption, and expanding creator monetization. The platform has evolved into a comprehensive ecosystem where consumers discover products, creators build sustainable businesses, and brands engage audiences through personalized content.
The latest statistics also show that Instagram’s influence extends well beyond social networking. From ecommerce and digital advertising to influencer marketing and the creator economy, the platform continues shaping how people communicate, shop, and consume content worldwide. As Meta invests further in artificial intelligence, creator tools, and advertising technologies, Instagram is expected to remain a critical channel for businesses, marketers, and creators targeting both US audiences and global markets.
