


Digital marketing now shapes how consumers discover products, compare brands, and make buying decisions. Businesses rely on search engines, social platforms, and digital ads to drive revenue and build customer relationships at scale. From e-commerce companies using AI-powered advertising to local businesses generating leads through search marketing, digital channels have become central to growth strategies. The statistics below reveal how the industry is evolving and where marketers are investing their budgets.
Editor’s Choice
- Global advertising spending is forecast to reach $1.26 trillion in 2026, highlighting the continued expansion of digital and traditional media investments.
- Worldwide digital ad spend is expected to hit $972.5 billion in 2026, growing by 13.2% year over year.
- Total U.S. advertising expenditure is projected to increase by 9.5% in 2026, with digital channels driving most of the growth.
- Google still dominates search with a 90.39% global market share as of May 2026.
- Around 68% of all online experiences begin with a search engine, emphasizing the importance of search visibility.
- Mobile devices generated 62.73% of global website traffic in Q1 2025, a trend that continues into 2026.
- Meta, Google, and Amazon are forecast to account for 62.3% of global digital advertising revenue in 2026, demonstrating the concentration of digital ad spending.
Recent Developments
- Global ad spending is expected to reach $1.23 trillion by the end of 2026, representing one of the strongest growth periods for the advertising industry.
- The worldwide digital advertising market is projected to grow from $662.3 billion in 2026 to nearly $1.69 trillion by 2033.
- Social media advertising expenditure in the U.S. is expected to rise by 14.6% in 2026, outpacing several traditional media channels.
- Connected TV advertising spending is projected to increase by 13.8% in 2026, fueled by the continued shift from linear television.
- Commerce media advertising is forecast to expand by 12.1% in 2026, making it one of the fastest-growing digital advertising segments.
- Meta’s global ad revenue is projected to reach $243.46 billion in 2026, surpassing Google for the first time.
- Retail media advertising is expected to grow by 12.3% in 2026, reflecting increased investment in commerce-led marketing strategies.
- U.S. creator and influencer advertising spending is expected to reach $37 billion, nearly triple its 2021 level.
- Approximately 89% of U.S. companies are expected to invest in influencer marketing during 2026.
Digital Marketing Industry Overview
- The global digital advertising market was valued at $567.9 billion in 2025 and continues to accelerate in 2026.
- Worldwide digital ad spending reached approximately $709.65 billion in 2025 and is expected to climb to $781.17 billion in 2026.
- Digital ad spending is forecast to exceed $1.48 trillion by 2029, illustrating sustained long-term growth.
- Asia-Pacific accounted for 31.5% of global digital advertising revenue in 2025, making it the largest regional market.
- More than 2 billion people use WhatsApp globally, giving brands access to one of the world’s largest messaging audiences.
- Organic search is expected to generate 53% of all website traffic in 2026, far exceeding paid traffic sources.
- Over 75% of B2B website traffic comes from organic and paid search combined.
- Digital advertising is projected to maintain a double-digit annual growth rate through 2029, driven by AI, e-commerce, and mobile usage.
- India’s advertising expenditure is projected to rise from 0.4% to nearly 0.5% of GDP by 2029, reflecting strong digital adoption in emerging markets.
Digital Marketing Channel Adoption Trends
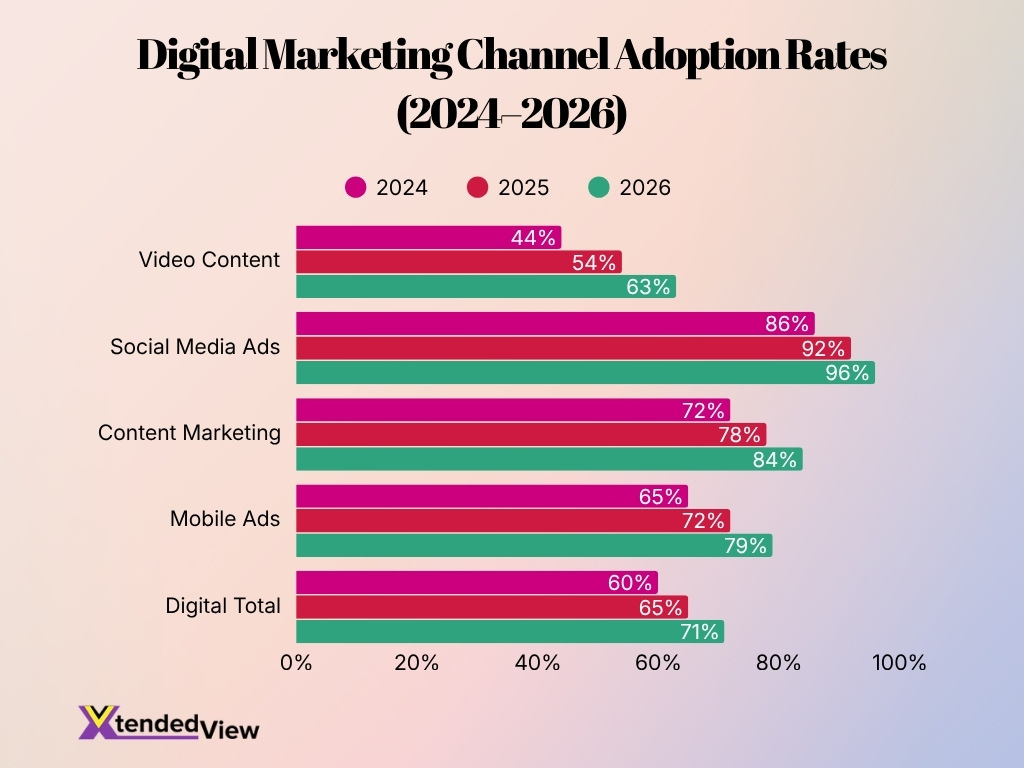
- Social Media Ads remained the most adopted digital marketing channel, rising from 86% in 2024 to 96% in 2026.
- Video Content recorded the fastest growth, increasing from 44% to 63%, a gain of 19 percentage points over three years.
- Content Marketing adoption climbed steadily from 72% in 2024 to 84% in 2026, highlighting its growing role in marketing strategies.
- Mobile Ads usage expanded from 65% to 79%, reflecting the continued shift toward mobile-first advertising.
- Overall, Digital Marketing adoption increased from 60% in 2024 to 71% in 2026, showing broader investment in digital channels.
- Every marketing channel shown experienced year-over-year growth between 2024 and 2026, with no declines reported.
- By 2026, four out of five marketing channels achieved an adoption rate of 79% or higher, demonstrating widespread industry adoption.
- The data indicates that businesses are increasingly prioritizing video, social media, content marketing, and mobile advertising to strengthen their digital marketing efforts.
Digital Ad Spend Statistics
- Global digital ad spending is expected to reach $972.5 billion in 2026, up from approximately $859 billion in 2025.
- The digital advertising market is projected to grow at a 15.1% CAGR between 2026 and 2029.
- Worldwide advertising spending is forecast to surpass $1.26 trillion in 2026.
- Global ad expenditure is expected to increase by 7% in 2026, following a 7.2% increase in 2025.
- U.S. advertising spending is projected to rise by 9.5% in 2026.
- Digital advertising revenue generated by Meta is expected to reach $243.46 billion in 2026.
- Google’s digital advertising revenue is projected at $239.54 billion in 2026.
- Meta, Google, and Amazon together are forecast to capture 62.3% of global digital ad revenue in 2026.
- Retail media advertising is expected to post double-digit growth of 12.3% during 2026.
- Connected TV advertising spending is expected to increase by 13.8%, one of the fastest-growing ad categories.
Search Engine Optimization Statistics
- 68% of online experiences start with a search engine.
- Google held a 90.39% global search market share in May 2026.
- Bing accounted for 5.03% of the global search market in May 2026.
- The first organic result on Google has an average click-through rate of 39.8%.
- The top three organic search results receive 68.7% of all clicks on a search results page.
- Approximately 96.6% of Google search clicks occur on the first page of results.
- Around 50% of Google users click a search result within nine seconds of performing a search.
- The average internet user performs three to four searches every day.
- Organic search remains the second-largest traffic source at 29% of total website traffic.
- Roughly 94% of webpages receive no traffic from Google, underscoring the competition for search visibility.
Most Popular SEO Tools
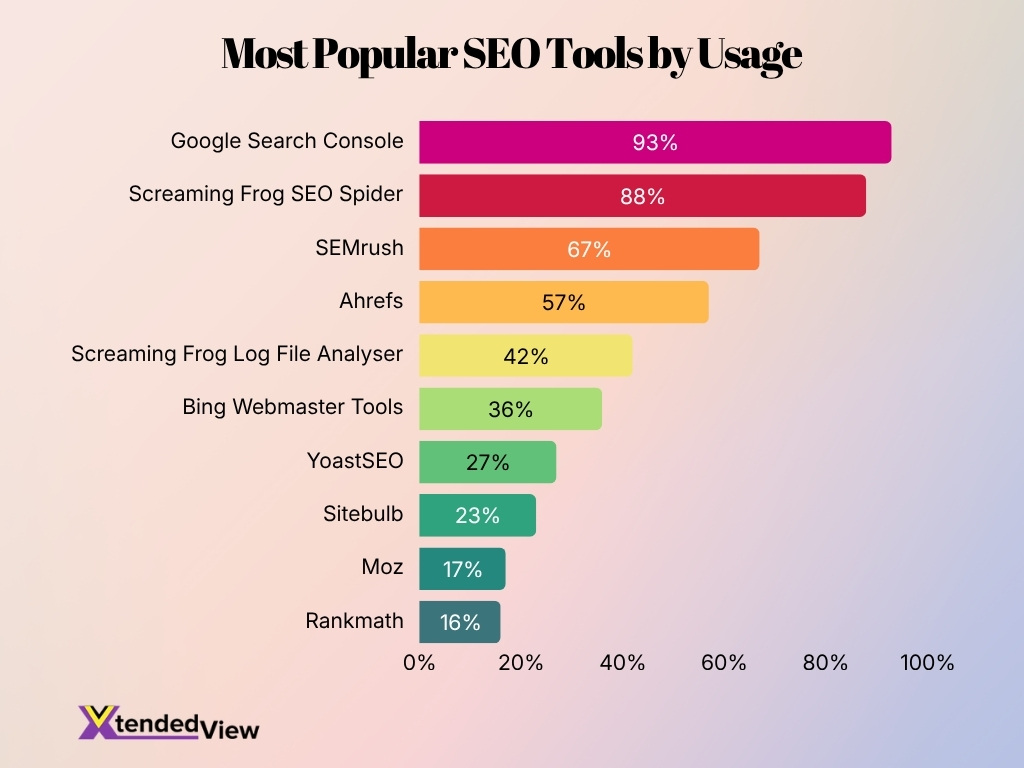
- Google Search Console is the most popular SEO tool, with an impressive 93% usage rate among users.
- Screaming Frog SEO Spider ranks second with 88%, making it one of the leading technical SEO auditing tools.
- SEMrush secures third place with 67%, highlighting its strong adoption for all-in-one SEO and marketing tasks.
- Ahrefs is used by 57% of respondents, reinforcing its popularity for backlink analysis and keyword research.
- Screaming Frog Log File Analyser reaches 42% usage, showing significant demand for log file analysis.
- Bing Webmaster Tools is utilized by 36% of users, making it a valuable secondary search engine optimization platform.
- YoastSEO records 27% usage, reflecting its continued popularity among WordPress website owners.
- Sitebulb is used by 23% of SEO professionals, indicating steady adoption for technical website audits.
- Moz achieves a 17% usage rate, maintaining a presence despite increased competition from newer SEO platforms.
- RankMath ranks 10th with 16%, showing growing adoption as a WordPress SEO plugin.
Paid Search and PPC Statistics
- Search engine traffic grew by 0.4% during 2025, even as the digital landscape became more fragmented.
- Google search traffic increased by 0.8% in 2025, showing continued resilience despite AI competition.
- Around 90% of search clicks remain organic, while paid ads account for approximately 10%.
- AI-generated search summaries now appear in roughly 30% of search engine results pages.
- Search results featuring AI summaries can reduce click-through rates by 35%.
- Queries with Google AI Overviews experienced a 61% decline in organic CTR, dropping from 1.76% to 0.61%.
- Google’s AI-generated summaries contributed to an increase in zero-click searches from 56% to 69% for news-related queries.
- Exposure to AI-generated search summaries reduced Wikipedia traffic by approximately 15%, according to academic research.
- SEO-generated leads can convert 8.5 times better than outbound marketing leads, highlighting the value of search-driven acquisition.
- Updating and republishing older content can increase organic traffic by as much as 106%.
Content Marketing Statistics
- The global content marketing industry is expected to reach $1.95 trillion by 2032, growing at a CAGR of more than 16%.
- About 82% of companies actively use content marketing as part of their digital strategies.
- Around 73% of B2B marketers and 70% of B2C marketers use content marketing in their campaigns.
- Companies that maintain blogs generate 67% more leads than businesses that do not publish blog content.
- Content marketing costs 62% less than traditional marketing and generates approximately three times as many leads.
- Nearly 58% of marketers say original written content remains their highest-performing content format.
- Businesses that publish at least 16 blog posts per month generate 3.5 times more traffic than companies posting four times or less.
- Approximately 80% of consumers prefer learning about brands through content rather than traditional advertisements.
- Around 71% of marketers use content marketing to nurture leads and build customer trust.
- More than 50% of marketers plan to increase content marketing budgets during 2026.
How AI Tools Have Enhanced Content Quality
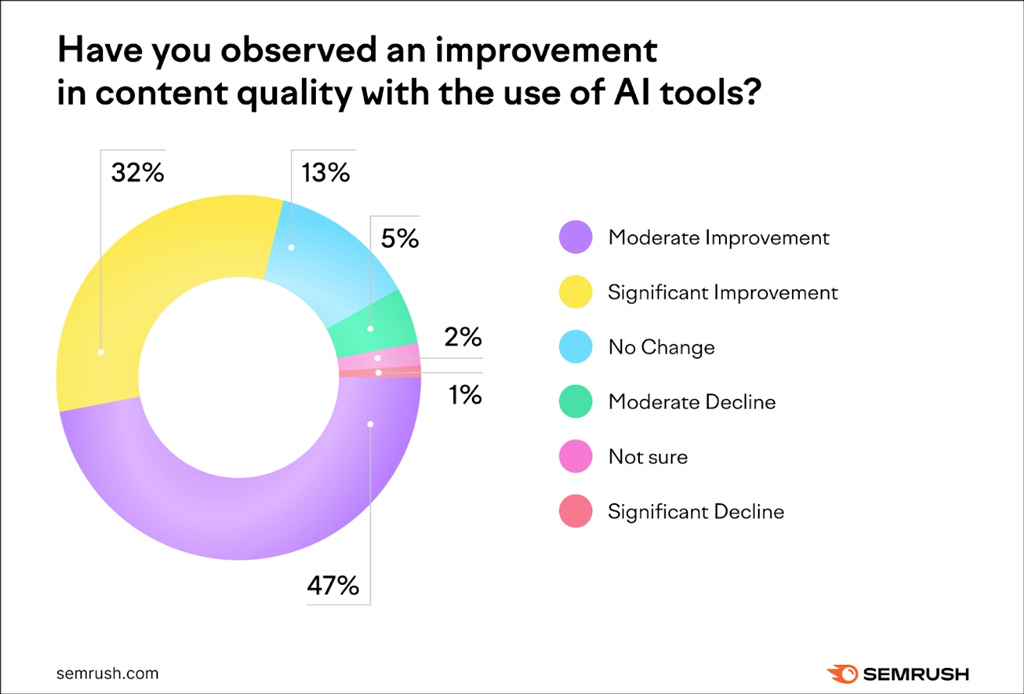
- 47% of respondents reported a moderate improvement in content quality after adopting AI tools.
- 32% experienced a significant improvement, indicating strong confidence in AI-assisted content creation.
- Only 13% observed no change, suggesting AI has had a measurable impact for most users.
- Just 5% reported a moderate decline in content quality with AI tool usage.
- A mere 1% experienced a significant decline, showing that negative outcomes are uncommon.
- 2% of respondents were not sure whether AI tools improved their content quality.
- Overall, 79% of respondents reported either a moderate or significant improvement, highlighting the positive influence of AI on content quality.
Email Marketing Statistics
- Global email users are projected to reach 4.89 billion in 2027, up from approximately 4.59 billion in 2025.
- Email marketing delivers an average return of $36 for every $1 spent, making it one of the highest-ROI channels.
- About 88% of users check their email accounts multiple times each day.
- Nearly 64% of small businesses use email marketing to reach customers.
- Personalized email campaigns generate transaction rates that are six times higher than non-personalized emails.
- Approximately 37% of brands are increasing their email marketing budgets in 2026.
- Around 41% of marketers consider email their most effective marketing channel.
- Automated emails generate 320% more revenue than non-automated messages.
- Email marketing revenue worldwide is expected to surpass $17.9 billion by 2027.
- Nearly 99% of email users check their inbox at least once per day.
Mobile Marketing Statistics
- Mobile devices generated 62.73% of global website traffic during early 2025, and the trend continues in 2026.
- Global mobile advertising spending is expected to exceed $495 billion in 2026.
- Smartphone users worldwide surpassed 4.9 billion people in 2025.
- Nearly 96% of internet users access the web through mobile devices.
- About 92.3% of internet users connect via smartphones.
- Mobile commerce is projected to account for 59% of all retail e-commerce sales in 2026.
- Around 76% of consumers make purchases using smartphones because of convenience and faster checkout experiences.
- Businesses with mobile-optimized websites are 67% more likely to convert visitors into customers.
- More than 70% of consumers prefer mobile apps over websites for shopping and brand interactions.
- Approximately 88% of mobile time is spent inside apps rather than web browsers.
Social Media Marketing Platform Adoption Statistics
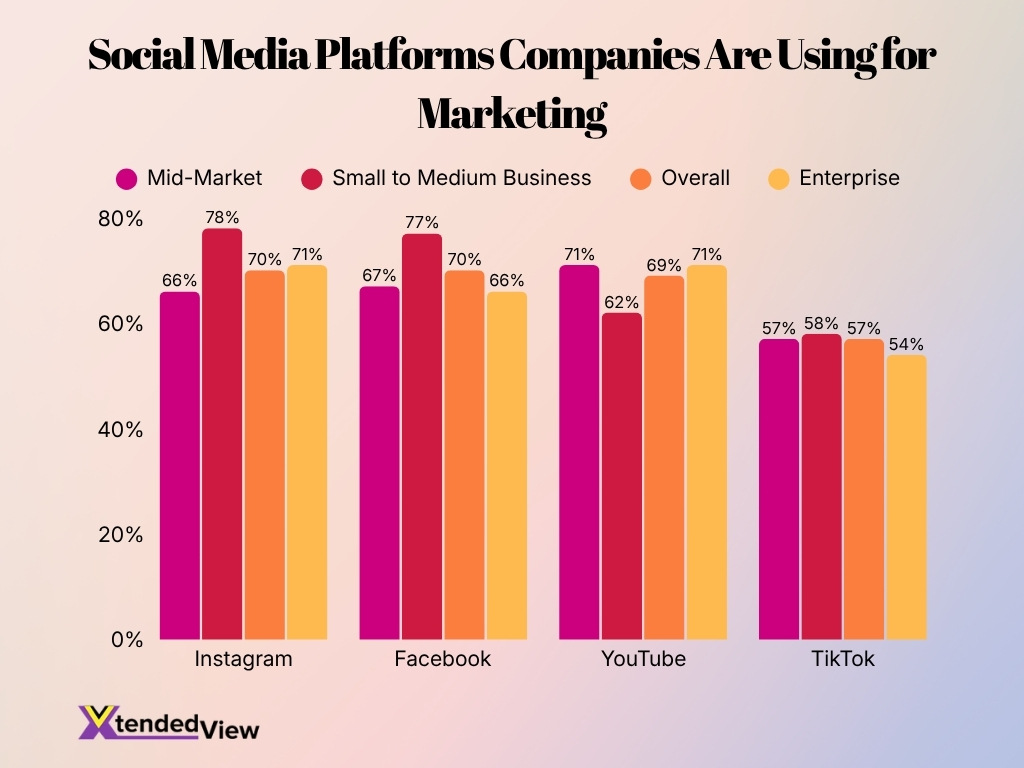
- Instagram is the most widely used platform among small to medium businesses, with 78% using it for marketing.
- Facebook remains highly popular, with 77% of small to medium businesses and 70% overall using it for marketing.
- YouTube has the highest adoption among mid-market and enterprise companies, with 71% usage in both segments.
- Instagram is used by 70% of companies overall, making it one of the top marketing platforms.
- Facebook matches Instagram’s overall adoption at 70%, highlighting its continued importance for marketers.
- YouTube is adopted by 69% of companies overall, ranking just behind Instagram and Facebook.
- TikTok has an overall marketing adoption rate of 57%, showing strong but comparatively lower business usage.
- Enterprise companies use Instagram (71%) and YouTube (71%) equally, making them their leading marketing channels.
- Mid-market companies favor YouTube (71%) over Instagram (66%) and Facebook (67%) for marketing.
- TikTok records the lowest enterprise adoption at 54%, compared to 58% among small to medium businesses.
Influencer Marketing Statistics
- The global influencer marketing industry is projected to reach $33 billion in 2026, up from $24 billion in 2024.
- Approximately 89% of marketers plan to maintain or increase influencer marketing budgets in 2026.
- Businesses earn an average of $5.78 for every $1 spent on influencer marketing.
- About 63% of consumers trust influencer recommendations more than brand advertising.
- Nearly 86% of consumers make a purchase inspired by an influencer at least once per year.
- Micro-influencers generate engagement rates that are 60% higher than those of macro-influencers.
- Around 69% of consumers trust recommendations from influencers they follow.
- Instagram remains the leading influencer platform, used by over 79% of brands running influencer campaigns.
- TikTok influencer campaigns deliver engagement rates exceeding 4%, significantly higher than many other platforms.
- The U.S. creator economy is expected to generate $37 billion in advertising spending during 2026.
Video Marketing Statistics
- The global video marketing market is projected to reach $145 billion by 2028, growing rapidly due to streaming and short-form content.
- About 91% of businesses use video as a marketing tool in 2026.
- Around 89% of consumers say watching a video convinced them to buy a product or service.
- Short-form videos deliver the highest ROI of any social media content format.
- Consumers spend an average of 17 hours per week watching online videos.
- Approximately 96% of consumers watch explainer videos to learn about products and services.
- Around 82% of all internet traffic comes from video content.
- Nearly 90% of marketers report a positive ROI from video marketing campaigns.
- YouTube remains the second-largest search engine with more than 2.7 billion monthly users.
- About 66% of marketers plan to increase spending on video marketing during 2026.
The Ideal Marketing Video Length
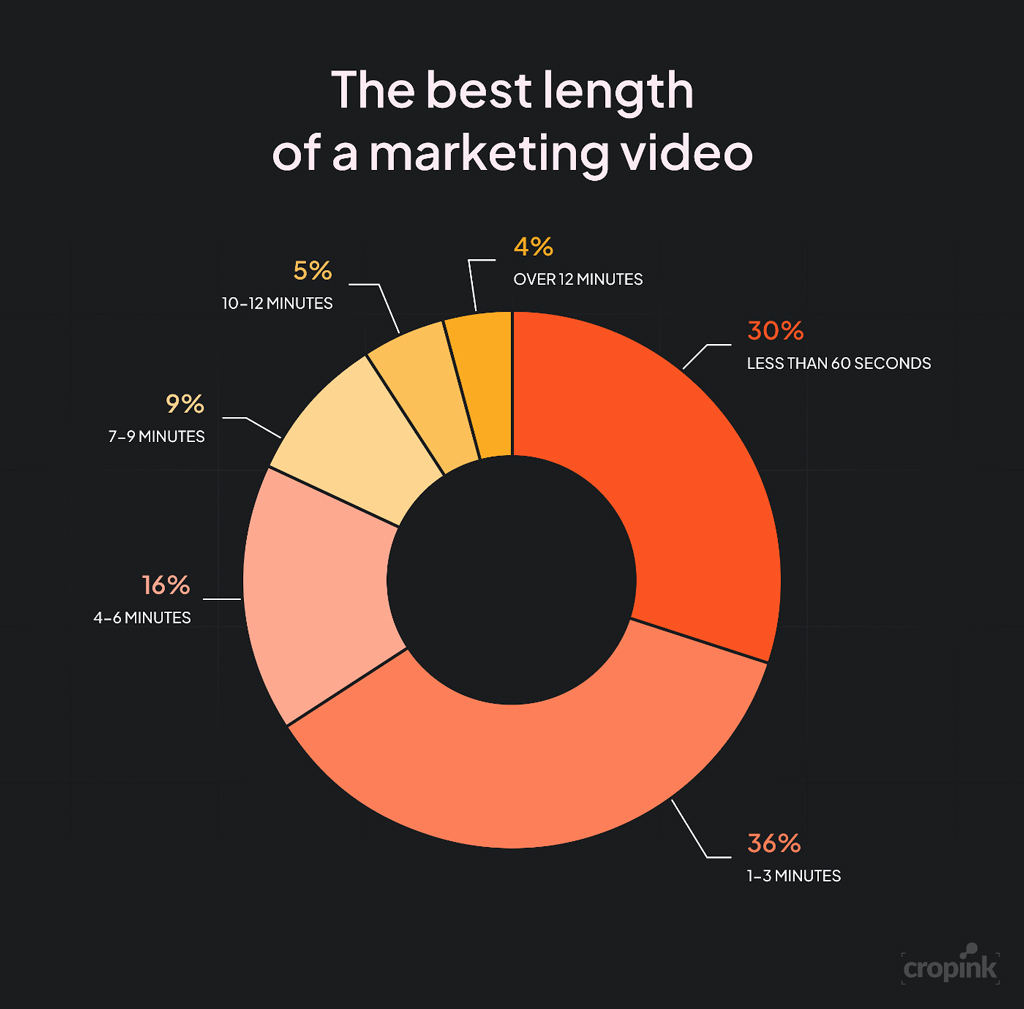
- 1–3 minute videos are the most preferred format, chosen by 36% of marketers, making them the ideal length for audience engagement.
- Short videos under 60 seconds rank second, with 30% preference, highlighting the growing demand for quick, snackable content.
- 4–6 minute videos are favored by 16%, making them suitable for detailed product demos and educational content.
- 7–9 minute videos account for 9% of preferences, indicating a smaller audience for longer marketing videos.
- Only 5% of respondents prefer videos lasting 10–12 minutes, showing limited interest in extended content.
- Videos that run over 12 minutes are the least popular, receiving just 4% of preferences.
- Overall, 66% of marketers favor videos that are 3 minutes or shorter, emphasizing the importance of concise and engaging content.
- The data suggests that short-form video marketing continues to dominate due to higher viewer retention and stronger engagement.
Affiliate Marketing Statistics
- The global affiliate marketing industry is projected to reach $40 billion by 2030, nearly doubling its current size.
- Affiliate marketing spending in the United States is expected to exceed $13 billion in 2026.
- Approximately 81% of brands operate affiliate programs to drive sales and customer acquisition.
- Around 16% of all online orders in the U.S. originate from affiliate marketing channels.
- Affiliate marketing drives roughly 15% of digital media revenue worldwide.
- More than 80% of advertisers say affiliate marketing increases brand awareness and customer acquisition.
- About 65% of affiliate marketers rely on blogging and content websites as their primary traffic sources.
- The average affiliate marketer earns approximately $8,038 per month, although income varies significantly by niche and experience.
- Around 31% of publishers identify affiliate marketing as one of their top revenue sources.
- Nearly 54% of affiliate marketers use SEO as their primary customer acquisition strategy.
Marketing Automation Statistics
- The global marketing automation market is projected to reach $8.42 billion in 2026, up from approximately $7.1 billion in 2025.
- The industry is forecast to surpass $21.7 billion by 2032, reflecting sustained double-digit growth.
- Around 58% of marketers currently use marketing automation software to manage campaigns and customer journeys.
- Approximately 76% of companies generate a positive return on investment within the first year of implementing marketing automation.
- Businesses using automation experience an average 14.5% increase in sales productivity and a 12.2% reduction in marketing overhead costs.
- Nearly 80% of marketing automation users report generating more leads through automated campaigns.
- About 91% of marketers say automation helps them achieve campaign goals more efficiently.
- Companies that automate lead management can see a 10% or greater increase in revenue within six to nine months.
- Roughly 63% of businesses plan to increase spending on marketing automation technologies during 2026.
- Email automation remains the most widely used feature, with 64% of marketers relying on automated email workflows.
AI Marketing Statistics for Digital Marketing
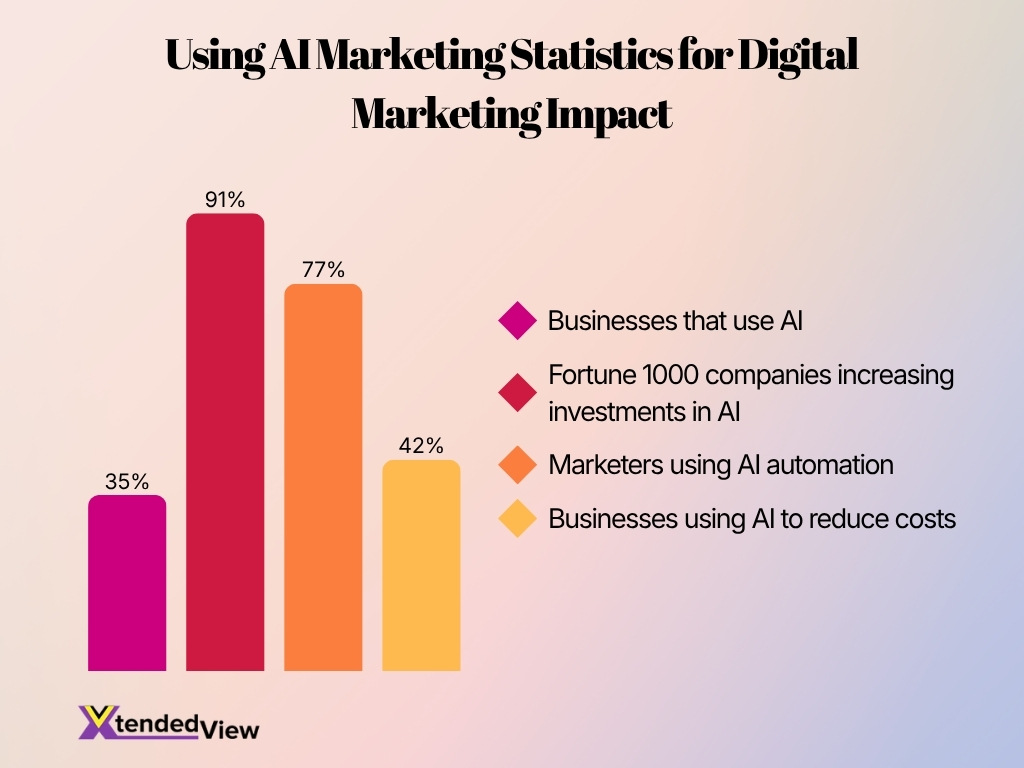
- 35% of businesses currently use AI, highlighting its growing role in modern digital marketing strategies.
- 91% of Fortune 1000 companies are increasing investments in AI, showing strong enterprise confidence in AI-driven innovation.
- 77% of marketers are using AI automation to improve campaign efficiency, personalization, and productivity.
- 42% of businesses use AI to reduce costs, demonstrating its value in improving operational efficiency and lowering expenses.
Lead Generation Statistics
- Around 91% of marketers identify lead generation as their most important business objective.
- Companies with effective lead nurturing strategies generate 50% more sales-ready leads at a 33% lower cost.
- Approximately 53% of marketers allocate at least half of their budgets to lead generation initiatives.
- Organizations that excel at lead nurturing produce 50% more qualified leads while reducing costs substantially.
- Businesses with blogs generate 67% more monthly leads than companies without blogs.
- Around 80% of new leads never convert into sales, highlighting the importance of nurturing and engagement.
- Nearly 68% of B2B businesses struggle with lead generation and conversion processes.
- Companies that respond to inquiries within five minutes are 21 times more likely to qualify a lead compared with those responding after 30 minutes.
- Approximately 54% of marketers say improving lead quality remains their biggest challenge.
- Businesses using marketing automation for lead management generate 451% more qualified leads than non-users.
Customer Engagement Statistics
- Around 86% of consumers are willing to pay more for a better customer experience.
- Companies that prioritize customer experience generate revenue growth rates that are 4% to 8% higher than competitors.
- Approximately 73% of consumers expect brands to understand their unique needs and expectations.
- Nearly 65% of customers say a positive experience with a brand influences their purchasing decisions more than advertising.
- About 88% of customers consider experience to be as important as products and services.
- Personalized experiences can increase customer spending by up to 38%.
- Roughly 80% of consumers are more likely to purchase from brands that provide personalized experiences.
- Companies with highly engaged customers achieve 23% greater profitability than competitors with lower engagement levels.
- Nearly 71% of consumers expect companies to deliver personalized interactions, and 76% become frustrated when this does not happen.
- Brands that improve customer engagement strategies can increase retention rates by as much as 25%.
Marketing ROI Statistics
- Email marketing continues to deliver one of the strongest returns, generating an average of $36 for every $1 spent.
- Businesses implementing data-driven personalization report revenue increases of 5% to 15% and marketing efficiency gains of 10% to 30%.
- Content marketing generates approximately three times more leads than traditional marketing while costing 62% less.
- Companies that use marketing automation experience an average 14.5% improvement in sales productivity.
- Around 49% of organizations say organic search delivers the highest marketing ROI among digital channels.
- Approximately 44% of marketers report that social media marketing has directly improved revenue generation.
- Businesses that invest in customer experience initiatives can achieve ROI improvements ranging from 25% to 95% through increased retention.
- Brands using AI-powered marketing tools report campaign efficiency improvements of up to 30%.
- Video marketers are 66% more likely to generate qualified leads annually than marketers who do not use video.
- Organizations with mature omnichannel strategies retain an average of 89% of customers, compared with 33% for companies with weak omnichannel engagement.
Frequently Asked Questions (FAQs)
Global advertising spending is forecast to reach $1.26 trillion in 2026, with digital channels accounting for the majority of growth.
The global digital ad spend market is expected to reach $972.5 billion in 2026, growing by 13.2% year over year.
There are approximately 5.79 billion social media users worldwide in 2026, representing nearly 70% of the global population.
Digital advertising is forecast to account for 68.7% of total global advertising investment in 2026.
The global digital advertising market is projected to expand at a 14.3% CAGR from 2026 to 2033, increasing from $662.3 billion in 2026 to $1.69 trillion by 2033.
Conclusion
Digital marketing continues to evolve at a rapid pace, driven by artificial intelligence, automation, mobile experiences, and data-driven personalization. Businesses now invest heavily in search, social media, video, and customer engagement technologies because digital channels directly influence revenue and brand growth.
The statistics throughout this report reveal a clear pattern: organizations that embrace AI, automation, and personalized customer experiences consistently achieve stronger engagement, higher lead quality, and better marketing ROI. As digital ecosystems become more competitive, marketers who adapt to changing consumer behavior and emerging technologies will be better positioned to capture growth opportunities in the years ahead.
