



Global supply chains form the backbone of modern commerce by connecting manufacturers, suppliers, logistics providers, distributors, retailers, and consumers across the world. They influence nearly every industry, from e-commerce order fulfillment, automotive manufacturing, and healthcare to food distribution, consumer electronics, and semiconductor production. As businesses navigate geopolitical uncertainty, shifting trade policies, rising transportation costs, labor shortages, and rapid advances in artificial intelligence, supply chain performance has become a critical driver of operational efficiency and long-term competitiveness.
Organizations are placing greater emphasis on resilience, digital transformation, sustainability, and regional sourcing to reduce risk while maintaining profitability. Companies are also investing heavily in automation, real-time visibility, predictive analytics, and smarter inventory management to improve decision-making and customer service. The statistics in this report provide a comprehensive overview of the latest supply chain trends, market developments, technology adoption, and operational challenges, helping business leaders, investors, and industry professionals better understand where the global supply chain is heading.
Editor’s Choice
- Global trade exceeded $35 trillion in 2025, marking a record high despite geopolitical tensions, while growth is expected to remain positive in 2026 at a slower pace.
- Gartner ranked Schneider Electric as the world’s leading supply chain organization for the fourth consecutive year in 2026, highlighting continued investment in AI-powered operations.
- Supply chain disruption levels in May 2026 nearly matched the peak recorded during early 2022, with approximately 2.06 million TEUs affected by delays and rerouting.
- The use of imported goods and services in global production reached levels close to historical highs in 2024, showing that globalization remains resilient.
- Cross-border trade flows remained near record highs in 2026 despite rising tariffs and geopolitical uncertainty.
- Leading organizations increasingly redesign workflows around AI and autonomous operations, rather than using AI only for task automation.
- Logistics providers continued to benefit from supply chain volatility during 2026 as constrained freight capacity and changing trade routes supported stronger shipping demand.
Recent Developments
- Global merchandise trade expanded strongly throughout 2025, although international organizations expect slower growth during 2026 because of geopolitical uncertainty.
- Gartner identified autonomous workforces, AI-enabled decision making, and network-centric supply chains as three defining trends among top-performing organizations in 2026.
- Global supply chain pressure increased throughout 2024 and 2025 before reaching disruption levels comparable to early 2022 during 2026.
- Companies are reconfiguring global value chains instead of abandoning globalization, with connector economies playing a larger role.
- Cross-border trade distances reached record levels even as U.S.-China trade represented only 2.0% of global trade in 2026, down from 2.7% in 2024.
- Geopolitical fragmentation, green transition policies, and digital trade emerged as key forces reshaping supply chains during 2026.
- Large logistics providers reported stronger freight demand due to ongoing shipping disruptions and rerouted trade corridors.
- AI adoption increasingly shifted from pilot projects toward operational redesign among leading supply chain organizations.
- Businesses increasingly balanced cost, resilience, and flexibility instead of optimizing only for the lowest procurement cost.
Supply Chain Management Market Size Trends
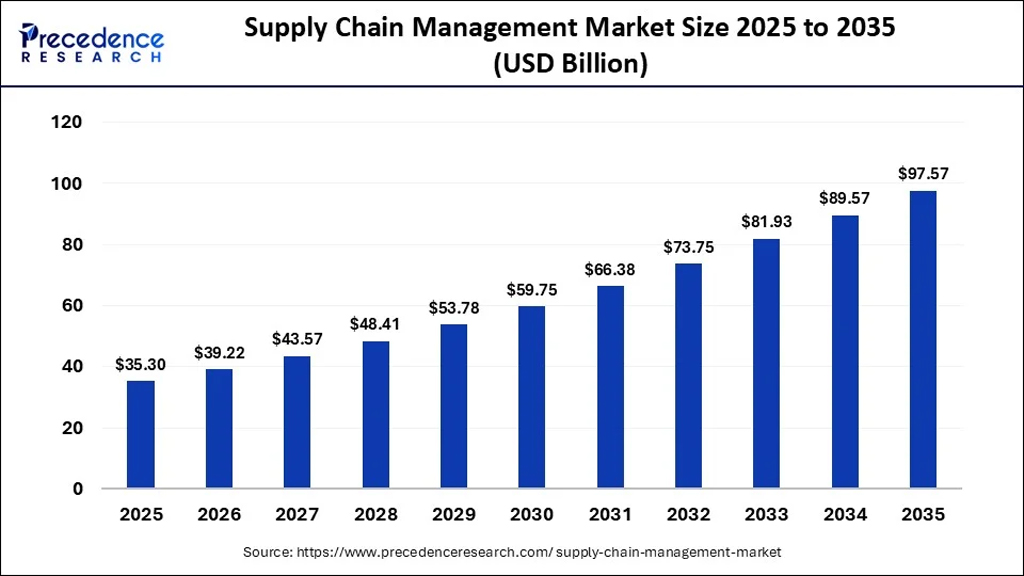
- The global supply chain management market is projected to grow from $35.30 billion in 2025 to $97.57 billion by 2035, highlighting strong long-term market expansion.
- In 2026, the market is expected to reach $39.22 billion, reflecting steady year-over-year growth.
- The market is forecast to increase to $43.57 billion in 2027, surpassing the $40 billion milestone.
- By 2028, the industry is projected to be worth $48.41 billion, approaching the $50 billion mark.
- The market is expected to exceed $50 billion for the first time in 2029, reaching $53.78 billion.
- In 2030, the supply chain management market is forecast to grow to $59.75 billion, nearing $60 billion.
- The industry is projected to cross $65 billion in 2031, with a market size of $66.38 billion.
- By 2032, the market is anticipated to reach $73.75 billion, reflecting sustained investment in supply chain technologies.
- In 2033, the market is forecast to surpass $80 billion, totaling $81.93 billion.
- The industry is expected to climb to $89.57 billion in 2034, maintaining strong annual growth momentum.
- By 2035, the global supply chain management market is projected to achieve $97.57 billion, nearly tripling its 2025 market value.
Supply Chain Costs and Financial Impact
- DHL reported 13% year-over-year revenue growth in Q2 2026, reaching €22.4 billion due to stronger shipment volumes.
- Global supply chain disruptions cost businesses an estimated $184 billion annually in measurable output losses.
- Widespread delivery delays and supply shocks eroded an average of 8% of annual revenues for companies globally.
- Nearly $1.7 trillion in working capital is tied up in excess inventory to build resilience against trade fragmentation.
- A staggering 94% of companies reported that their financial revenues were negatively affected by supply network bottlenecks.
- Investing in better supply chain visibility allowed manufacturers to reduce expedited shipping costs by 30% to 50%.
- Rerouted cargo and longer transit times caused a 17% increase in global ton-miles, driving up overall transportation costs.
- Major supply chain shocks occur every 3.7 years, erasing approximately 45% of a company’s annual EBITDA over a decade.
Logistics and Freight Market Statistics
- Global logistics demand remained strong during 2026 despite volatile trade conditions.
- DHL recorded 13% revenue growth in the second quarter of 2026, exceeding analyst expectations.
- Higher shipment volumes and constrained air freight capacity contributed to stronger logistics revenues in 2026.
- Low water levels along the Rhine shifted freight from inland waterways to road transportation, increasing trucking demand.
- Shipping rerouting and geopolitical instability continued supporting elevated freight rates throughout 2026.
- Around 2.06 million TEUs were tied up in shipping delays during May 2026 because of supply chain disruptions.
- Global logistics providers increasingly benefited from customers seeking alternative transport routes during ongoing trade disruptions.
- International freight markets remained influenced by Red Sea shipping risks, longer transit routes, and fuel-related cost increases.
- Major logistics companies maintained optimistic outlooks for 2026 because businesses continued investing in resilient transportation networks.
Technology Adoption Statistics in Supply Chain Management
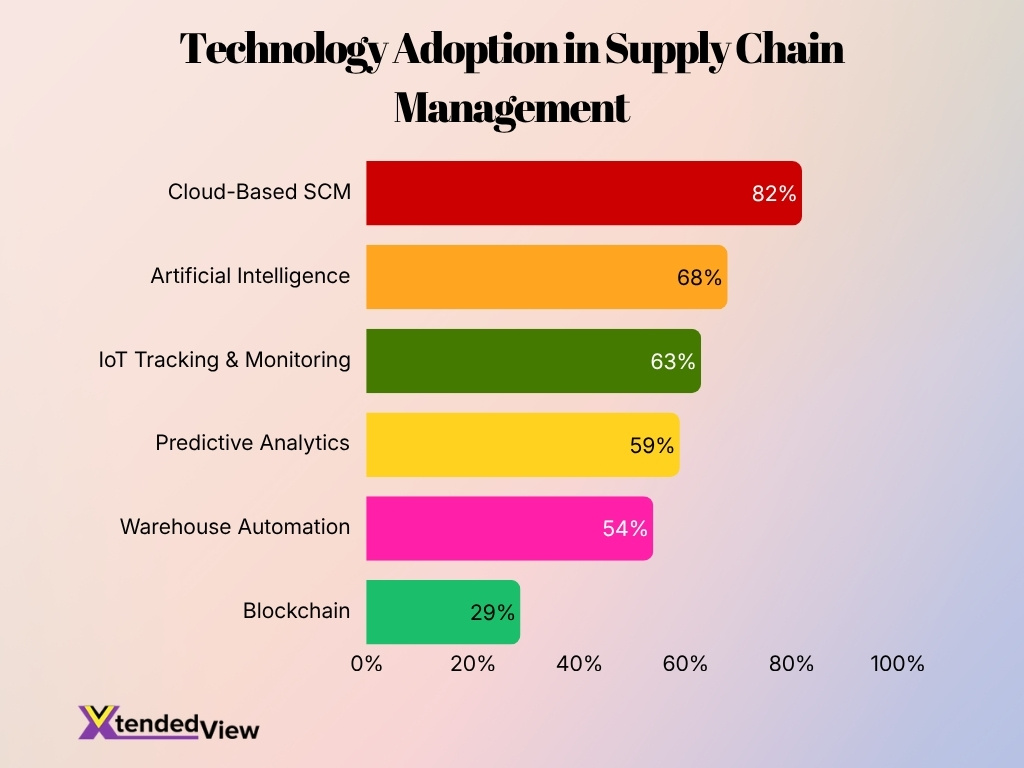
- Cloud-Based SCM is the most widely adopted technology, with 82% of organizations using cloud platforms to improve collaboration, scalability, and real-time supply chain visibility.
- Artificial Intelligence (AI) has been adopted by 68% of organizations, helping automate planning, demand forecasting, and operational decision-making.
- IoT Tracking & Monitoring is utilized by 63% of companies, enabling real-time asset tracking, shipment monitoring, and improved inventory accuracy.
- Predictive Analytics is used by 59% of organizations to anticipate demand fluctuations, optimize inventory levels, and reduce supply chain disruptions.
- Warehouse Automation has reached 54% adoption, allowing businesses to improve fulfillment speed, reduce labor costs, and increase operational efficiency.
- Despite growing interest, Blockchain remains the least adopted technology at 29%, primarily being used for supply chain traceability, transparency, and secure record-keeping.
- The gap between the highest and lowest adoption technologies is 53 percentage points, highlighting that mature digital solutions significantly outpace emerging technologies.
- More than half of organizations have already implemented five of the six listed technologies, demonstrating a strong industry shift toward digital transformation.
- The data indicates that technologies focused on visibility, automation, and data-driven decision-making are receiving the highest levels of enterprise investment.
Supply Chain Disruptions and Shortages
- Approximately 2.06 million TEUs experienced cargo delays or rerouting worldwide in May 2026.
- The Global Supply Chain Pressure Index spiked by 1.5 standard deviations, nearing peak 2022 disruption levels.
- Average ocean transit times increased by 14 to 21 days due to ongoing geopolitical conflicts.
- Over 60% of multinational corporations faced higher operating costs driven by rising protectionism and tariffs.
- Around 73% of businesses have successfully diversified their supplier base to mitigate global sourcing risks.
- Global logistics providers expanded their contingency planning budgets by an estimated 35% year-over-year.
- Nearly 80% of organizations invested directly in digital visibility and AI-assisted planning to reduce future risks.
- Supply chain resilience initiatives now account for up to 25% of total capital expenditure across major industries.
Supply Chain Resilience and Risk Management
- In a 2025 survey of 100 global supply chain organizations, 82% said new tariffs affected their supply chains, with roughly 20% to 40% of supply chain activity exposed. This shows how trade policy has become a direct operational risk rather than only a finance concern.
- Among companies experiencing tariff effects, 45% increased inventory buffers to reduce exposure to sudden cost changes or border disruptions.
- Another 39% pursued dual-sourcing strategies for components or raw materials in 2025, reducing dependence on single suppliers and single-country sourcing.
- Meanwhile, 33% developed supplier nearshoring or onshoring plans as a resilience measure. About 12% said tariffs alone drove their nearshoring strategies.
- All surveyed companies that identified tariff-related exposure had either prepared or already implemented mitigation measures, indicating a 100% response among affected organizations.
- Supplier costs remain a major risk; 39% of respondents reported higher supplier and material expenses because of new tariffs during 2025.
- Demand risk also increased, with 30% of organizations reporting reduced customer demand linked to tariff effects.
- Risk-management priorities increasingly include supplier alternatives. 74% of executives identified maintaining alternative supply sources as their most effective risk-mitigation strategy.
- Companies also continue shifting their geographic footprints. 43% planned to move more supply chain activity into the United States over the next three years, 25 percentage points more than the previous year’s survey.
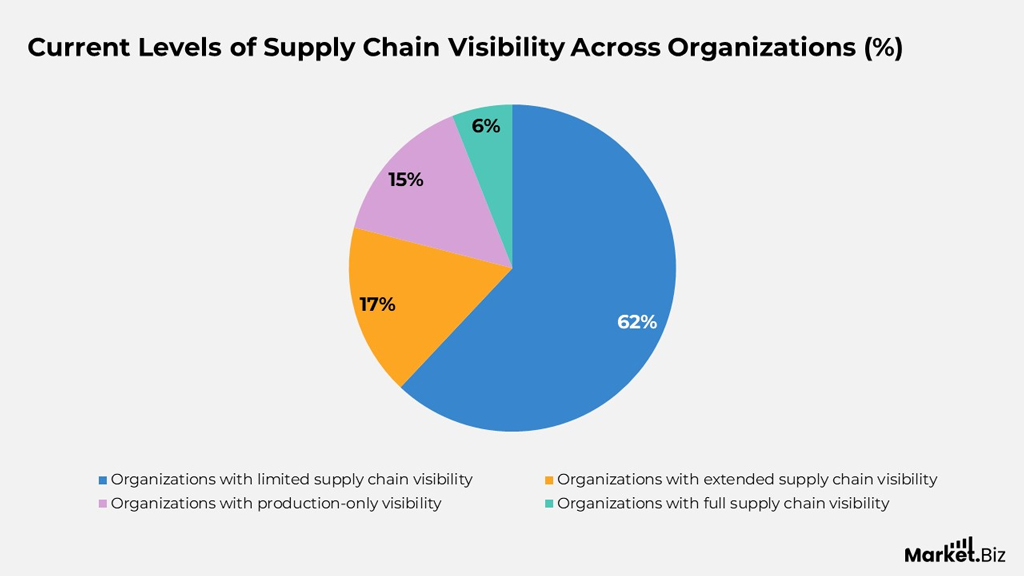
Current Levels of Supply Chain Visibility Across Organizations
- 62% of organizations report having limited supply chain visibility, making it the most common level of visibility across businesses.
- Only 17% of organizations have extended supply chain visibility, indicating that relatively few companies can monitor operations beyond their immediate suppliers.
- Around 15% of organizations maintain production-only visibility, meaning their monitoring capabilities are largely restricted to internal manufacturing processes.
- Just 6% of organizations have achieved full end-to-end supply chain visibility, highlighting how rare complete transparency remains.
- The data shows that nearly two-thirds (62%) of organizations still struggle with limited insight into their supply chain networks.
- Organizations with full supply chain visibility (6%) represent the smallest segment, emphasizing the complexity of achieving complete operational transparency.
- The combined 32% of organizations with extended, production-only, or full visibility suggests that less than one-third have moved beyond basic supply chain monitoring.
- The 11-percentage-point gap between limited visibility (62%) and all other visibility levels combined (38%) underscores the industry’s ongoing visibility challenges.
- Improving supply chain visibility remains a critical priority as 94% of organizations have not yet reached full end-to-end visibility.
- These findings demonstrate a significant opportunity for investments in digital supply chain technologies, real-time tracking, and data integration to improve operational transparency and resilience.
Supply Chain Visibility and Transparency
- In 2025, 95% of surveyed organizations had visibility into at least tier-one supplier risks, indicating that direct supplier monitoring has become standard practice for large supply chains.
- However, only 42% had risk visibility into tier-two suppliers or deeper, showing that transparency still drops sharply beyond direct suppliers.
- The share of companies with visibility into tier-two suppliers increased by 22 percentage points in 2025 compared with the previous year.
- About 58% of organizations had mapped their tier-two suppliers, although fewer than half of those organizations maintained regular direct communication with them.
- Procurement leaders also rank transparency highly; 64% identified greater supply chain visibility as one of their most effective methods for managing procurement risk.
- Another 61% prioritized supplier information sharing and collaboration, highlighting the importance of combining visibility platforms with direct supplier relationships.
- Despite stronger demand for visibility, the share of companies planning major digital supply chain investments dropped from 47% to 25% between the previous survey and 2025.
- Advanced planning deployments moved forward during 2025. The share of organizations with projects still in deployment fell from 40% to about 20%, while the proportion reporting completed implementations doubled.
- Only 2% of surveyed organizations reported that their advanced planning implementations had failed and required a restart, suggesting that most existing projects continued progressing despite tighter technology budgets.
Demand Forecasting and Planning
- By 2030, 70% of large organizations are projected to use AI-based supply chain forecasting to predict demand, signaling a major shift away from heavily manual forecasting processes.
- In 2025, 19% of surveyed supply chain organizations were already deploying AI tools at scale, while most others remained in planning, blueprinting, or pilot stages.
- Approximately 75% of organizations were planning, designing, or piloting AI supply chain use cases in 2025. Demand forecasting ranked among the leading applications.
- Demand forecasting, inventory optimization, and supply planning ranked as the top three generative AI supply chain applications identified by respondents in the 2025 survey.
- Spending on supply chain management software containing agentic AI capabilities stood at less than $2 billion in 2025 but is projected to reach $53 billion by 2030.
- That forecast represents an increase of more than 25 times from the 2025 spending base, reflecting expected demand for automated planning and decision workflows.
- Forecast-error measurement remains common in formal planning environments, but relatively few companies currently turn those measurements into systematic plans for correcting root causes.
- Supply chain planning teams increasingly use external customer and consumer information alongside internal sales history to improve demand plans, particularly in markets where demand changes quickly.
- Autonomous planning continued moving toward operational adoption in late 2025 as organizations increasingly automated routine planning decisions and reserved planners’ time for higher-impact exceptions.
Procurement and Supplier Management
- A 2025 global procurement study surveyed more than 250 chief procurement officers across 40 countries, providing a broad view of current sourcing and supplier-management priorities.
- 74% of procurement leaders said maintaining active alternative supply sources represented their most effective risk-reduction strategy.
- 64% prioritized greater supply chain visibility, while 61% focused on stronger information sharing and collaboration with suppliers.
- Cost reduction remains central to procurement strategy; 72% of surveyed CPOs listed improving margins through cost reduction among their leading enterprise priorities in 2025.
- At the same time, 68% identified operational efficiency as a leading priority, showing that procurement teams must manage both purchasing costs and process productivity.
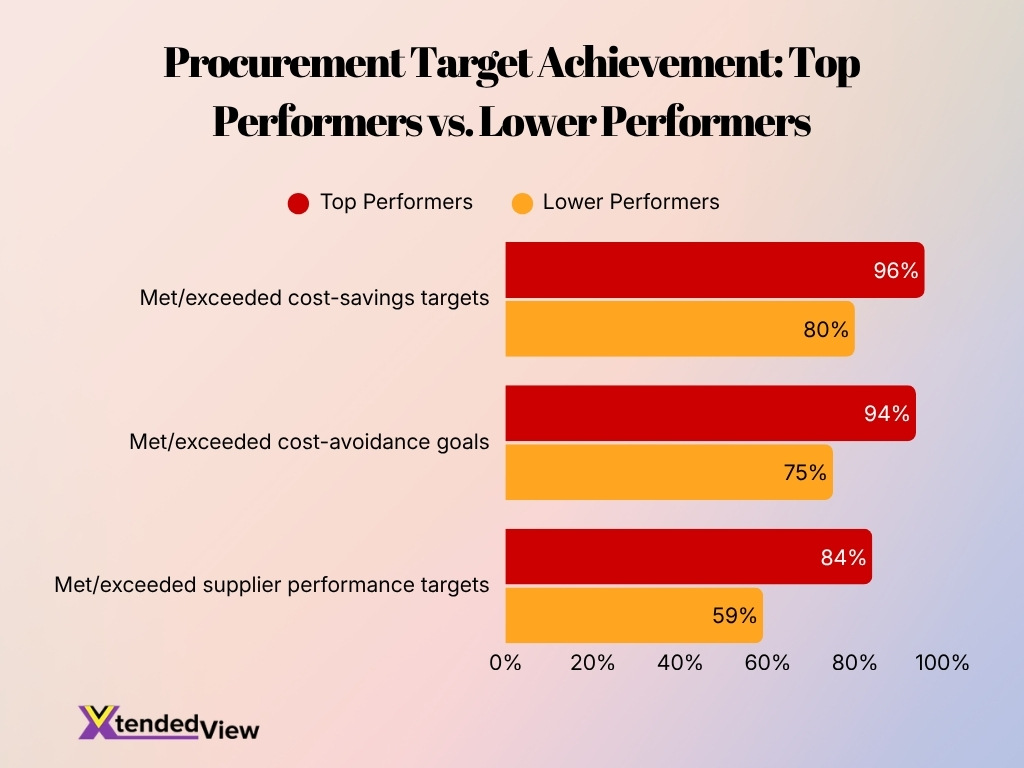
- Top-performing procurement teams met or exceeded planned cost-savings targets 96% of the time, compared with 80% among lower-performing organizations.
- Leading procurement functions met or exceeded their cost-avoidance goals 94% of the time, compared with 75% among their peers.
- Supplier performance targets were met or exceeded by 84% of leading organizations, compared with 59% of lower-performing procurement teams.
- Digital leaders allocated as much as 24% of procurement budgets to technology, while top organizations generated roughly three times the return from generative AI investments compared with peers.
- Organizational barriers remain significant: 57% cited siloed operations, 46% competing priorities, 40% inadequate organizational or technology capabilities, and 34% talent gaps as obstacles to delivering procurement value.
Inventory Management and Optimization
- U.S. manufacturers and trade businesses held $2.736 trillion in inventories in May 2026, up 0.3% from April and 3.1% from May 2025.
- The total U.S. business inventories-to-sales ratio dropped to 1.28 in May 2026, compared with 1.39 one year earlier, indicating that sales grew faster than inventories.
- Retail inventories reached approximately $832.2 billion in May 2026, increasing 0.6% from April.
- Wholesale inventories stood at about $941.8 billion in May 2026, edging up 0.1% from April.
- U.S. manufacturing inventories climbed to $962.0 billion in May 2026, marking the eighth consecutive monthly increase.
- Manufacturers’ inventory-to-shipments ratio declined to 1.47 in May 2026, from 1.49 in April, as shipments grew faster than inventory levels.
- Among supply chains affected by tariffs in 2025, 45% increased inventories as a short-term protection against potential cost or supply interruptions.
- However, surveyed supply chain leaders generally did not view permanently higher safety stocks as a sustainable strategy because additional inventory ties up working capital.
- Inventory optimization ranked among the three leading generative AI use cases for supply chain organizations in 2025, alongside demand forecasting and supply planning.
Manufacturing and Production Supply Chains
- U.S. manufacturers received $657.4 billion in new orders in May 2026, down 1.3% from April after four consecutive monthly increases.
- Manufacturing shipments rose 1.6% in May 2026 to $653.2 billion, marking an increase in seven of the previous eight months.
- Manufacturers’ unfilled orders reached approximately $1.580 trillion in May 2026, rising 0.6% during the month and increasing in 22 of the previous 23 months.
- U.S. manufactured durable goods orders reached $334.8 billion in June 2026, increasing 0.3% from May.
- Total industrial production in June 2026 stood at 102.6% of its index base, up 1.1% from June 2025.
- Manufacturing output increased 0.7% in April 2026 after March weakness, while output excluding motor vehicles and parts increased 0.3%.
- Total industrial production increased 1.6% during 2025 on a fourth-quarter-to-fourth-quarter basis, reflecting modest but positive production growth entering 2026.
- U.S. manufacturers ended December 2025 with $617.5 billion in monthly new orders, down 0.7% from November following a 2.7% November increase.
- Manufacturing inventories reached $962.0 billion in May 2026, while the accumulation of unfilled orders indicates that production networks still carried substantial order backlogs.
Transportation and Freight Management
- U.S. freight transportation activity reached an index level of 136.7 in May 2026, down 1.3% from April and 0.3% from May 2025.
- The freight transportation index reached 139.3 in March 2026, its highest level in the May 2023-May 2026 period, before easing during April and May.
- Freight transportation service prices increased 2.5% year over year in May 2026, adding cost pressure for manufacturers, wholesalers, and retailers purchasing transportation.
- Truck transportation service prices were 17.3% higher in May 2026 than a year earlier, while water transportation prices rose 11.0%.
- Air transportation service prices increased 5.7% year over year, while rail transportation prices increased a much smaller 0.3%.
- U.S.-Canada and U.S.-Mexico freight flows totaled approximately $1.6 trillion in 2025, down 1.0% from 2024 but still representing nearly one-third of total U.S. international trade.
- Trucks carried about $1.039 trillion in U.S. transborder freight during 2025, up 0.7% from 2024 and far ahead of every other transportation mode.
- Rail carried $184.5 billion in U.S.-Canada and U.S.-Mexico freight during 2025, down 9.2% year over year, while air freight increased 17.7% to $66.1 billion.
- Global air cargo demand increased 3.4% in 2025, reaching a record annual volume, while international cargo demand increased 4.2%.
- Air cargo routes shifted noticeably in 2025. Europe-Asia demand rose 10.3%, intra-Asia demand rose 10.0%, and Asia-North America demand declined 0.8%, reflecting changing trade patterns and tariff pressures.
Warehousing and Distribution Centers
- U.S. industrial leasing reached 175.7 million square feet in Q2 2026, rising 49.4% from a year earlier and 20.9% from the previous quarter. It marked the strongest quarterly leasing performance in more than three years.
- Net industrial absorption reached 99.1 million square feet in Q2 2026. That was almost twice the Q1 level and roughly seven times the volume recorded a year earlier.
- The national industrial vacancy rate fell 60 basis points to 6.8% in Q2 2026, recording its first meaningful contraction since mid-2023.
- Vacancy among Class A warehouses larger than 1 million square feet tightened further to 5.8%, showing stronger demand for large, modern distribution facilities.
- Leasing of warehouses measuring at least 500,000 square feet increased 58.3% year over year in Q2 2026 as occupiers returned to larger, longer-term commitments.
- Developers had approximately 276 million square feet of U.S. industrial property under construction in Q2 2026, up 9.2% from a year earlier. Average asking rents increased to $10.45 per square foot.
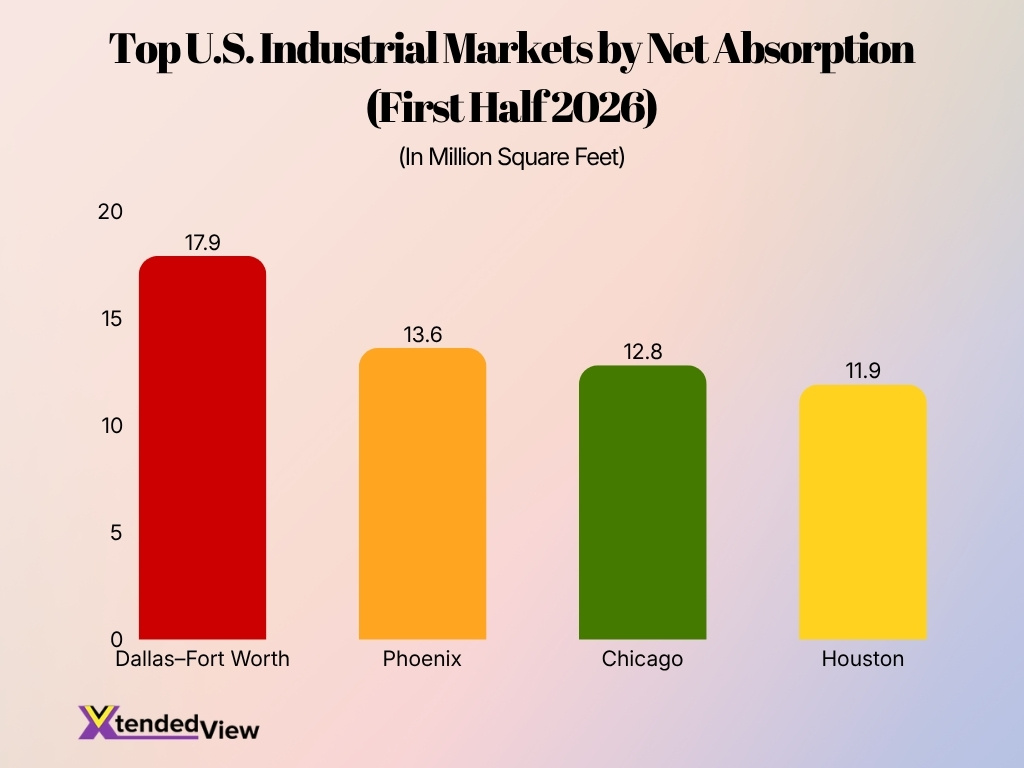
- Dallas-Fort Worth recorded 17.9 million square feet of net absorption during the first half of 2026, the highest among U.S. industrial markets. Phoenix followed at 13.6 million square feet, Chicago at 12.8 million and Houston at 11.9 million.
- Dallas-Fort Worth had 31.2 million square feet under construction at the end of Q2 2026, with 37.7% already preleased. Its industrial vacancy rate had fallen to 9.3% from an 11.1% peak in Q3 2024.
- Atlanta recorded 12.1 million square feet of industrial leasing in Q2 2026, 19% more than a year earlier. Year-to-date net absorption reached 9.17 million square feet.
E-commerce Supply Chain Statistics
- U.S. retail e-commerce sales totaled $1.234 trillion in 2025, increasing 5.4% from 2024. By comparison, total U.S. retail sales grew 3.5%.
- E-commerce accounted for 16.4% of U.S. retail sales in 2025, up from 16.1% in 2024. That shift continued to increase the volume of goods moving through fulfillment centers, parcel networks and last-mile operations.
- Adjusted U.S. e-commerce sales reached $316.1 billion in Q4 2025, increasing 1.7% from Q3 and 5.3% from Q4 2024.
- Seasonal holiday demand pushed unadjusted Q4 2025 e-commerce sales to $365.2 billion, 21.8% higher than Q3. Online transactions represented 18.3% of unadjusted retail sales during the quarter.
- E-commerce sales increased to $326.7 billion in Q1 2026 on a seasonally adjusted basis, up 2.7% from Q4 2025.
- Q1 2026 online sales grew 9.8% year over year, while total retail sales increased 3.9%. As a result, e-commerce continued to expand faster than the overall retail market.
- Online transactions represented 16.9% of adjusted U.S. retail sales during Q1 2026, compared with 16.3% in Q2 2025 and 16.2% in Q1 2025.
- Q3 2025 adjusted e-commerce sales reached approximately $310.3 billion, rising 1.9% quarter over quarter and 5.1% year over year.
- Moreover, U.S. nonstore retailer sales increased 12.2% year over year in May 2026, substantially faster than overall retail trade growth and adding further demand for parcel, fulfillment, and delivery capacity.
Sustainable Supply Chains and ESG
- By the end of 2025, 9,764 companies worldwide had validated science-based emissions targets, compared with 6,954 at the end of the prior year.
- The number of companies with validated targets therefore increased 40% during 2025, showing that measurable corporate climate commitments continued to expand despite economic and regulatory uncertainty.
- Companies with validated net-zero targets increased 61% in 2025, from 1,441 to 2,325 organizations.
- By January 2026, the number of businesses with validated science-based targets had crossed 10,000, representing more than 40% of global market capitalization and companies headquartered in more than 90 countries.
- The latest target database lists more than 11,500 companies with validated targets and more than 2,600 with net-zero targets, showing continued expansion during 2026.
- Globally, listed companies representing 76% of market capitalization disclosed at least one category of Scope 3 greenhouse gas emissions in 2024. Across most European industries, disclosure exceeded 95% by market capitalization.
- Supply chain emissions remain substantially larger than companies’ direct operational footprints. Upstream Scope 3 emissions average about 26 times Scope 1 and Scope 2 emissions.
- Yet only 15% of companies in a major disclosure dataset had established supply chain emissions targets, illustrating the gap between measuring emissions and actively managing suppliers against targets.
- Companies identified approximately $165 billion in potential financial gains from addressing upstream climate risks, compared with an estimated $94 billion required to capture those opportunities. Supplier programs had already produced $13.6 billion in reported cost savings.
Top Supply Chain Challenges
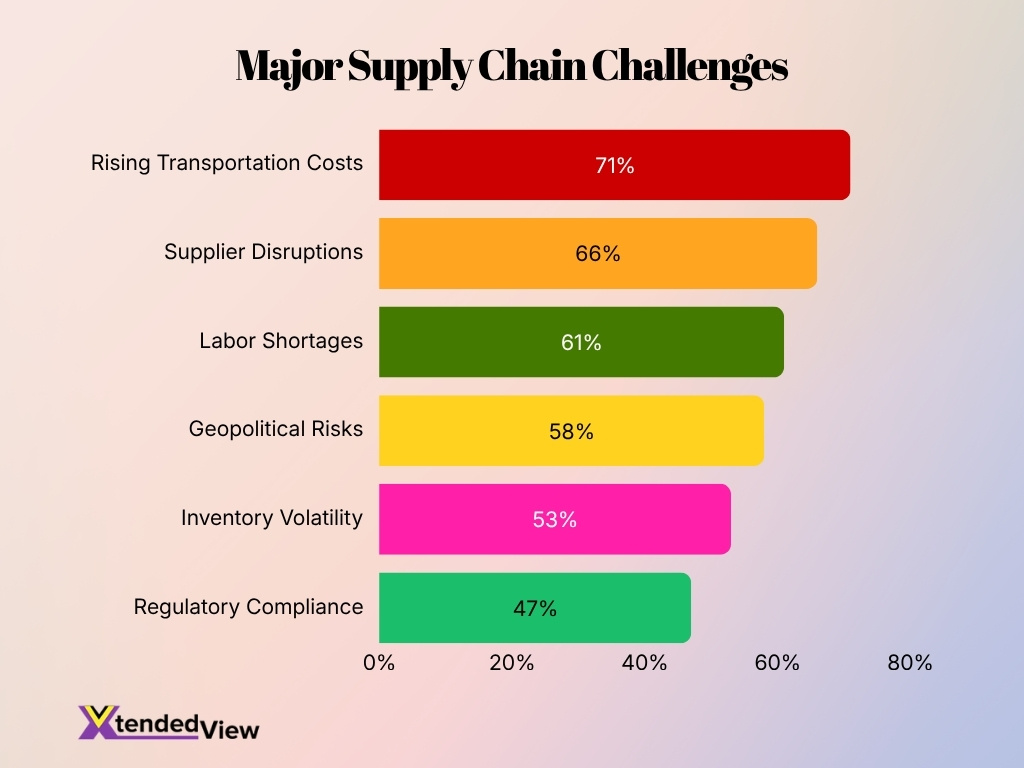
- 71% of organizations identify rising transportation costs as their biggest supply chain challenge.
- 66% of businesses report supplier disruptions as a major operational concern.
- 61% of organizations continue to struggle with labor shortages across supply chain operations.
- 58% of companies cite geopolitical risks as a key source of supply chain uncertainty.
- 53% of businesses experience challenges due to inventory volatility.
- 47% of organizations report regulatory compliance as a significant supply chain challenge.
Regionalization, Reshoring, and Nearshoring
- U.S. manufacturing reshoring and foreign direct investment announcements represented 244,000 jobs in 2024, bringing cumulative announced manufacturing jobs since 2010 to more than 2 million.
- New foreign direct investment expenditures to acquire, establish or expand U.S. businesses reached $232.2 billion in 2025, increasing 49.5% from $155.3 billion in 2024.
- Planned total spending associated with new 2025 foreign investment projects reached $284.5 billion, while newly acquired, established or expanded foreign-owned U.S. businesses employed 213,100 people.
- Foreign direct investment already positioned in the United States increased by $266 billion during 2025, reaching $5.86 trillion at year-end.
- Manufacturing accounted for 42.8% of the total foreign investment position in the United States in 2025, equal to approximately $2.51 trillion. Electrical equipment and components helped lead the annual increase.
- Mexico ranked as the United States’ largest goods trading partner through April 2026, accounting for 16.4% of U.S. goods trade. Year-to-date bilateral trade totaled $317.3 billion, compared with $240.9 billion with Canada and $117.4 billion with China.
- In April 2026 alone, U.S.-Mexico goods trade reached $86 billion, including $35.3 billion in U.S. exports and $50.7 billion in imports. Mexico represented 16.6% of U.S. goods trade that month.
- The changing geographic mix extends beyond North America. Through April 2026, U.S. goods trade with Vietnam reached $82.5 billion, while trade with Taiwan reached $111.5 billion, reflecting the growing role of alternative Asian manufacturing hubs.
- Regionalization does not always mean complete domestic production. Research published in 2025 found that U.S. imports increasingly shifted toward China+1 economies in Southeast Asia, while many of those supply chains remained connected to Chinese intermediate inputs.
- Foreign-owned U.S. investment created particularly large employment footprints in manufacturing-related sectors during 2025. Plastics and rubber products accounted for 21,800 workers, transportation equipment for 17,300, and primary and fabricated metals for 16,400.
Frequently Asked Questions (FAQs)
Global goods trade reached approximately $13.7 trillion in the first half of 2026, up 12.5% year over year, while services trade increased 10.5%.
U.S. retail e-commerce sales reached $326.7 billion in Q1 2026, increasing 9.8% year over year and accounting for 16.9% of total retail sales.
U.S. freight trade with Canada and Mexico totaled $153.4 billion in May 2026, an increase of 16.1% from May 2025.
Only 17% of supply chain organizations were pursuing immediate AI-driven transformation, while 83% were adopting AI incrementally or gradually scaling it across processes.
Trucks transported approximately $1.04 trillion in freight between the U.S., Canada, and Mexico during 2025, up 0.7% from 2024.
Conclusion
The latest supply chain statistics show that global supply networks continue to evolve rather than retreat. While businesses still face challenges such as geopolitical uncertainty, trade policy changes, rising logistics costs, and supplier disruptions, they are responding with stronger resilience strategies, increased digitalization, and broader supplier diversification. Investments in artificial intelligence, warehouse automation, real-time visibility, sustainable operations, and regional manufacturing are reshaping how organizations manage sourcing, production, transportation, and fulfillment.
At the same time, e-commerce growth, expanding warehouse capacity, nearshoring initiatives, and greater supply chain transparency continue to influence strategic business decisions across industries. Companies are increasingly balancing efficiency with flexibility, recognizing that resilience and adaptability are just as important as cost optimization. As technology adoption accelerates and global trade patterns continue to shift, organizations that leverage data-driven planning, diversified supplier networks, and intelligent supply chain solutions will be better positioned to improve operational performance, reduce risk, and support sustainable growth in the years ahead.
