
Smart TVs have evolved from simple display devices into powerful digital hubs that shape how people consume content. Today, they enable seamless access to streaming platforms like Netflix, YouTube, and ad-supported services, while also integrating with gaming systems and smart home ecosystems. For instance, advertisers now rely heavily on connected TV (CTV) environments to reach targeted audiences, and manufacturers compete aggressively on features such as display quality, operating systems, and app ecosystems.
As viewing habits continue to shift away from traditional cable toward on-demand and personalized content, smart TVs play a central role in both entertainment and digital advertising strategies. This article breaks down the latest statistics, trends, and market dynamics to help you understand where the smart TV industry stands and where it is heading next.
Editor’s Choice
- The global smart TV market is expected to reach $284.19 billion in 2026, up from $258.08 billion in 2025.
- Market size estimates show a range of $244 to $271 billion in 2026, depending on methodology.
- The industry is forecast to grow at a CAGR between 11% and 13.9% through 2033.
- Smart TV demand could push market value beyond $673 billion by 2033.
- Asia-Pacific held the largest share at 35.51% in 2025.
- The U.S. accounted for $63.63 billion in 2025 market value, representing nearly a quarter of global sales.
- Market projections suggest the sector could exceed $825 billion by 2036, driven by streaming and smart home adoption.
Recent Developments
- Smart TV adoption continues to rise due to OTT platform expansion and high-speed internet penetration.
- Manufacturers are investing heavily in OLED, QLED, and mini-LED display technologies.
- Integration with AI and IoT ecosystems is accelerating product innovation in 2026.
- Video-on-demand usage continues to grow, supporting smart TV demand globally.
- The rise of cloud-based streaming services is shaping next-gen TV capabilities.
- Smart TVs now serve as hubs for connected home ecosystems, integrating voice assistants and apps.
- Price competition has intensified due to declining hardware costs and global manufacturing scale.
- Growth in ad-supported streaming (FAST channels) is expanding smart TV usage scenarios.
Smart TV Market Growth Trends
- The global Smart TV market is projected to grow from $229.62 billion in 2025 to $322.18 billion by 2030, reflecting strong industry expansion.
- In 2026, the market reaches $244.41 billion, indicating steady year-over-year growth.
- The industry is expected to grow at a CAGR of 7.2% (2026–2030), highlighting consistent long-term momentum.
- Market size is estimated to surpass $260 billion in 2027, showing accelerating adoption of Smart TVs globally.
- By 2028, the market is projected to reach approximately $280 billion, driven by increased demand for streaming and connected devices.
- In 2029, the market is expected to exceed $300 billion, marking a significant milestone for the industry.
- The overall increase of nearly $92.5 billion between 2025 and 2030 underscores rising consumer demand and technological advancements.
- Growth is primarily fueled by factors such as OTT platform expansion, internet penetration, and advancements in display technologies like 4K and OLED.

Market Growth Rate (CAGR)
- The smart TV market is projected to grow at a 13.9% CAGR from 2026 to 2033.
- Another estimate places CAGR at 11.5% between 2026 and 2034.
- Future projections forecast a 11.8% CAGR through 2036.
- Conservative projections suggest 7.2% CAGR from 2026 to 2030.
- Historical growth from 2025 to 2026 stood at 6.4% CAGR, indicating acceleration ahead.
- Some industry reports cite 11.4% CAGR between 2026 and 2033.
- Certain segments show a higher growth of 16.8% CAGR in recent years.
- Growth is fueled by OTT consumption, smart home integration, and display innovation.
Market Value Projections
- The market could reach $673.47 billion by 2033.
- Projections indicate $678.86 billion by 2034.
- Long-term estimates suggest $825 billion by 2036, indicating expansion.
- Some forecasts predict $1.11 trillion by 2033, reflecting aggressive growth scenarios.
- Mid-range projections estimate $322.18 billion by 2030.
- Other estimates suggest $652.38 billion by 2033.
- Growth reflects rising demand for 4K, 8K, and OLED displays globally.
- Expansion also tied to CTV advertising and subscription-based streaming ecosystems.
Regional Market Shares
- Asia-Pacific accounted for 35.5% of the global smart TV market in 2025, making it the largest regional segment.
- North America held roughly 25% market share in 2025, driven by high household penetration.
- Europe contributed close to 22% of global smart TV revenues in 2025.
- Latin America represented approximately 8 to 10% of global shipments, with growth tied to affordability.
- The Middle East and Africa region held about a 5 to 7% share, but shows strong growth potential.
- China alone contributes over 20% of global smart TV demand, leading Asia-Pacific dominance.
- India’s market is expanding rapidly with double-digit annual growth rates, boosting regional share.
- The U.S. remains the largest single-country market within North America.
- Emerging markets are expected to account for over 60% of new smart TV shipments by 2030.

Household Penetration Rates
- North America achieves 85% smart TV penetration, the highest globally.
- 82% of U.S. households own at least one smart TV in 2025.
- Global broadband penetration reaches 68% of households, fueling smart TV adoption.
- Average TV replacement cycle stands at 6.6–7 years, spurring larger screen upgrades.
- Asia-Pacific urban households see 75% smart TV penetration amid rapid urbanization.
- 51% of global households (1.1 billion) are projected to own smart TVs by 2026.
- Competitive smart TVs under $500 from brands like TCL and Hisense boost developing markets.
- U.S. households average 2.3–2.6 TVs, with rising multi-TV connected setups.
- 90% of streaming households subscribe to at least one service, averaging 3.9 apps.
- 81% of viewers stream via smart TVs, now the primary device over cable.
Country-Specific Adoption
- The United States had smart TV penetration exceeding 80% of households in 2025.
- China leads globally with hundreds of millions of active smart TV users, driven by local brands.
- India recorded over 30% household penetration in 2025, with strong growth in urban areas.
- The UK reported smart TV adoption at around 75% of households.
- Germany showed penetration levels near 70%, reflecting steady replacement cycles.
- Brazil’s smart TV adoption crossed 50% of households in 2025.
- South Korea maintains one of the highest adoption rates globally at over 85%.
- Japan’s adoption reached approximately 65 to 70%, with growth in premium segments.
- Southeast Asian markets such as Indonesia and Thailand are growing at 15%+ annual rates.
TV Viewing Trends: Streaming Dominates in January 2026
- Streaming leads TV consumption with a massive 47.0% share, making it the largest viewing category by a wide margin.
- Traditional TV is nearly tied, with Broadcast at 21.5% and Cable at 21.2%, showing that linear TV still holds over 40% combined share.
- The “Other” category accounts for 10.3%, indicating a significant portion of viewing comes from alternative sources beyond mainstream platforms.
- Within streaming, YouTube dominates with 12.5%, making it the top individual platform by a substantial margin.
- Netflix holds 8.8%, reinforcing its position as a major player but trailing YouTube significantly.
- Disney platforms (Disney+, Hulu, ESPN+) contribute 4.9%, highlighting their strong bundled ecosystem impact.
- Prime Video captures 4.1%, showing steady competition among major subscription services.
- Mid-tier platforms like Roku Channel (3.0%), Paramount (2.3%), and Tubi (2.1%) demonstrate growing fragmentation in the streaming landscape.
- Smaller platforms such as Peacock (1.8%) and Warner Bros. Discovery (1.4%) still contribute but lag behind leading services.
- “Other Streaming” at 6.3% signals a long tail of niche and emerging platforms, emphasizing increasing diversification in viewer preferences.
- Overall, the data clearly shows a structural shift toward streaming, while traditional TV maintains a resilient but declining share.

Leading Brands by Shipments
- Samsung led global shipments with around 19 to 20% market share in 2025.
- LG Electronics followed with approximately 12 to 13% share globally.
- TCL ranked among the top three with about 11 to 12% shipment share.
- Hisense captured nearly 10% of global shipments, strengthening its global presence.
- Chinese brands collectively accounted for over 35% of global shipments.
- Sony maintained a smaller but premium-focused share of around 5 to 6%.
- Vizio dominated the U.S. budget segment with strong domestic shipments.
- Amazon-branded TVs and Fire TV integrations are gaining share in North America.
- The top five brands together control over 60% of global shipments, indicating moderate market consolidation.
Top Vendors Market Share
- Samsung captured 29.1% of the global TV market in 2025.
- The top three vendors, Samsung, TCL, and LG, held approximately 56% of global TV sales volume in 2024-2025.
- LG dominated the OLED TV segment with 45.4% market share in Q3 2025.
- Hisense achieved 15.4% global market share in Q3 2025, reclaiming the No.2 position.
- TCL reached 16% market share in global TV shipments during December 2025.
- Chinese manufacturers controlled 42% of the worldwide TV market as of Q3 2025.
- Samsung led premium TV ($2,500+) with 54.3% market share in 2025.
- LG held 47.2% revenue share in the OLED TV market in Q1 2025.
- Hisense grew its premium TV unit share to 20% in Q1 2025.
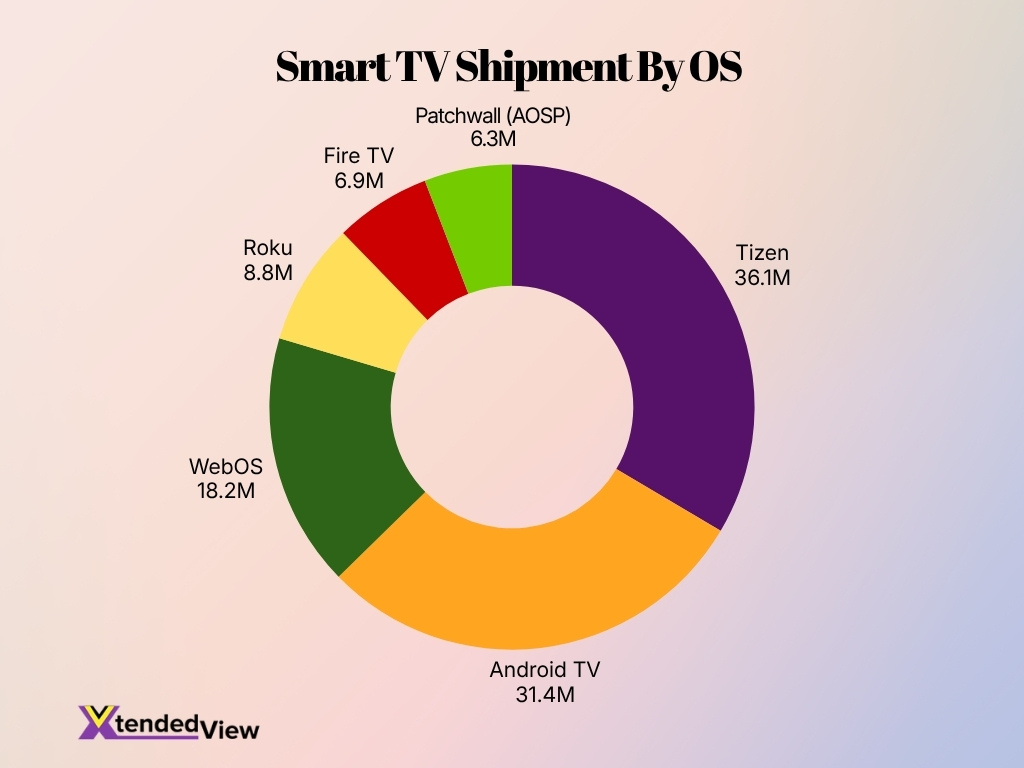
Smart TV OS Market Share Insights
- Tizen leads the market with 36.1 million shipments, making it the most widely used Smart TV operating system globally.
- Android TV ranks second with 31.4 million units, showing strong adoption across multiple TV brands.
- WebOS secures third place at 18.2 million shipments, highlighting its solid presence in premium TV segments.
- Roku accounts for 8.8 million units, indicating a significant foothold in the North American market.
- Fire TV reaches 6.9 million shipments, reflecting steady growth driven by Amazon’s ecosystem integration.
- Patchwall (AOSP) records 6.3 million units, showcasing emerging traction, especially in price-sensitive markets.
Screen Size Preferences
- TVs sized 55 inches and above captured approximately 34–37% of the global market share in 2025.
- The 65-inch segment grew at a 9.56% CAGR, reaching $13.05 billion in market value.
- Global average TV screen size reached around 50–55 inches in 2025, driven by premium demand.
- Large-screen TVs over 55 inches achieved a 5.5% CAGR in North America and Europe shipments.
- In emerging markets, 32–55-inch models dominated with over 52% share due to space constraints.
- 75-inch and 85-inch premium displays saw ultra-large shipments surge to 9 million units globally.
- Large-panel prices declined, boosting 55+ inch adoption with 7.29% market CAGR across segments.
- Over 70-inch TVs grew 57.4% in 2025 amid rising replacement cycles for bigger screens.
Display Technology Shares
- LED-backlit LCD TVs still dominate, accounting for over 70% of global smart TV shipments in 2025.
- OLED TVs represent around 8 to 10% of total shipments, but generate a higher share of revenue.
- QLED technology holds approximately 15% market share, led by premium brands.
- Mini-LED adoption is rising quickly, with double-digit growth rates from 2025 to 2026.
- OLED TVs account for nearly 40% of premium segment sales, despite lower unit volume.
- Entry-level markets continue to rely heavily on standard LED panels under $500.
- Display innovation is focused on brightness, contrast, and energy efficiency improvements.
- Hybrid technologies like QD-OLED are gaining traction among high-end buyers.
- Manufacturers are investing in microLED prototypes, though commercial adoption remains limited.
Resolution Type Breakdown
- 4K Ultra HD TVs accounted for over 70% of global shipments in 2025.
- Full HD TVs still represent around 15 to 20% of shipments, mainly in budget markets.
- 8K TV adoption remains below 2% of global shipments, due to high pricing.
- 4K adoption is driven by streaming platforms offering native UHD content.
- HDR-enabled TVs now make up over 60% of premium segment sales.
- Budget 4K TVs are increasingly available below $500 price points.
- Resolution upgrades are tied closely to gaming and streaming demand.
- Full HD demand persists in regions with lower broadband speeds.
- 8K growth is expected to accelerate as content availability improves.

Annual Sales Volumes
- Global smart TV shipments reached approximately 220 to 230 million units in 2025.
- Shipment volume is expected to grow to over 240 million units in 2026.
- China accounted for the largest share of shipments, with over 50 million units annually.
- North America shipped around 45 to 50 million units in 2025.
- India saw shipments exceed 15 million units annually, reflecting strong growth.
- Replacement demand drives nearly 60% of annual TV purchases globally.
- Seasonal sales events contribute significantly, with spikes during Q4 holiday periods.
- Larger screen categories represent over half of total shipments by volume.
- Emerging markets contribute most of the incremental shipment growth year over year.
Advertising Revenue Trends
- Connected TV advertising revenue exceeded $30 billion globally in 2025.
- U.S. CTV ad spend alone crossed $25 billion in 2025, reflecting rapid growth.
- Global CTV ad revenue is projected to surpass $40 billion by 2026.
- Ad-supported streaming channels are growing at 20%+ annually.
- Over 50% of smart TV users engage with ad-supported content regularly.
- Programmatic advertising accounts for a growing share of CTV ad placements.
- Smart TV manufacturers are generating revenue through home screen ads and content partnerships.
- Average revenue per user from CTV ads is increasing steadily year over year.
- Brands are shifting budgets from traditional TV to CTV due to better targeting and measurable ROI.
US Connected TV Ad Spending Trends
- The US CTV ad spending shows a strong upward trajectory, growing from $20.49 billion in 2022 to a projected $44.32 billion by 2028.
- Spending is expected to more than double (+116%) over the six-year period, highlighting rapid expansion in the connected TV ecosystem.
- The market demonstrates consistent year-over-year growth, with increases of approximately $3–$4 billion annually.
- A notable jump occurs between 2023 ($24.19B) and 2024 ($28.75B), indicating accelerated adoption of CTV advertising platforms.
- By 2025, ad spending will surpass the $30 billion mark ($32.57B), signaling mainstream dominance of streaming-based advertising.
- Continued growth pushes the market to $36.53 billion in 2026 and $40.51 billion in 2027, reflecting sustained double-digit growth rates.
- By 2028, spending will reach $44.32 billion, reinforcing CTV as a critical channel in digital advertising budgets.
- The steady rise suggests an increasing shift from traditional TV to streaming, driven by changing consumer viewing behavior and advertiser demand.

Competitive Landscape Overview
- The top five brands, like Samsung, TCL, LG, Hisense, and Xiaomi, control over 60% of the global smart TV market share.
- Roku OS leads US smart TV platforms with 25% market share, followed by Amazon Fire TV at 17%.
- Chinese brands TCL and Hisense achieved 87% and 74% YoY shipment surges in Q1 2025, fueling global gains.
- Samsung holds 29.1% of the premium TV market, down 12 points YoY as Chinese rivals advance.
- Android TV commands 40% of the global smart TV platform share, enabling rapid regional expansion.
- Smart TV ad revenue reached $1.93 billion in 2025, growing at 13.5% CAGR through data monetization.
- China’s smart TV market grows at 14.3% CAGR to $128 billion by 2035, driven by scale advantages.
- Emerging markets like APAC see smart TV penetration rise with 3.12% CAGR, attracting new regional entrants.
Frequently Asked Questions (FAQs)
Over 90% of U.S. households have at least one connected TV device as of 2025.
Smart TVs accounted for 78.12% of the connected TV market share in 2025.
U.S. connected TV advertising spend is expected to reach $38 billion in 2026.
Around 1.2 billion households worldwide own at least one smart TV.
Connected TV advertising is growing at about a 12% CAGR, outpacing many other digital channels.
Conclusion
Smart TVs have firmly established themselves as the centerpiece of modern home entertainment, combining advanced hardware with software-driven experiences. The data highlights steady growth in market size, increasing household penetration, and rising demand for larger screens and higher-resolution displays. At the same time, the expansion of connected TV advertising and streaming ecosystems has transformed smart TVs into key revenue-generating platforms, not just for manufacturers but also for media companies and advertisers.
As competition intensifies, brands are shifting focus from pure hardware innovation to ecosystem development, user experience, and content partnerships. Looking ahead, continued advancements in display technology, operating systems, and monetization models will further reshape the industry. For businesses and consumers alike, smart TVs will remain a critical touchpoint in the evolving digital landscape.