


Mobile banking has become the primary way millions of people manage money, pay bills, transfer funds, and monitor their finances. Banks, fintech companies, retailers, and government agencies now rely on mobile banking to deliver faster, more accessible financial services while reducing branch dependence. As AI-powered banking, digital wallets, and instant payment systems continue to expand, mobile banking is reshaping how consumers interact with financial institutions worldwide. Explore the latest data below to understand where the industry stands and where it is headed next.
Editor’s Choice
- Nearly 80% of adults worldwide owned a financial account in 2024, up from 50% in 2011, creating a larger addressable market for mobile banking.
- Around 1.3 billion adults still remain outside the formal financial system, leaving significant room for future mobile banking growth.
- More than 86% of adults globally owned a mobile phone in 2024, while 68% owned a smartphone capable of supporting mobile banking apps.
- Digital financial transactions across emerging markets increased more than fourfold between 2017 and 2024, according to international financial access data.
- Mobile money services processed over $2 trillion in transaction value during 2025, highlighting the accelerating shift toward mobile financial services.
- There were 2.3 billion registered mobile money accounts worldwide in 2025, while active 30-day accounts reached 593 million.
- Merchant payments through mobile money increased by nearly 50% year over year in 2025, making them the fastest-growing mobile financial use case globally.
- Around 42% of adults in low- and middle-income economies made an in-store or online digital merchant payment in 2024, up from 35% in 2021.
Recent Developments
- During 2025, annual mobile money transaction values surpassed $2 trillion for the first time, doubling from the $1 trillion milestone achieved just four years earlier.
- Registered mobile money accounts expanded by approximately 268 million during 2025 to reach 2.3 billion globally.
- Active 30-day mobile money accounts climbed 15% year over year, reaching 593 million in 2025.
- Global monthly activity rates for mobile money increased to 25.7%, the highest level recorded since 2021.
- The number of providers offering mobile money-linked insurance products increased by about one-third during 2025.
- More than 60% of mobile money providers reported that interoperability, KYC modernization, and consumer protection regulations supported industry growth.
- International financial datasets released in 2025 expanded coverage beyond traditional banking to include digital wallets, neobanks, e-money, and fintech services, reflecting rapid changes across financial ecosystems.
- The latest findings show 900 million unbanked adults already own a mobile phone, including 530 million smartphone users, presenting a major opportunity for mobile banking providers.
Global Overview of Mobile Banking Adoption
- Nearly 80% of adults worldwide now have access to a formal financial account, creating a strong foundation for mobile banking adoption.
- Global smartphone ownership reached 68% of adults in 2024, enabling continued growth in banking app usage.
- Mobile phone ownership expanded to 86% of adults worldwide, supporting broader access to digital financial services.
- In developing economies, 10% of adults used a mobile money account for savings in 2024, doubling from 2021 levels.
- Around 73% of women in low- and middle-income economies owned financial accounts in 2024, compared with just 37% in 2011, helping accelerate mobile banking adoption.
- Digital transactions per adult across emerging markets increased from 55 to 251 between 2017 and 2024, reflecting rapid mobile financial adoption.
- Sub-Saharan Africa added 100 mobile money accounts for every 50 traditional deposit accounts between 2018 and 2024, making mobile finance the dominant access channel across much of the region.
- Financial literacy continues to correlate positively with higher adoption of mobile and digital banking services across both developed and emerging economies.
Global Mobile Banking User Growth
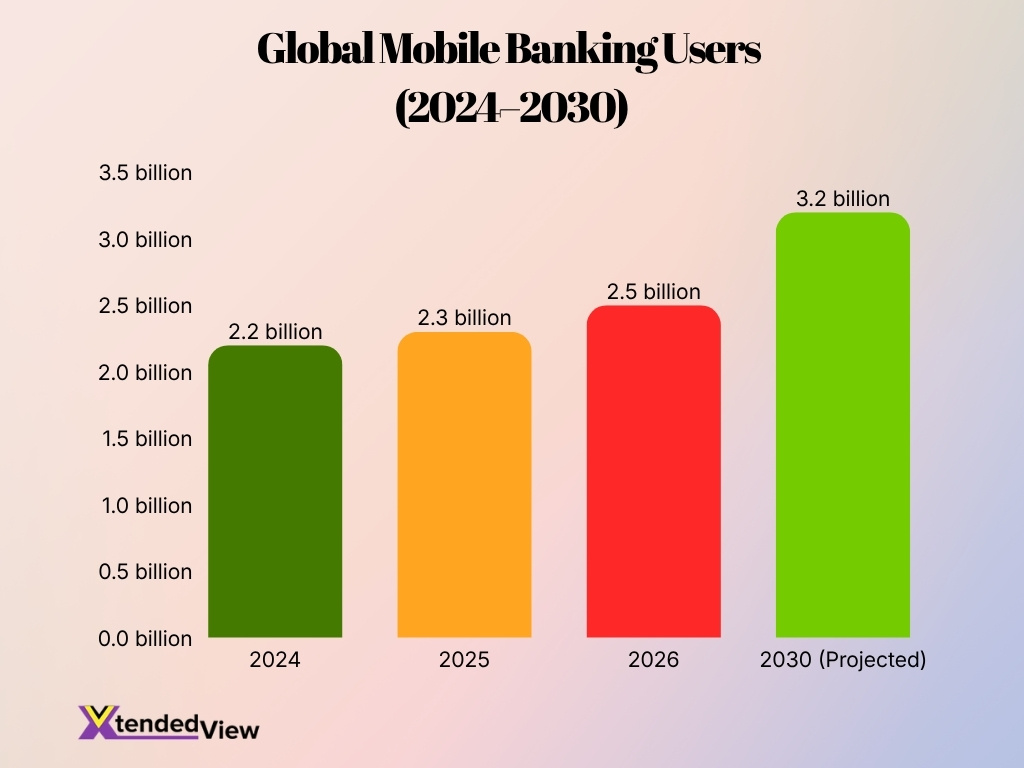
- The number of global mobile banking users increased from 2.2 billion in 2024 to 2.3 billion in 2025, reflecting steady growth in digital banking adoption worldwide.
- Mobile banking users are expected to reach 2.5 billion in 2026, representing an increase of approximately 200 million users compared with the previous year.
- Between 2024 and 2026, the global mobile banking user base is projected to grow by 300 million users, marking an overall increase of nearly 13.6%.
- By 2030, the number of people using mobile banking services worldwide is forecast to reach approximately 3.2 billion users.
- The industry is expected to add around 1 billion new mobile banking users between 2024 and 2030, highlighting strong long-term adoption.
- Overall, global mobile banking usage is projected to rise by about 45.5% over the six-year period, driven by expanding smartphone access and digital financial services.
- The continued increase in users shows that mobile banking is becoming a primary channel for account management, payments, transfers, and other financial activities.
Mobile Banking Market Size and Growth Statistics
- Mobile banking continues to expand alongside broader digital financial services, supported by increasing smartphone ownership and internet connectivity worldwide.
- Mobile money transaction values exceeded $2 trillion during 2025, demonstrating continued double-digit ecosystem growth.
- Industry revenues increased during 2025 as higher transaction values and greater service adoption drove stronger provider performance.
- Merchant payment volumes through mobile financial platforms rose by almost 50% in 2025, outpacing other transaction categories.
- Countries classified with medium-to-very-high mobile money prevalence increased from 52 to 60 between 2024 and 2025.
- The number of countries with low mobile money prevalence declined from 50 to 42 during the same period, indicating broader global adoption.
- Regulatory modernization, including interoperability and consumer protection measures, remains one of the strongest growth drivers for digital banking ecosystems.
- Investments in instant payment infrastructure, including systems similar to UPI and PIX, continue to accelerate mobile banking usage across emerging markets.
Mobile Banking App Login Frequency Insights
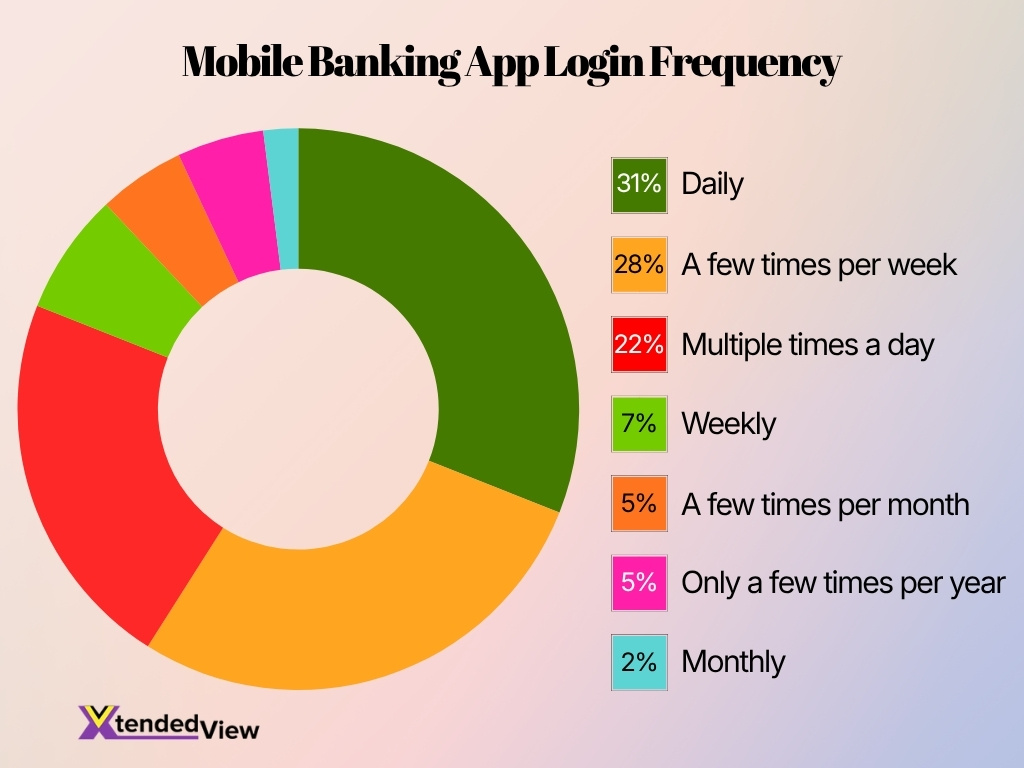
- 53% of users access their mobile banking app at least once a day, including 31% who log in daily and 22% who log in multiple times per day.
- Logging in a few times per week is also common, accounting for 28% of respondents, making it the second-largest usage group.
- Nearly four in five users, 81%, open their mobile banking app either daily, multiple times a day, or several times per week.
- Only 7% of users access mobile banking on a strictly weekly basis, indicating that most customers engage more frequently.
- Infrequent usage remains limited, with 5% logging in a few times per month and another 5% using the app only a few times per year.
- Just 2% of respondents report logging in monthly, making it the smallest user segment in the survey.
- The figures show that mobile banking apps have become a high-frequency financial tool, rather than an occasional channel for checking accounts or completing transactions.
Regional Breakdown of Mobile Banking Usage
- East Asia and the Pacific reached 83% account ownership among adults in 2024, providing a large foundation for mobile banking and digital payment services.
- Sub-Saharan Africa recorded 58% adult account ownership in 2024, with mobile money playing a larger role than conventional bank accounts in several markets.
- Between 2018 and 2024, Sub-Saharan Africa added roughly 100 mobile money accounts for every 50 traditional deposit accounts, showing how mobile-first finance can bypass limited branch networks.
- Asia-Pacific mobile apps generated an estimated 76.6% of the region’s fintech activity in 2025, reflecting the central role of smartphones in financial services.
- China and India represented about 70% of Asia-Pacific neobanking activity in 2025, supported by large populations and high mobile payment volumes.
- Digital payment adoption reached 92% in Singapore in 2025 as consumers increased their use of tokenized mobile wallets and real-time bank transfers.
- More than 80% of consumers in Belgium accessed banking services through an app at least monthly in 2025.
- Germany’s online banking penetration reached 67% of people ages 16 to 74 in 2024, matching the European Union average and supporting continued mobile app growth.
- Northern European countries remained regional leaders in 2024, with digital banking usage reaching 98% in Denmark, 96% in the Netherlands, and 95% in Finland.
Countries Leading in Mobile Banking Participation
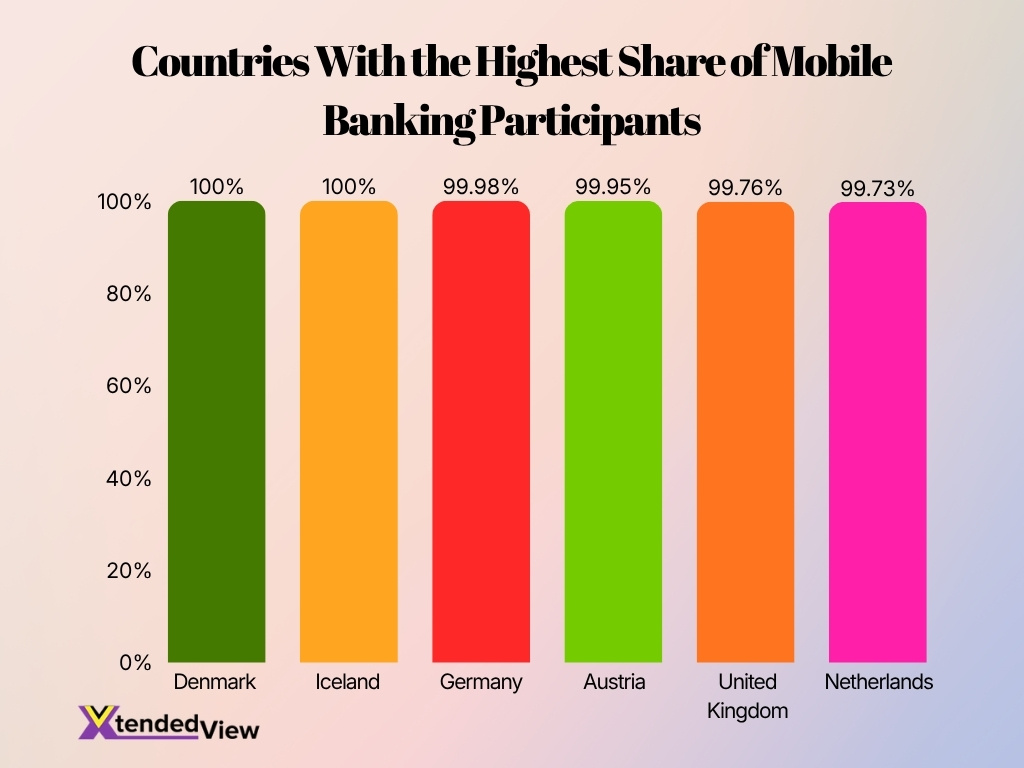
- Denmark and Iceland jointly lead the ranking, with 100% of banking participants represented in each country.
- Germany follows closely with a participation share of 99.98%, only 0.02 percentage points below the leaders.
- Austria records a similarly high banking participation rate of 99.95%, indicating near-universal access and engagement.
- The United Kingdom ranks fifth with 99.76% of participants involved in banking services.
- The Netherlands completes the top six with a strong participation share of 99.73%.
- All six countries report participation rates above 99.7%, highlighting exceptionally mature banking and mobile banking ecosystems.
- The gap between the highest and lowest countries in the ranking is just 0.27 percentage points, showing very little variation among the leaders.
Mobile Banking Penetration in Developed vs. Emerging Markets
- Nearly 80% of adults worldwide held a financial account in 2024, but adoption remained higher in developed economies than in many low-income markets.
- Account ownership in low- and middle-income economies reached approximately 75% of adults in 2024, narrowing the gap with high-income markets.
- Roughly 1.3 billion adults remained unbanked worldwide in 2024, and most lived in developing economies.
- Around 900 million unbanked adults owned a mobile phone, creating a direct path to mobile-led financial inclusion without requiring a nearby branch.
- About 530 million unbanked adults owned a smartphone, making app-based banking technically accessible to a large share of the excluded population.
- In low- and middle-income economies, 42% of adults made a digital merchant payment in 2024, compared with 35% in 2021.
- Digital financial transactions per adult in emerging markets increased from 55 in 2017 to 251 in 2024, a more than fourfold rise.
- In developing economies, 10% of adults used mobile money to save in 2024, twice the share recorded in 2021.
- Meanwhile, developed European markets such as Denmark and the Netherlands reported digital banking penetration above 95%, showing how universal connectivity raises usage ceilings.
Mobile Banking App Usage and Engagement Statistics
- In a 2026 U.S. survey of nearly 4,000 adults, 84% said they would give up social media for a year rather than lose access to their banking apps.
- The same study found that 95% of respondents had changed how they managed money during the previous year.
- More than half of those respondents, 56%, described their recent money-management changes as significant.
- Approximately 48% of consumers accessed a mobile banking app or banking website daily in recent international consumer research.
- Belgium reported that more than four in five consumers used a banking app at least once per month in 2025.
- A 2026 mobile banking usability study found that 81% of its 103 respondents regularly used banking apps.
- However, 77% of participants in that study experienced problems with their current mobile banking apps, including slow loading, unclear labels, and difficult navigation.
- About 44.7% of participants relied on third-party payment apps for everyday transactions because their banking apps did not meet all their needs.
- An analysis of app reviews from five major Canadian banks found that users praised usability and reliability but frequently criticized login failures, glitches, and poorly executed updates.
Generational Trends in Mobile Banking Preferences
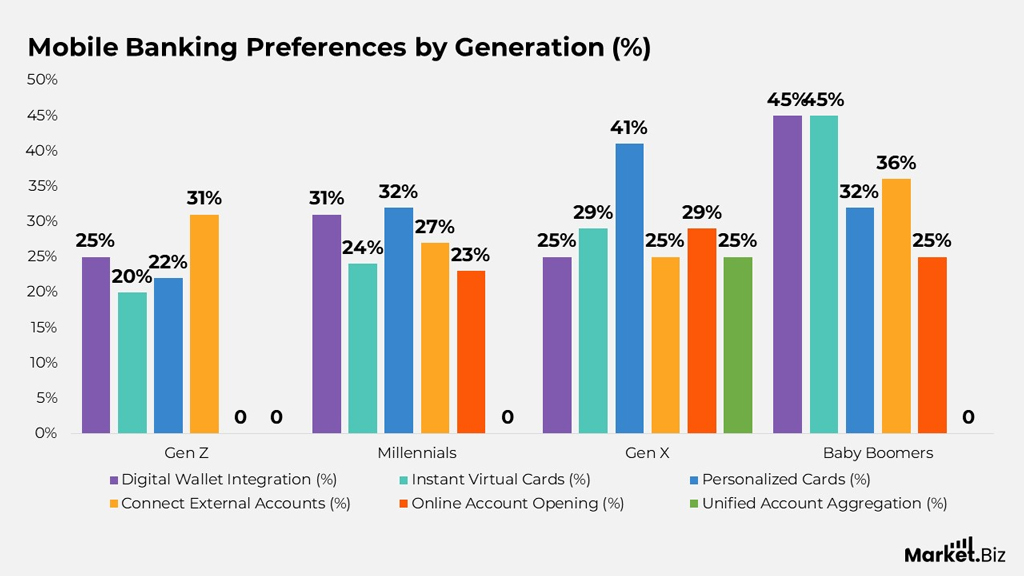
- Baby Boomers show the strongest preference for digital wallet integration and instant virtual cards, both at 45%.
- Personalized cards are most popular among Gen X, reaching 41%, compared with 32% for Millennials and Baby Boomers.
- Gen Z records its highest preference for connecting external accounts, at 31%.
- Among Millennials, personalized cards rank first at 32%, closely followed by digital wallet integration at 31%.
- Gen X shows relatively balanced demand, with instant virtual cards and online account opening both selected by 29%.
- Baby Boomers also report strong interest in connecting external accounts, with a preference rate of 36%.
- Online account opening is preferred by 29% of Gen X, 25% of Baby Boomers, and 23% of Millennials, while Gen Z records 0%.
- Unified account aggregation appears only among Gen X, where it is preferred by 25%.
- Preference for instant virtual cards rises steadily across generations, from 20% among Gen Z to 45% among Baby Boomers.
- The findings show that older consumers place greater value on wallet integration and virtual card features, while younger users favor account connectivity and personalization.
Mobile Banking Revenue and Profitability Statistics
- One large digital banking group generated $16.3 billion in revenue during 2025, up 45% year over year, while net income reached $2.9 billion.
- The same mobile-first provider served 131 million customers at the end of 2025 and reported a 33% return on equity in the fourth quarter.
- Another major app-based financial platform reported £4.5 billion in 2025 revenue, compared with £3.1 billion in 2024.
- Its pretax profit increased 57% to £1.7 billion in 2025 as its customer base reached 68.3 million.
- That provider’s loan portfolio doubled to £2.2 billion in 2025, showing how mobile-first companies increasingly earn revenue from credit rather than payments alone.
- A cross-border digital finance provider served 15.6 million active customers in fiscal 2025, up 21% from the previous year.
- Its fiscal 2025 revenue reached approximately £1.2 billion, while underlying income increased 31% to £219.8 million.
- A major traditional banking group reported 23.6 million digitally active users in 2025, including about 21.5 million mobile app customers.
- The traditional bank’s app user count increased approximately 45% between 2021 and 2025, illustrating how established banks can scale mobile channels alongside physical banking operations.
Neobanks vs. Traditional Banks Mobile Usage Statistics
- One global neobank reported more than 75 million customers by July 2026, including 13 million in the United Kingdom.
- The company supported transfers to more than 160 countries and allowed customers to hold up to 36 currencies through its app.
- Another app-based bank surpassed 12.5 million personal customers in 2025 and generated £1.24 billion in annual revenue.
- Its annual net profit rose from £8.7 million to about £94.6 million, showing how a neobank can improve profitability after building a large active-user base.
- A Latin American digital bank ended 2025 with 131 million customers, giving it a larger user base than many long-established retail banks.
- Meanwhile, a large traditional banking group maintained 21.5 million app users, an increase of roughly 45% from 2021.
- Traditional banks still retain an advantage in primary account relationships, deposits and lending, while many neobank customers continue to use digital accounts as secondary accounts.
- One mobile-first international money provider held £39 billion in customer balances in fiscal 2026, up 40% year over year, indicating deeper customer engagement.
- That provider’s active customer count reached 18.9 million in fiscal 2026, representing annual growth of 21%.
- App-based providers increasingly offer current accounts, direct debits, savings, credit and investment products as they compete to become customers’ main financial institutions.
Mobile Banking and Account Connectivity Insights
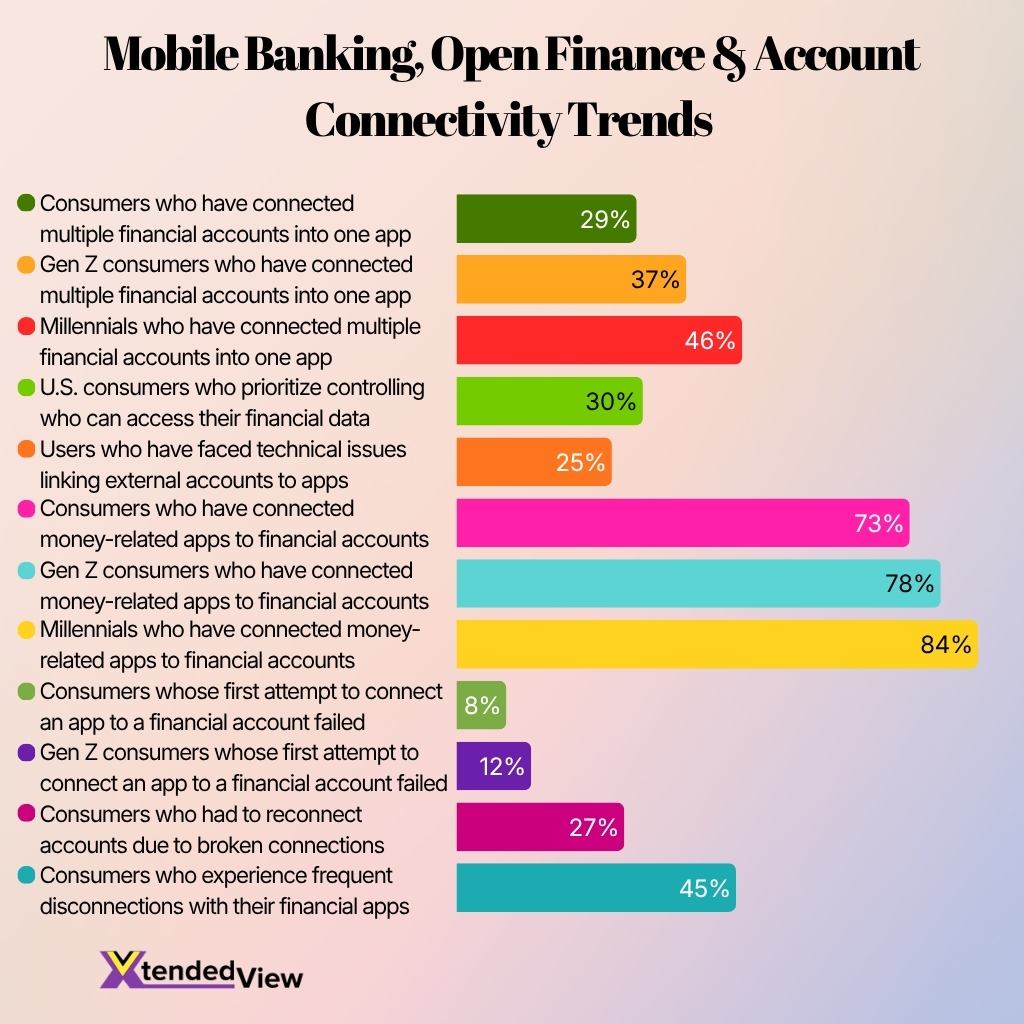
- 84% of millennials have connected money-related apps to their financial accounts, the highest adoption rate among the consumer groups shown.
- Gen Z adoption is also strong, with 78% connecting money-related apps to their financial accounts, compared with 73% of consumers overall.
- Nearly 46% of millennials have consolidated multiple financial accounts into a single app, significantly above the 29% overall consumer rate.
- Around 37% of Gen Z consumers have connected multiple financial accounts in one app, indicating growing demand for centralized financial management tools.
- Data control remains an important concern, as 30% of U.S. consumers prioritize having authority over who can access their financial information.
- Approximately 25% of users have experienced technical problems when linking external financial accounts to apps.
- Initial connection failures are relatively limited, affecting 8% of consumers overall and 12% of Gen Z users.
- Broken account connections remain a notable challenge, with 27% of consumers reporting that they had to reconnect their financial accounts.
- Frequent disconnections affect 45% of consumers, suggesting that connection reliability remains a major weakness in financial apps.
- Overall, the data shows high adoption of connected financial apps, particularly among younger generations, but technical reliability and recurring disconnections continue to limit the user experience.
Mobile Banking and Digital Payments Statistics
- U.S. consumers and businesses made 236.6 billion noncash payments in 2024, more than three times the number recorded in 2000.
- Cards accounted for more than three-quarters of U.S. noncash payments by number in 2024.
- Global mobile money transaction value passed $2 trillion in 2025, doubling from the $1 trillion milestone reached four years earlier.
- Open banking supported 31 million payments in March 2025 in the United Kingdom, equivalent to 7.9% of Faster Payments activity.
- Open banking payment volume grew 70% year over year by March 2025, while variable recurring payments represented 13% of the total.
- By December 2025, open banking had reached 16.5 million user connections, up 36% from a year earlier.
- Monthly account-to-account payments through open banking exceeded 33 million by October 2025, showing growing demand for direct bank payments.
Mobile Banking Security and Fraud Statistics
- U.S. internet crime complaints involving cryptocurrency produced $9.3 billion in reported losses during 2024, a 66% annual increase.
- Authorities received 149,686 cryptocurrency-related complaints in 2024, with adults age 60 and older reporting the largest combined losses.
- Cryptocurrency investment fraud generated $5.8 billion in losses from 41,557 complaints in 2024.
- Losses from cryptocurrency investment fraud rose another 24% to $7.2 billion in 2025, making it the costliest reported internet crime category that year.
- Financial institution support impersonation caused approximately 4,700 account takeover complaints and $359.7 million in losses during 2025.
- Reports involving cryptocurrency ATMs or kiosks reached 10,956 complaints and $246.7 million in losses in 2024.
- The number of high-value cyberfraud cases reported in India increased from 6,699 to 29,082 in fiscal 2024, a more than fourfold rise.
- A March 2026 mobile app software defect potentially exposed information belonging to 447,936 banking customers, although investigators reported no resulting financial losses.
- Roughly 114,182 users opened transactions that displayed another person’s account information, payment references or identification details during that incident.
- A review of 78 studies found that phishing and malware remained among the most common digital banking threats, while multifactor authentication and biometrics ranked among the most widely used defenses.
Mobile Banking Features Users Value Most
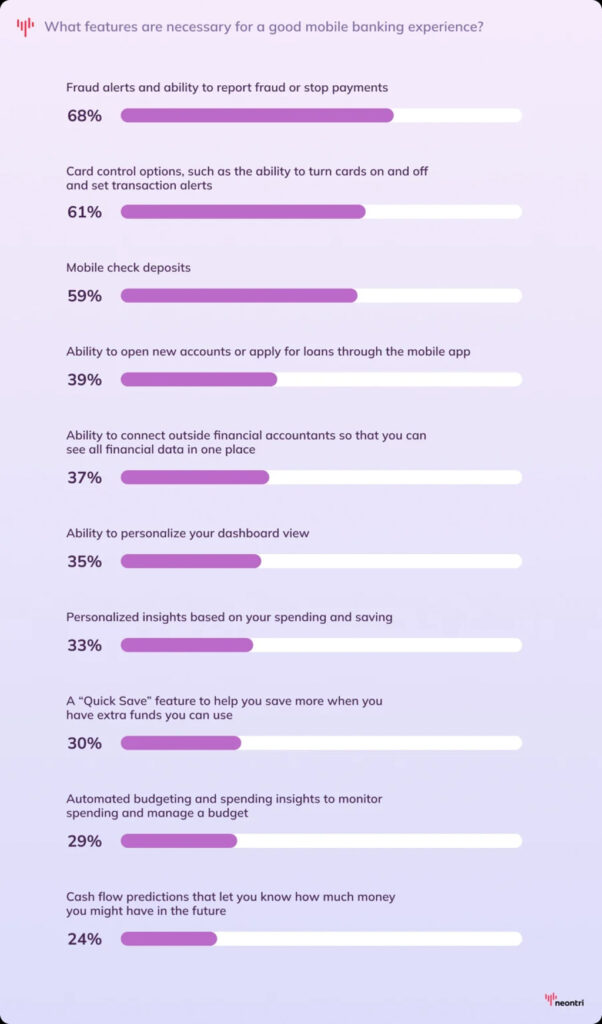
- Fraud protection leads user priorities, with 68% considering fraud alerts, fraud reporting, and payment stopping essential.
- Card control tools rank second at 61%, showing strong demand for card locking, unlocking, and transaction alerts.
- Mobile check deposits are important to 59% of respondents, making remote deposit capability a core banking feature.
- Only 39% prioritize opening new accounts or applying for loans directly through a mobile banking app.
- Account aggregation appeals to 37%, as users want to connect outside financial accounts and view finances in one place.
- Dashboard personalization matters to 35% of respondents, indicating moderate interest in customized app experiences.
- Personalized spending and saving insights are valued by 33%, suggesting users appreciate tailored financial guidance.
- A “Quick Save” feature attracts 30% of respondents who want easier ways to set aside extra funds.
- Automated budgeting and spending insights are important to 29%, reflecting demand for built-in money management tools.
- Cash flow predictions rank lowest at 24%, showing that forecasting features are less important than security and transaction controls.
Future Growth Projections for Mobile Banking
- The global neobanking market could increase from an estimated $210.16 billion in 2025 to $310.15 billion in 2026, based on one current industry forecast.
- The same forecast projects the market could reach $7.66 trillion by 2034, although actual growth will depend on regulation, competition and how providers define neobanking revenue.
- A separate projection estimates that neobanking could expand from $235.43 billion in 2025 to $16.44 trillion by 2035, representing a 52.9% compound annual growth rate.
- Open banking connections grew 36% in 2025, indicating that consumer-permissioned financial data sharing will remain a major mobile banking growth channel in 2026.
- One global digital bank aims to increase its user base from more than 70 million to 100 million by mid-2027.
- A large Indian bank plans to expand its mobile platform from approximately 94 million to 200 million users within two years.
- One international digital payments provider expects 15% to 20% net revenue growth in fiscal 2027 while maintaining a pretax margin near the upper end of its 20% to 25% target range.
- Continued growth in instant payments will support more in-app transfers, account-to-account merchant payments and real-time payroll transactions.
- The remaining 900 million unbanked adults who own mobile phones represent a substantial long-term market for app-based banking and mobile money services.
- However, future adoption will depend on reliable connectivity, consumer protection, digital literacy and secure identity verification, particularly in emerging economies and underserved communities.
Frequently Asked Questions (FAQs)
There were 2.3 billion registered mobile money accounts globally in 2025.
Mobile money services processed more than $2 trillion in transaction value during 2025.
Nearly 80% of adults worldwide owned a financial account in 2024.
There were 593 million active 30-day mobile money accounts worldwide in 2025.
UPI accounted for approximately 49% of global real-time payment volume in 2025.
Conclusion
Mobile banking has become the primary way consumers access financial services, and its influence continues to expand across payments, lending, savings and wealth management. Strong growth in digital banking revenue, mobile transactions, AI-powered services and open banking demonstrates that financial institutions are investing heavily in mobile-first experiences. At the same time, rising fraud losses and cybersecurity risks highlight the need for stronger security and customer education. Looking ahead, expanding smartphone access, real-time payment infrastructure and financial inclusion initiatives are expected to drive the next phase of mobile banking adoption worldwide.
