
Introduction
The prevalence of data breaches continues to rise as companies and individuals undergo increasing exposure to cyber risks. From healthcare and finance to retail and manufacturing, the impact of data breaches is felt across industries, for instance, a hospital system disclosing millions of patient records and a major cloud‑platform vendor exposing billions of credentials. In this article, we’ll unpack the latest statistics, show how and where breaches are happening, and invite you to explore key metrics shaping the landscape.
Editor’s Choice
Here are seven standout statistics that reflect major trends in data breach activity:
- The global average cost of a data breach in 2024 reached US $4.9 million, up about 10% from the prior year.
- Between 2023 and 2024, the number of victim notices in data breaches increased by 211% to about 1.3 billion.
- Over 70% of data breaches are attributed to organized crime groups.
- In July 2025, at least 29 publicly disclosed incidents impacted a minimum of 14.9 million records in a single month.
- Cloud data environments are involved in about 82% of data breach cases.
- The average time to identify a breach is approximately 194 days, with the full lifecycle to contain averaging 292 days.
- In 2025, about 73% of enterprises reported an AI‑related security incident, with an average cost per breach of around US $4.8 million.
Recent Developments
- In April 2025, the Yale New Haven Health System disclosed a breach affecting approximately 5.5 million individuals.
- During July 2025, global breach reporting identified 44 incidents and at least 14.9 million records breached, a minimum bound given incomplete disclosures.
- The July 2025 incident list highlighted major victims such as Qantas Airways (~6 million records) and Co‑op (~6.5 million records) via a third‑party system compromise.
- Large enterprises are increasingly targeted via vendor, cloud, and partner systems rather than direct internal intrusion.
- Credential theft and cloud misconfiguration remain prominent root causes of major breaches in 2025.
- Analysts observe that breaches now often combine data exfiltration and extortion/ransom demands, rather than pure theft.
- The trend of combining SaaS/cloud‑platform vulnerabilities with large‑scale data theft is growing rapidly.
- Some classification shifts now treat large credential dumps as de facto data breaches, given their reuse in subsequent attacks.
Key Data Breach Statistics
- The United States had the highest average breach cost in 2023, at about US $9.48 million per incident.
- In 2024, the protected health information (PHI) of 276,775,457 individuals was exposed or stolen in U.S. healthcare breaches, averaging 758,288 records per day.
- From January to April 2024, an estimated 36 billion records were exposed globally.
- About 46% of data breaches involve customer PII, while 40% involve employee PII.
- The number of victims receiving breach notices in 2024 reached about 1.3 billion.
- More than 86% of breaches involved stolen credentials.
- Nearly 45% of Americans say their personal information has been compromised in the last five years.
- The global cost of cybercrime is projected to reach US$23 trillion by 2027, representing a 175% increase from 2022.
Biggest Data Breaches of All Time
- The largest U.S. breach listed: Yahoo (2013), with ~3 billion records exposed.
- First American Corporation (2019) exposed ~885 million records in the financial sector.
- Marriott International (2018) breached ~500 million guest records.
- Facebook (2019) data exposure ~419 million records via accidental web exposure.
- The aggregate number of records exposed in publicly disclosed U.S. breaches rose from ~614 million a decade ago to over 3,205 million at peak.
- Among 2025’s largest breaches, vendor‑/cloud‑platform attacks have begun to dominate over traditional on‑premises hacks.
- One recent credential‑dump research found 16 billion exposed login credentials across ~30 databases.
- In the U.S., an estimated 3,158 data breach incidents were reported in 2024.
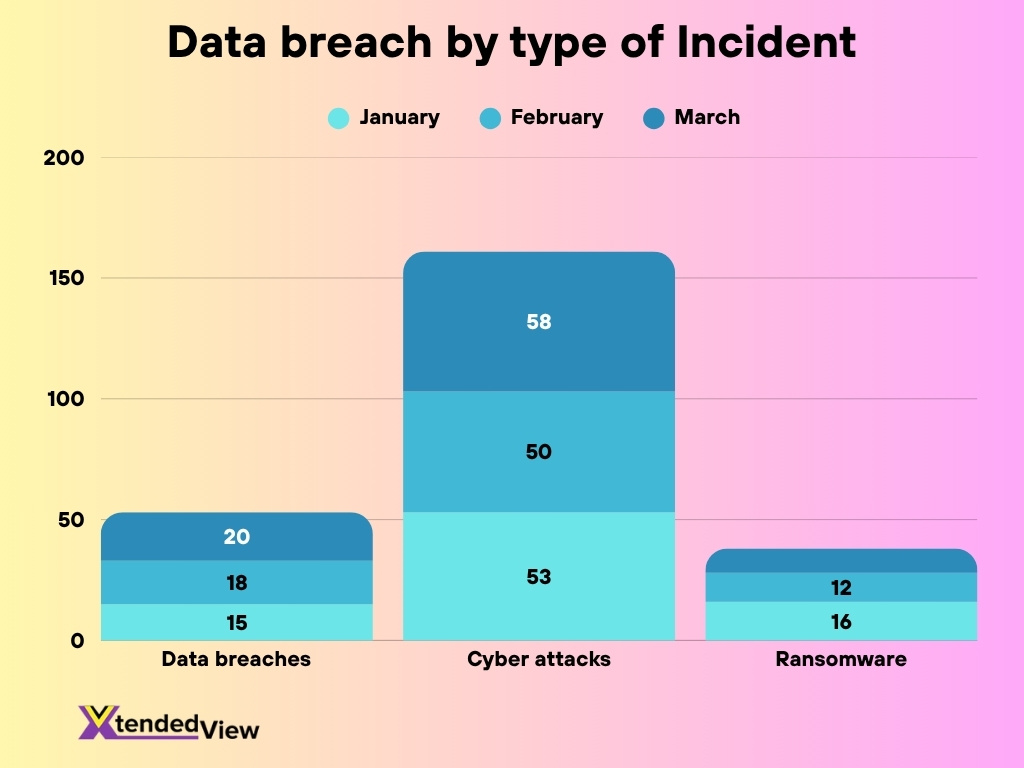
Data Breach Trends
- Cyber attacks were the most common type of incident, peaking at 58 cases in March, up from 53 in January and 50 in February.
- Data breaches showed a steady rise — from 15 cases in January to 20 in March, indicating an increasing trend in exposure risks.
- Ransomware incidents declined consistently, dropping from 16 cases in January to 10 in March, suggesting improved mitigation or detection efforts.
- Overall, March recorded the highest total number of incidents, mainly due to the surge in cyber attacks.
- The data suggests that while ransomware threats are decreasing, broader cyber attacks and data breaches are escalating, highlighting a shifting threat landscape that organizations must address.
Cost of Data Breaches
- For the 14th consecutive year, the healthcare sector posted the highest average breach cost, approximately US $7.42 million in 2025.
- Financial services remain heavily targeted, with breach costs averaging around US $6.08 million in earlier years and still among the highest.
- Small organizations (fewer than 500 employees) spent about 13.4% more managing breaches in 2024 compared to larger firms, average cost of around US $3.31 million.
- In the U.S., healthcare data breaches in 2023 numbered 725 and exposed over 133 million records.
- The education sector in 2024 experienced 1,780 security incidents, including 1,537 confirmed disclosures, with external actors behind 68%.
- The accommodation & food services sector had 220 security incidents in 2024, with 106 confirmed breaches, 92% resulted from system intrusion, social engineering, or web application attacks.
- Critical infrastructure organizations had average breach costs of approximately US $4.82 million in 2025.
- The U.S. average breach cost (US$10.22 million) exceeded the second‑place region (Middle East) by roughly 40%.
Data Breaches by Industry
- The United States averaged about US $10.22 million per breach in 2025, the highest globally.
- The Asia‑Pacific region accounted for about 34% of global cyberattacks and saw a 13% year‑over‑year increase in incidents.
- In 2024 the U.S. cost average was US $9.36 million, down slightly from US $9.48 million in 2023.
- The Middle East had an average breach cost of about US $8.75 million in 2024.
- Worldwide, the cost of cybercrime is projected to reach US $10.5 trillion by 2025.
- In Q2 and Q3 of 2025, the Identity Theft Resource Center (ITRC) tracked 2,563 compromise incidents in the U.S., resulting in nearly 202 million victim notices.
- Organizations across regions that resolved breaches in under 200 days saved roughly US $1.14 million compared to longer‑lived incidents.
- In 2025, global average breach costs returned to ~US $4.44 million, a reversal of upward cost trends in many regions.
Data Breaches by Geography
- Stolen or compromised credentials were involved in approximately 53% of data breaches in 2025.
- Phishing accounted for about 16% of breaches in 2025, with an average cost of around US $4.8 million.
- Supply‑chain compromise was the second most common initial vector at ~15%, with an average cost ~US $4.91 million.
- Vulnerability exploitation showed up in ~8% of breaches, average cost of ~US $4.24 million.
- External actors caused ~70% of data breaches, internal actors ~29%.
- Human error and IT failures combined for about 49% of breach causes (26% human error, 23% IT failure).
- In 2025, ~16% of breaches involved AI‑driven attacks (e.g., phishing (37%) and deepfakes (35%)).
- “Valid accounts” were among the most common second‑stage vectors in recent years.
Most Common Attack Vectors
- Stolen or compromised credentials were the most frequent initial attack vector in 2025, responsible for approximately 53% of breaches.
- Phishing accounted for about 16% of breaches, with an average cost of US $4.8 million per incident.
- Vulnerability exploitation, including unpatched software flaws, was involved in about 8% of breaches.
- Malicious insiders accounted for 12% of incidents, often leveraging privileged access or bypassing security protocols.
- Business Email Compromise (BEC) attacks rose by 11%, particularly targeting finance and HR departments.
- Third‑party/supply chain compromise became the second most used vector, appearing in 15% of breaches.
- Misconfigured cloud storage was a major cause of data exposure, particularly with platforms like AWS S3 and Azure Blob.
- Drive‑by downloads and web shell intrusions contributed to a smaller but notable percentage of breaches, especially in the retail and tech sectors.
- Physical theft or loss of devices (like laptops or hard drives) made up less than 2% of breaches but had disproportionately high costs due to a lack of encryption.
- Zero‑day exploits gained prominence in 2025, with several high‑profile breaches traced back to newly discovered, unpatched vulnerabilities.
Ransomware and Extortion Statistics
- Ransomware or extortion incidents accounted for between 59‑66% of financially motivated cyberattacks in 2025.
- The average cost of a ransomware or extortion incident in 2025 was around US $5.08 million.
- About one‑third of breaches in 2024 involved ransomware or extortion.
- 63% of organizations refused to pay ransom, while 37% agreed to pay in 2025.
- Only about 40% of organizations involved law enforcement in 2025, down from 52% the prior year.
- In 2025, the average ransom demand represented approximately 1.34% of a company’s revenue, with cases ranging from 0.13% to 8.3%.
- In critical infrastructure sectors, around 28% of organizations faced destructive ransomware in 2024.
- The speed from initial access to ransomware deployment is shrinking, as 77% of incidents occurred within 30 days of initial access, and 54% within seven days.
The Human Element in Data Breaches
- The human element, including errors, misuse, and social engineering, contributed to 60% of all breaches in 2025.
- Social engineering was involved in 68% of breaches that involved people.
- Phishing simulations show victimization happens quickly, with an average time to click of about 21 seconds, and to enter data about 28 seconds.
- In the accommodation and food sector, around 25% of breaches involved social engineering.
- Human‑error related breaches (26%) and IT failures (23%) together form nearly half of incident causes.
- Organizations with better employee training, encryption, and DevSecOps reported lower average costs of US $3.89 million, compared to limited adoption cases at US $5.02 million.
- In sectors such as U.S. healthcare, internal actors contributed a higher share of breaches than in many other industries.
Social Engineering Statistics
- Approximately 70‑90% of all cyberattacks involve social engineering‑type tactics, with phishing being the dominant method.
- In 2025, social engineering was cited as the root cause in about 17% of data breaches, down from 22% in 2024.
- Around 36% of incident‑response workloads included social engineering as a contributing trigger.
- 66% of phishing attacks targeted privileged accounts, and 45% involved impersonation of internal personnel.
- More than 90% of advanced persistent threat campaigns relying on social engineering began with a malicious actor using collaboration or engagement lures.
- In cloud intrusion incidents, initial access came from email phishing (39%), stolen credentials (35%), SIM swapping (6%), and vishing (6%).
- Mobile‑based social engineering, or smishing, is becoming more common, with mobile open‑rates for malicious texts ranging from 8–14%, compared with email open‑rates below 2%.
- One report shows that 82% of data breaches involved a human element such as social engineering or misuse of credentials.
- Among organizations surveyed, about 72% of social‑engineering attacks involved user mistakes, misdelivery, or misconfiguration.
- Experts warn that AI‑enabled social engineering, such as deepfakes and hyper‑personalized phishing, will escalate dramatically in 2025, raising the bar on threat realism.
Insider Threat Statistics
- 83% of organizations reported at least one insider‑threat incident in the past year.
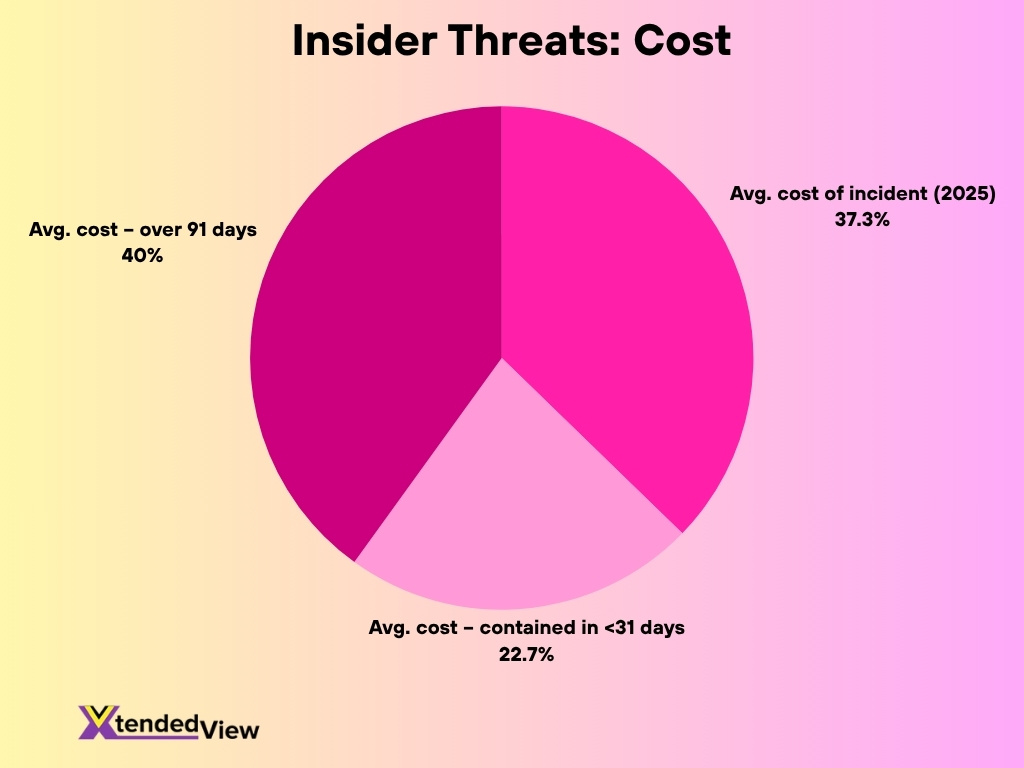
- The annual average cost of an insider‑risk incident reached about US $17.4 million in 2025, up from US $16.2 million in 2023.
- Organizations that contained insider incidents in under 31 days saw average costs of about US $10.6 million, while those lasting over 91 days cost approximately US $18.7 million.
- Non‑malicious insiders, such as negligent employees or social engineering victims, account for about 75% of insider‑led security incidents.
- Less than 30% of organizations believe they have the right tools to manage insider threat activity, though 76% say incidents have increased over the past five years.
- The average time to contain a malicious insider incident is around 85 days.
- In 2025, 81% of organizations have or plan to have an insider‑risk management program in place.
- Organizations increased the share of IT security budgets dedicated to insider‑risk management from 8.2% in 2023 to 16.5% in 2025.
- Among financial service firms, more than 64% disclosed that over 1,000 sensitive files were accessible to all employees, escalating insider‑risk exposure.
Third‑Party and Supply Chain Breaches
- Breaches involving third parties or supply chains surged by 68%, making up about 30% of all data breaches in 2025.
- The average cost of a supply‑chain or third‑party compromise reached approximately US $4.46 million, with detection time about 26 days longer than other breach types.
- In recent surveys, 71% of organizations experienced at least one third‑party cyber‑incident that had a material business impact in the prior 12 months.
- More than 37% of organizations suffered three or more impactful supply‑chain incidents during the same period.
- Supply‑chain breaches took an average of about 267 days to identify and contain, the longest among attack types.
- Vendor trust relationships and integrated systems are now identified as among the largest uncontrolled exposure points for enterprise security.
- Open‑source malware infections in vendor environments rose by over 1,300% since 2019, reflecting increased supply‑chain attack surface.
- A major data‑breach investigation found build systems and trusted software providers posed unique risk vectors for large‑scale corporate breaches.
Detection and Response Times
- The global average time from breach identification to containment dropped to about 249 days for organizations using AI and automation, compared to 321 days for those without.
- Organizations that deployed AI and automation extensively reduced breach lifecycle by around 80 days compared with those without such tools.
- Even with automation, some breaches still took over 276 days to contain when data spanned multiple environments.
- Breaches involving supply‑chain compromise ranked highest for resolution time at around 267 days to containment on average.
- The number of days to identify a breach has a direct correlation with cost, as each additional 30 days typically adds hundreds of thousands in cost.
- Organizations using AI‑driven security tools had average breach costs of about US $3.62 million, whereas those without averaged around US $5.52 million in 2025.
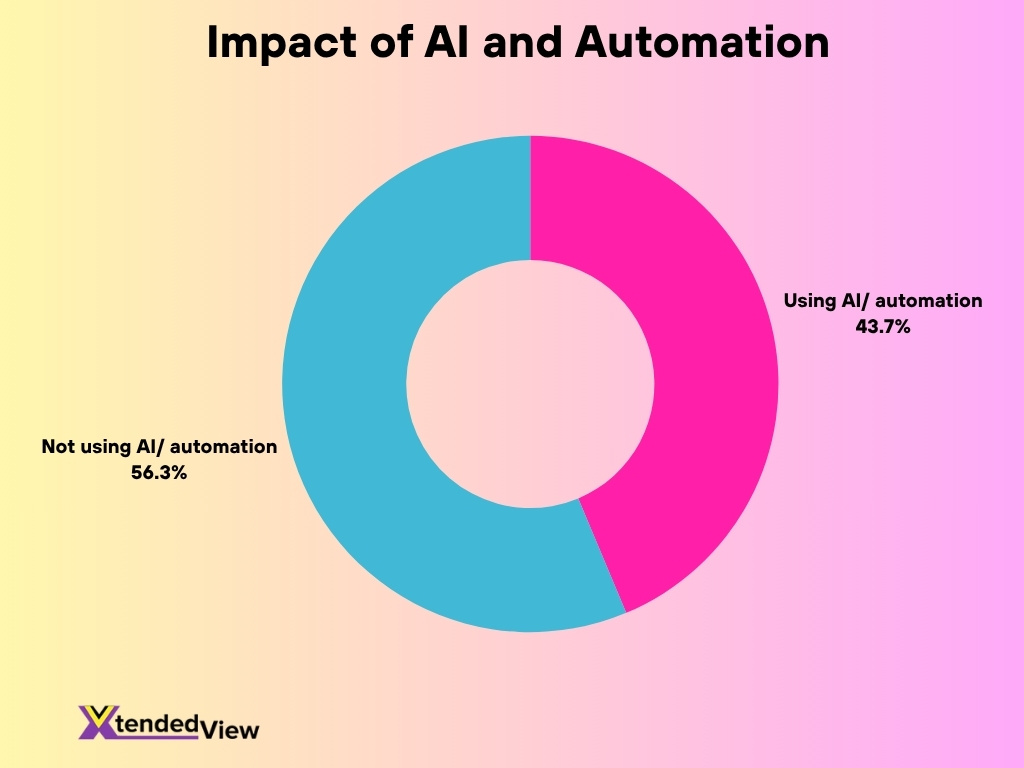
- Only about 32% of organizations claimed they used AI and automation extensively, while 28% said they used none.
- The average cost‑saving for those with high automation was approximately US $1.9 million per breach compared to low‑automation peers.
Organizational Response and Recovery
- After a breach, 49% of organizations indicated they increased investment in security as a recovery step.
- Organizations that involved law enforcement during a ransomware or extortion incident had lower average costs, yet only 40% did so in 2025, down from 53% in 2024.
- Operational disruption occurred in 86% of organizations that suffered a breach in 2025.
- About 45% of organizations reported raising customer or service prices to offset breach expenses in 2025.
- Firms deploying formal incident‑response and crisis simulation programs reported significantly lower breach costs than those without them.
- The median amount of covered data subject notices for U.S. firms increased notably, requiring stronger legal, public relations, and compliance processes post‑breach.
- About 63% of organizations reported refusing to pay ransom in 2025, showing recovery strategy remains morally and financially complex.
- Firms with high employee training, encryption adoption, and DevSecOps alignment reported containment times that were about 25% faster.
Security Investment Trends
- The estimated global cost of cybercrime is projected to reach up to US $10.5 trillion by 2025, reflecting the scale of investment needed.
- Companies expect to increase cybersecurity product spending by about 50% compared to general software spending in the coming years.
- Among organizations surveyed, 32% said they use AI and automation extensively, 40% reported limited use, and 28% reported no use.
- The share of IT security budget dedicated to insider‑risk management grew from 8.2% in 2023 to 16.5% in 2025.
- In the U.S., the average cost of a data breach in 2025 reached about US $10.22 million, prompting many firms to prioritize protective controls.
- Organizations that integrated DevSecOps and automation tools saw breach costs around US $3.89 million, compared to around US $5.02 million for limited adoption.
- The global cybersecurity workforce is projected to face a shortfall of millions of professionals, driving investment in automation.
- Spending on identity security, AI oversight, security automation, and cloud defenses has been identified as a top priority for 2025.
AI and Automation Impact on Data Breaches
- Organizations using AI in security extensively reduced breach costs by approximately US $1.9 million, with an average cost of around US $3.62 million versus US $5.52 million for non‑users.
- Rapid AI adoption without governance increased breach probability, as 97% of AI‑related incidents occurred in organizations lacking proper AI access controls.
- Breaches involving shadow AI, or unauthorized AI usage, added about US $670,000 in average cost per incident.
- Organizations with full deployment of automated detection and response tools cut average identification and containment times to around 153 days and 51 days, respectively, compared with 212 and 72 days for non‑users.
- AI‑driven social engineering is forecast to spike, enabling threat actors to scale personalized attacks across mass platforms with less effort.
- In 2025, 63% of organizations reported an AI‑related security incident, but only 37% had a formal AI governance policy.
- Automation and AI adoption now rank ahead of perimeter firewalls in many firms’ prioritization of cybersecurity investments.
Frequently Asked Questions (FAQs)
The global average cost is US$4.44 million in 2025.
In the U.S. ,the average cost rose to US $10.22 million in 2025.
74% of large UK businesses reported experiencing a breach or attack in that period.
Ransomware or extortion incidents accounted for approximately 59–66% of financially motivated cyberattacks in 2025.
The average lifecycle from identification to containment was about 241 days in 2025.
Conclusion
The data breach landscape in 2025 paints a clear picture. While average costs are slightly declining globally thanks to faster detection and containment, the complexity of incidents is rising. Attackers increasingly utilize social engineering, exploit insider threats, and penetrate networks via supply‑chain partners. Organizations that adopt automation, AI‑driven security, and robust incident‑response processes gain measurable advantages in containment speed and cost reduction. At the same time, failure to govern AI, neglecting vendor risk, and under‑invest in human training and visibility continue to elevate exposure