
Cybersecurity has become a core business priority as organizations rely more heavily on cloud platforms, connected devices, AI tools, and remote work environments. From protecting patient records in healthcare to securing digital payments in banking, cybersecurity now influences operational resilience, customer trust, and regulatory compliance. As cyber threats grow in scale and sophistication, understanding the latest cybersecurity statistics helps organizations make informed security investments. Explore the data below to see how the cybersecurity landscape is evolving.
Editor’s Choice
- Global cybercrime damages are projected to reach $10.5 trillion annually, making cybercrime one of the largest economic threats worldwide.
- The global average cost of a data breach declined to $4.44 million in 2025, down from $4.88 million in 2024, marking the first significant decline in several years.
- Organizations using extensive AI and automation saved an average of $1.9 million per breach compared with organizations that did not.
- The average U.S. data breach cost reached a record $10.22 million, more than double the global average.
- The average breach lifecycle fell to 241 days, the shortest period reported in nearly a decade.
- Cyberattacks now occur approximately 2,328 times per day, or roughly once every 37 seconds.
- Nearly 68% of data breaches involve a human element, including phishing, credential theft, or user errors.
Recent Developments
- Security AI adoption accelerated across enterprises in 2025, contributing to the first year-over-year decline in average breach costs since 2020.
- About 63% of organizations reported having no formal AI governance policy despite increasing AI deployment.
- A staggering 97% of organizations experiencing AI-related incidents lacked proper AI access controls.
- Around 16% of reported breaches now involve AI-related attack techniques or AI misuse.
- Cyber insurance premiums are expected to grow from $14 billion in 2023 to $29 billion by 2027.
- Nearly 76% of surveyed organizations reported a breach or suspected breach to authorities during the past year.
- Security teams using AI reduced breach identification time from 72 days to 51 days on average.
- AI-assisted security programs lowered average breach costs to $3.62 million, compared with $5.52 million among organizations without extensive AI usage.
- Third-party and supply-chain incidents remain among the most expensive cyberattack vectors worldwide.
General Cybersecurity Statistics
- Global cybercrime costs increased from approximately $3 trillion in 2015 to $10.5 trillion by 2025, representing a decade-long increase of about 250%.
- The FBI continues to receive hundreds of thousands of cybercrime complaints annually, with financial losses reaching tens of billions of dollars.
- Cyberattacks increased by roughly 30% year over year during Q2 2024, reflecting sustained growth in attack activity.
- Approximately 96% of attack exposure originates from web applications, APIs, and cloud-connected systems.
- Human actions contribute to nearly 68% of breaches, making employee awareness a critical security factor.
- Studies suggest up to 88% of data breaches involve human mistakes at some stage of the attack chain.
- Remote-work-related breaches cost organizations an additional $173,074 on average compared with other incidents.
- Around 70% of breached organizations report significant operational disruption following a cyber incident.
- The average cost per compromised record stood at $160 in 2025.
Cybersecurity Services Market Growth Statistics
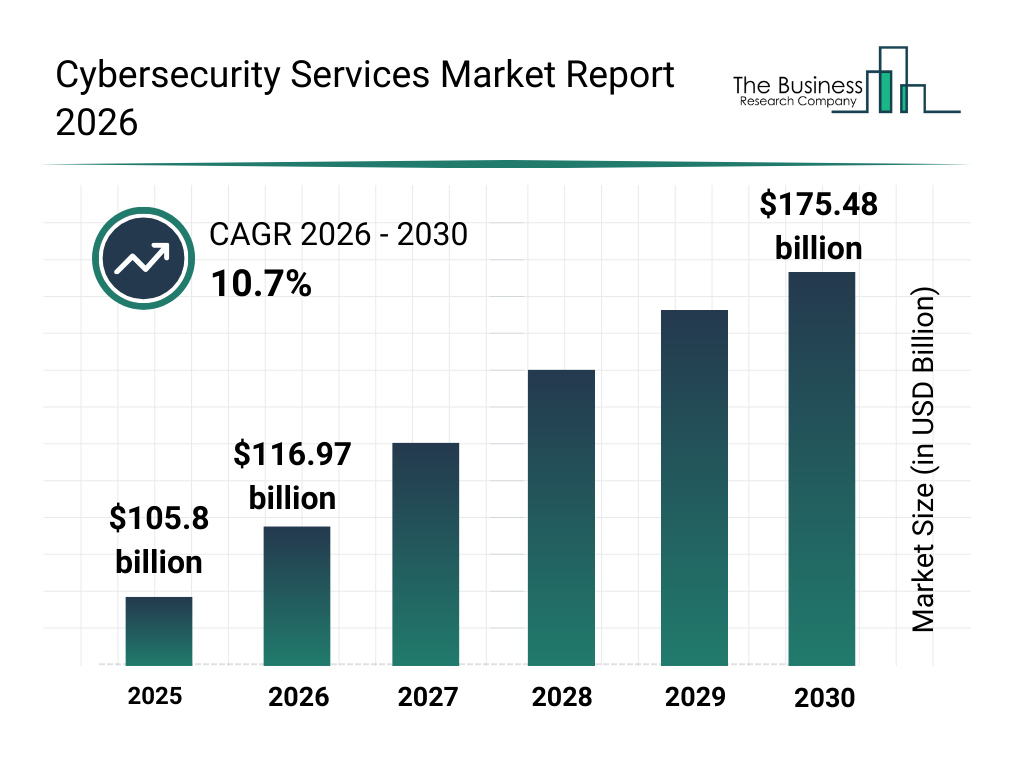
- The cybersecurity services market is projected to grow from $105.8 billion in 2025 to $175.48 billion by 2030, highlighting strong industry expansion.
- The market is expected to reach $116.97 billion in 2026, reflecting continued investment in cybersecurity solutions.
- The industry is forecast to achieve a robust 10.7% CAGR between 2026 and 2030, signaling sustained growth momentum.
- Market value is projected to increase by nearly $69.68 billion between 2025 and 2030.
- By 2030, the cybersecurity services market is expected to surpass $175 billion, driven by rising cyber threats and security spending.
- The chart indicates consistent year-over-year growth throughout the 2025–2030 forecast period.
- Organizations worldwide are increasing cybersecurity investments, contributing to the market’s projected 10.7% annual growth rate.
- The market is expected to expand by approximately 65.9% from 2025 to 2030, underscoring growing demand for cybersecurity services.
Cost of Cyberattacks and Data Breaches
- The average global data breach cost reached $4.44 million in 2025, compared with $4.88 million in 2024.
- The average U.S. breach cost climbed to $10.22 million, the highest recorded globally.
- Healthcare breaches cost an average of $7.42 million in 2025.
- Financial sector breaches averaged $5.56 million per incident.
- Organizations with understaffed security teams experienced breach costs approximately $550,000 higher than adequately staffed organizations.
- The cybersecurity skills shortage contributed to an estimated $1.76 million increase in average breach costs.
- Breach detection and containment still require an average of 241 days, creating prolonged business exposure.
- Organizations using AI-driven security operations reduced breach costs from $5.52 million to $3.62 million.
- Approximately 80% of organizations with cyber insurance receive at least partial breach-related coverage.
Cybersecurity Workforce and Employment Statistics
- The global cybersecurity workforce currently faces a massive shortage of 4.8 million unfilled positions.
- Security staffing shortages increase average data breach costs by approximately $1.76 million.
- Organizations with insufficient cybersecurity staffing incur average breach costs of $4.56 million, which is $550,000 higher than adequately staffed peers.
- About 90% of security teams report critical skills gaps, especially within AI and cloud security domains.
- The global cybersecurity workforce must grow by 87% to fully satisfy current industry employer demand.
- AI-enabled security teams identify and resolve threat incidents approximately 21 days faster than organizations with limited AI.
- Around 54% of organizations actively cite a lack of IT security skills as the primary leading cause of successful cyber breaches.
- The employment of information security analysts is projected to grow by 31%, far exceeding the average growth rate for all occupations.
- Nearly 48% of all organizations typically take more than 6 months to successfully fill an open cybersecurity vacancy.
Data Breach Trends Across Attack Vectors
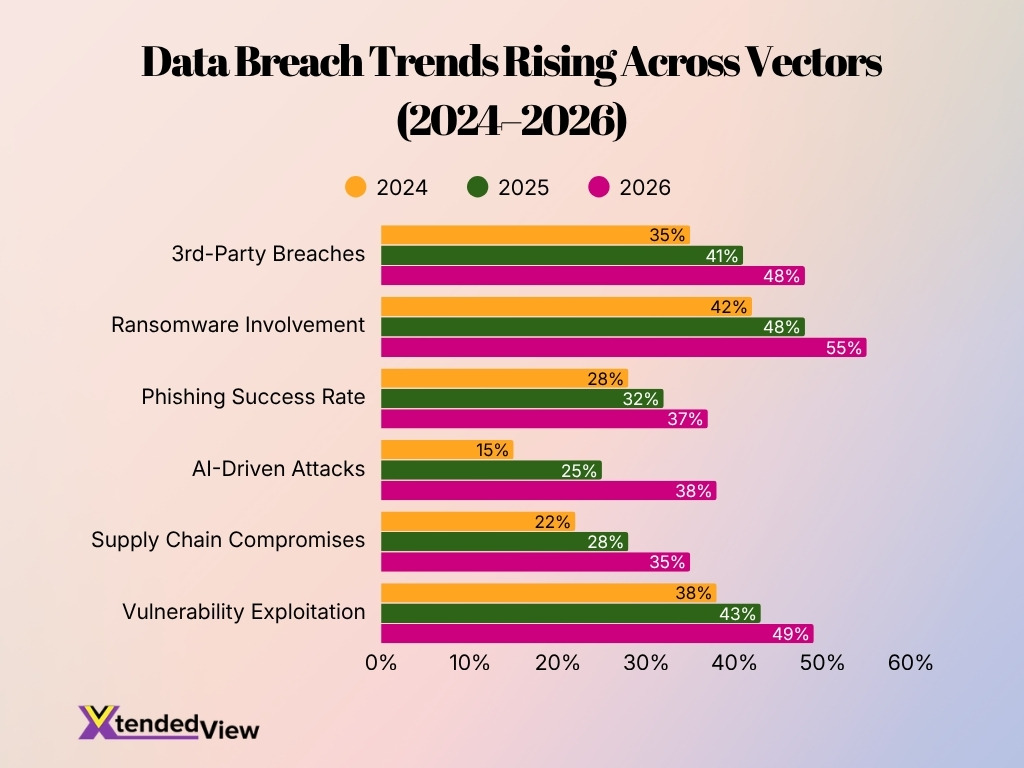
- Ransomware involvement is projected to rise from 42% in 2024 to 55% in 2026, the highest among all attack vectors.
- AI-driven attacks show the fastest growth, surging from 15% in 2024 to 38% in 2026.
- 3rd-party breaches are expected to increase steadily from 35% to 48% between 2024 and 2026.
- Vulnerability exploitation is forecast to climb from 38% in 2024 to 49% in 2026.
- Supply chain compromises are predicted to grow from 22% to 35% over the three-year period.
- Phishing success rates are expected to increase from 28% in 2024 to 37% in 2026.
- Every major attack vector shows consistent year-over-year growth through 2026.
- Ransomware and vulnerability exploitation will remain the two most prevalent breach drivers by 2026.
- AI-driven attacks gain 23 percentage points, the largest increase among all categories.
- Organizations face escalating risk as all six breach vectors trend upward through 2026.
Data Breach and Information Leak Statistics
- More than 3,200 publicly reported data compromises affected U.S. organizations during 2024, exposing billions of records.
- The average global data breach cost reached $4.44 million in 2025, compared with $4.88 million in 2024.
- The average cost per compromised record was approximately $160 in 2025.
- Stolen or compromised credentials remained the most common initial attack vector, accounting for roughly 16% of breaches.
- Breaches involving personal identifiable information (PII) cost organizations approximately $194 per record, among the highest record-level costs reported.
- Organizations required an average of 241 days to identify and contain a data breach in 2025.
- Nearly 46% of breached organizations reported customer information as the primary data type exposed.
- Third-party involvement contributed to approximately 15% of all breaches, highlighting supply-chain risks.
- Breaches involving shadow data increased significantly, with nearly 35% of breached records stored in unmanaged environments.
Ransomware Attack Statistics
- Ransomware remained one of the most costly cyber threats in 2025, with average recovery costs exceeding $2.7 million per incident.
- Approximately 59% of organizations reported experiencing a ransomware attack during the previous year.
- The average ransom payment reached approximately $2 million in recent global surveys.
- Nearly 32% of ransomware attacks began through exploited vulnerabilities rather than phishing emails.
- Organizations that paid a ransom recovered only about 57% of their encrypted data on average.
- Manufacturing remained the most targeted industry for ransomware attacks globally in 2025.
- Double-extortion tactics, where attackers steal and encrypt data simultaneously, appeared in the majority of modern ransomware campaigns.
- The median ransomware recovery time was approximately 24 days, causing significant operational disruption.
- Law enforcement disruptions led to several major ransomware group takedowns during 2024 and 2025, yet overall attack volume remained high.
Regional Cybersecurity Cost Analysis
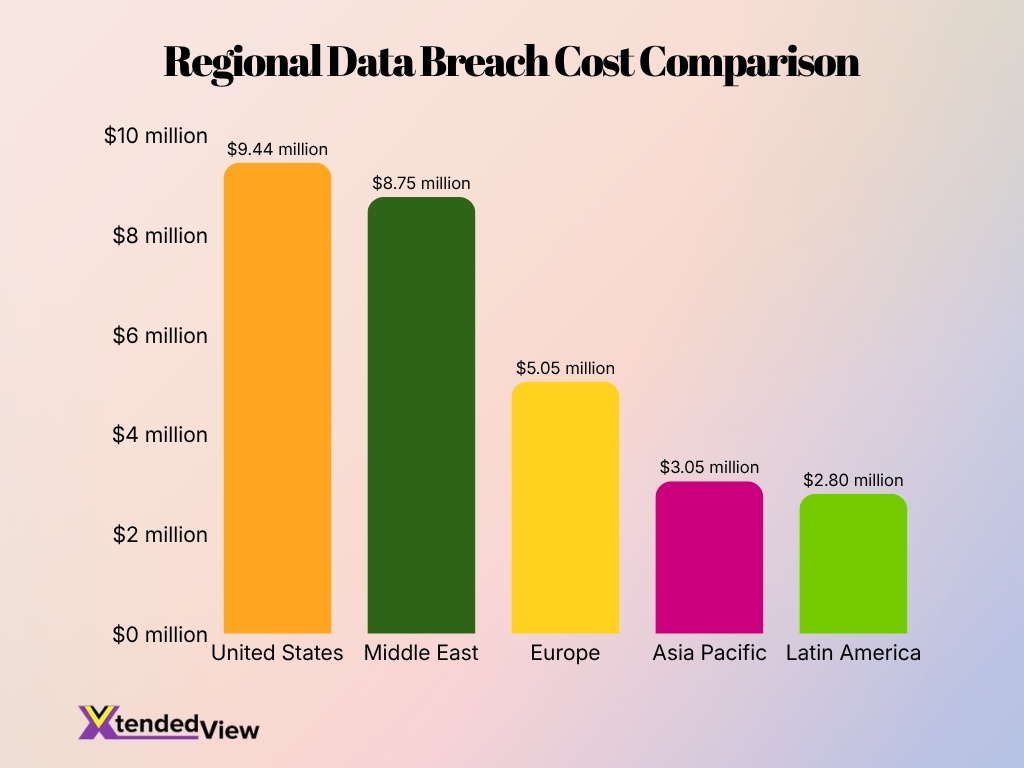
- The United States has the highest average breach cost at $9.44 million, with $180 per record exposed.
- The Middle East ranks second with an average breach cost of $8.75 million and $165 per record.
- Europe reports a moderate breach cost of $5.05 million, while each compromised record costs $155.
- Asia Pacific has a lower average breach cost of $3.05 million, with $125 per record.
- Latin America records the lowest breach cost at $2.80 million, along with $110 per record.
Phishing and Social Engineering Statistics
- 62% of cybersecurity breaches directly involve the human element, primarily through phishing and social engineering.
- Threat actors send approximately 3.4 billion phishing emails globally every single day to compromise targets.
- The average financial cost of a data breach caused by phishing has escalated to $4.88 million per incident.
- AI-generated phishing emails now account for 82.6% of detected attacks and achieve a 60% higher click rate.
- Business Email Compromise (BEC) schemes generated massive financial damages, totaling $3.05 billion in annual losses.
- QR code phishing, commonly known as quishing, experienced an unprecedented 400% increase in overall attack volume.
- Organizations that implement regular security awareness training successfully reduce malicious employee click rates by 87%.
- The Hospitality and Education sectors remain the most vulnerable, recording an unmanaged employee click rate of over 50%.
Malware and Cyber Threat Statistics
- Larger enterprises face an average of 2,090 malware attacks per week globally.
- Approximately 560,000 new malware variants are identified and detected every single day.
- Trojans currently dominate the threat landscape, comprising roughly 58% of all malware detections.
- Malware-free attacks using stolen credentials now account for 79% of all initial access breaches.
- More than 94% of malware infections are actively delivered to victims via email attachments.
- AI-driven cyberattacks have surged dramatically, showing an 89% increase year-over-year.
- The fastest recorded eCrime breakout time has rapidly dropped to just 27 seconds after initial compromise.
- Ransomware incidents continue to escalate, found in nearly 44% of all confirmed data breaches.
- The global financial cost of cybercrime is projected to surpass $10.5 trillion annually.
Most Frequently Blocked Malware Types
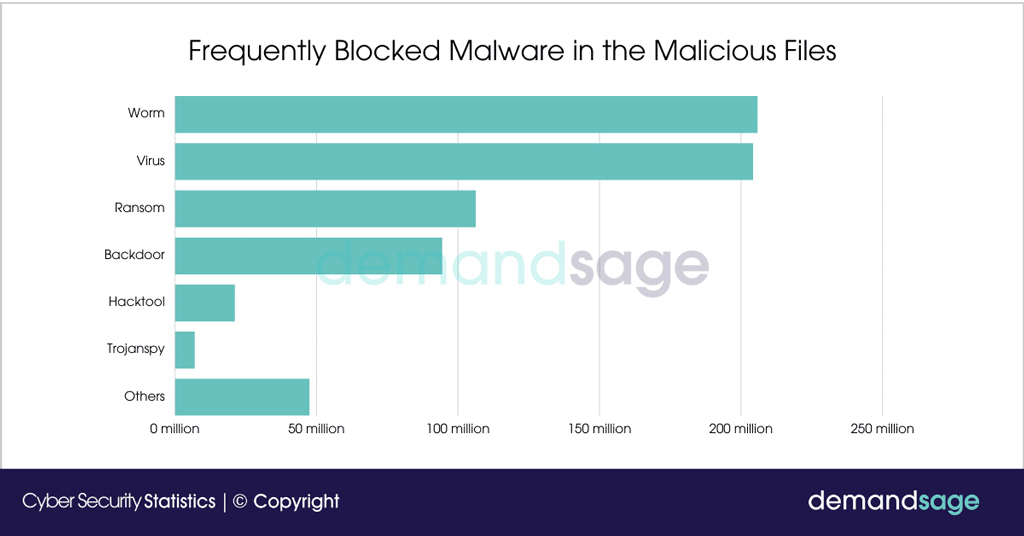
- Worms were the most blocked malware type, with 205.85 million detections, making them the leading cyber threat.
- Viruses followed closely at 204.2 million blocked instances, showing they remain one of the most widespread forms of malware.
- Ransomware accounted for 106.19 million blocked threats, highlighting the ongoing risk of data encryption and extortion attacks.
- Backdoor malware generated 94.35 million detections, underscoring attackers’ efforts to gain unauthorized system access.
- The Others category contributed 47.5 million blocked malware incidents across various threat families.
- Hacktools were responsible for 21.11 million blocked detections, reflecting the misuse of software designed for unauthorized access or exploitation.
- Trojanspy ranked lowest with 6.92 million blocked cases, but still posed a significant threat to user privacy and data security.
- Combined, Worms and Viruses accounted for more than 410 million blocked malware detections, dominating the threat landscape.
Cloud Security Statistics
- More than 94% of enterprises now use cloud services in some capacity.
- Approximately 82% of data breaches involve information stored in cloud environments.
- More than 31% of cloud security incidents occur due to system misconfigurations globally.
- Over 70% of cloud breaches stem from compromised identities and access management failures.
- Nearly 39% of organizations experienced a cloud data breach during the past year.
- Roughly 45% of all data breaches occur directly within public cloud environments.
- A significant 95% of cloud security failures stem from human error rather than provider flaws.
- An estimated 31% of cloud data breaches are directly linked to insecure or exposed APIs.
- Around 69% of organizations report visibility gaps as major multi-cloud security challenges.
IoT and Connected Device Statistics
- The number of connected IoT devices worldwide is expected to exceed 30 billion by the end of the decade.
- IoT attacks increased by more than 100% year over year in several monitored sectors.
- Approximately 57% of IoT devices remain vulnerable to medium- or high-severity attacks.
- Healthcare, manufacturing, and smart city infrastructure remain key targets for IoT-focused attacks.
- More than 25% of cyberattacks against enterprises now involve IoT-connected assets.
- Default credentials continue to be one of the most exploited IoT security weaknesses.
- Industrial IoT deployments significantly expanded across U.S. manufacturing facilities during 2025.
- Connected medical devices represent one of the fastest-growing IoT security concerns in healthcare.
- Organizations increasingly deploy IoT-specific security platforms to monitor unmanaged connected devices.
User Confidence in Automatic Device Security
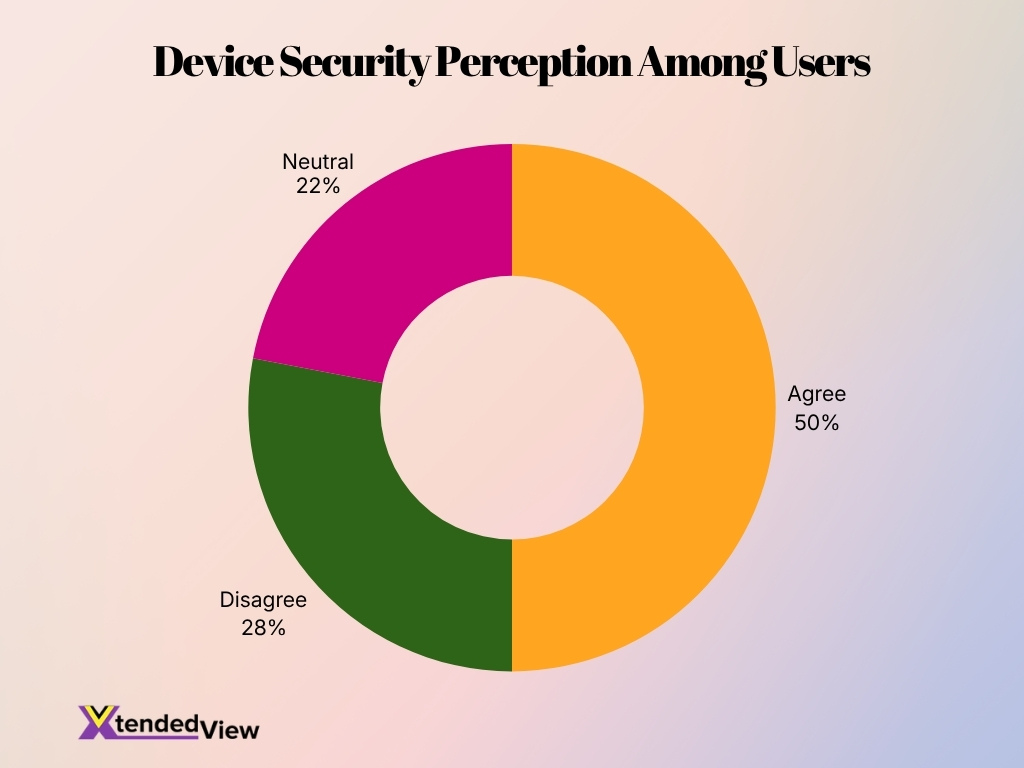
- 50% of respondents agree that their devices are automatically secure, showing that half of users trust the built-in security protections.
- 28% of respondents disagree, indicating a significant share of users remain concerned about their device security.
- 22% of respondents are neutral, suggesting uncertainty or limited awareness about how secure their devices actually are.
- The combined 50% agree versus 28% disagree result highlights a generally positive perception of automatic device security.
- Nearly 1 in 2 users (50%) believe their devices are protected without requiring additional security actions.
- The 22% neutral segment represents an opportunity for cybersecurity education and awareness initiatives.
DDoS Attack Statistics
- Global DDoS attacks hit a staggering 47.1 million in 2025, marking a 121% increase year-over-year.
- The largest recorded hyper-volumetric DDoS attack peaked at a record-breaking 31.4 Tbps in December 2025.
- Network-layer DDoS attacks skyrocketed to 34.4 million incidents, representing a massive 300% year-over-year surge.
- The financial services sector faced an alarming 245% year-over-year surge in volumetric DDoS attacks.
- Approximately 89% of modern DDoS attacks last under 10 minutes, making rapid automated mitigation critical.
- An advanced botnet utilized over 1.8 million infected devices to execute highly destructive traffic floods.
- Unmitigated DDoS downtime can cost targeted organizations an estimated average of $22,000 per minute.
- The telecommunications sector’s share of attacks nearly doubled from 11% to 21% within a six-month period.
- Peak attack speeds reached an unprecedented 14.1 billion packets per second during recent massive botnet swarms.
AI and Automation in Cybersecurity Statistics
- Organizations that extensively use AI and security automation save an average of $1.9 million per data breach compared with organizations that do not.
- Companies with mature AI-powered security programs reported average breach costs of $3.62 million, versus $5.52 million for those without extensive AI adoption.
- AI-enabled security teams reduced average breach identification times from 72 days to 51 days.
- Approximately 63% of organizations using AI technologies still lack formal AI governance policies.
- Nearly 97% of AI-related security incidents occurred in environments without adequate AI access controls.
- Around 16% of reported cyber incidents now involve AI-related attack methods or AI misuse.
- Security operations centers increasingly deploy generative AI for threat hunting, malware analysis, and incident response workflows.
- More than 70% of cybersecurity leaders expect AI to significantly reshape cyber defense operations within the next three years.
- AI-powered security analytics reduce false-positive alerts and help analysts prioritize high-risk threats more efficiently.
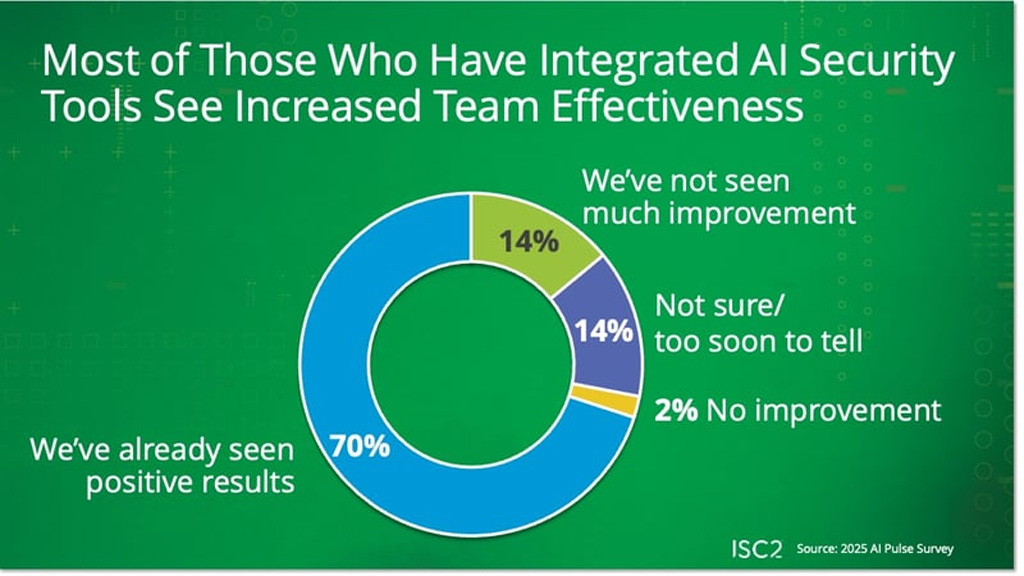
AI Security Tools Improve Team Effectiveness
- 70% of organizations that integrated AI security tools reported positive results and improved team effectiveness.
- Only 2% of respondents said AI security tools delivered no improvement in their security operations.
- About 14% reported little or no noticeable improvement after implementing AI-powered security solutions.
- Another 14% said it was too soon to tell whether AI security tools had improved team performance.
- Combined, 84% of organizations either saw positive results or remained optimistic about AI security tool adoption.
- The findings suggest that AI-driven cybersecurity technologies are becoming a key factor in enhancing security team productivity and operational efficiency.
- The survey highlights strong confidence in AI security investments, with a clear majority experiencing measurable benefits.
Healthcare Cybersecurity Statistics
- The average breach cost in healthcare reached $7.42 million in 2025, keeping it the most expensive industry.
- Over 276 million healthcare records were exposed during reported breaches in 2024, marking a record high.
- The average breach lifecycle for healthcare organizations took 279 days to successfully identify and contain.
- Approximately 67% of healthcare organizations experienced disruptive ransomware attacks throughout 2024.
- Roughly 92% of healthcare facilities reported facing at least one cyberattack during the previous year.
- Over 80% of stolen protected health information in 2025 originated from compromised third-party vendors.
- A staggering 99% of hospitals manage connected medical devices containing known exploited vulnerabilities.
- Extortion-only attacks involving patient data theft tripled to account for 12% of healthcare ransomware incidents in 2025.
- Almost 25% of healthcare providers reported an increase in patient mortality rates following a severe cyberattack.
- The total financial impact of the massive Change Healthcare ransomware breach reached $3.09 billion by late 2024.
Financial Services Cybersecurity Statistics
- The average cost of a financial services data breach reached $5.56 million in 2025.
- Financial organizations face breach costs that are $1.12 million higher than the global cross-industry average.
- Around 65% of financial institutions globally reported experiencing a ransomware attack over the past year.
- Approximately 34% of all Layer 3 and 4 DDoS attacks directly targeted the financial services sector.
- The mean recovery cost from a ransomware attack in the financial industry hit $2.58 million, excluding the ransom.
- Almost 95% of all cyberattacks targeting financial services are financially motivated by organized crime.
- Phishing attacks directed at online banking and payment institutions accounted for 30.9% of all phishing activities.
- Extreme cyber loss incidents in the global financial sector have quadrupled in size since 2017, reaching $2.5 billion.
- The involvement of shadow AI tools during a data breach added an extra $670,000 to the overall incident cost.
Education and Government Cybersecurity Statistics
- 91% of higher education institutions and 85% of colleges experienced cyber breaches in 2025.
- Roughly 82% of K-12 schools were actively impacted by malicious cyber threats between 2023 and 2024.
- Public sector entities face severe risks, with 38% reporting insufficient resilience against nation-state spying.
- Over 4,388 weekly cyberattacks targeted individual educational organizations in mid-2025, double the global average.
- Confirmed ransomware attacks hitting the education sector saw a sharp 23% increase in early 2025.
- Phishing remains dominant, with a massive 1,200% increase in attacks driven by generative AI tools.
- National funding surged with $2.926 billion allocated for federal cybersecurity operations and infrastructure modernization.
- Transitioning to a zero-trust architecture remains a top priority for 81% of public sector technology leaders.
- A critical shortage persists, as 49% of public-sector organizations lack the necessary cybersecurity personnel.
Small and Medium-Sized Business (SMB) Cybersecurity Statistics
- Approximately 43% of cyberattacks target small and medium-sized businesses.
- Nearly 60% of SMBs that experience a major cyberattack struggle to recover financially within six months.
- Many SMBs allocate less than 10% of their IT budgets to cybersecurity initiatives.
- Phishing remains the most common attack method used against SMBs.
- Ransomware attacks against SMBs continue to rise because attackers view smaller organizations as easier targets.
- More than 50% of SMBs report cybersecurity staffing limitations or a lack of dedicated security personnel.
- Cloud adoption among SMBs continues to expand, increasing the need for identity and access management controls.
- SMBs increasingly rely on managed security providers to compensate for internal resource shortages.
- Employee cybersecurity awareness training remains one of the most cost-effective security investments for smaller businesses.
Frequently Asked Questions (FAQs)
Cybercrime is estimated to cost the global economy $10.5 trillion annually, making it one of the largest economic threats worldwide.
The global average cost of a data breach is $4.44 million, down 9% from $4.88 million in 2024.
The average cost of a data breach in the United States reached a record $10.22 million in 2026.
The FBI’s Internet Crime Complaint Center received 859,532 complaints in 2024, with reported losses exceeding $16 billion.
Approximately 65% of medium-sized businesses reported experiencing a cyber breach or attack during the previous 12 months.
Conclusion
Cybersecurity risks continue to evolve as organizations expand their digital footprints, adopt AI technologies, and connect more devices to business networks. The data shows that ransomware, phishing, cloud vulnerabilities, and data breaches remain major concerns across industries, while AI-powered security tools are helping organizations reduce costs and improve response times. At the same time, workforce shortages and increasingly sophisticated threat actors continue to challenge security teams.
Organizations that invest in automation, employee training, identity security, and proactive threat detection consistently experience better outcomes than those relying on reactive defenses. As cybercrime damages move further into the trillions of dollars annually, cybersecurity will remain a strategic business priority for enterprises, governments, healthcare providers, financial institutions, and small businesses alike.