


Smart cities combine connected infrastructure, real-time data, and digital services to improve how people live, work, and move. Cities use these technologies to reduce traffic congestion, optimize energy use, strengthen public safety, and deliver faster public services. Businesses also benefit through smarter logistics, while utilities improve resource management with connected networks. Explore the statistics below to understand how investments, adoption, and innovation continue to shape smart cities.
Editor’s Choice
- The global smart cities market reached $1.63 trillion in 2025 and is forecast to grow to $5.57 trillion by 2034, reflecting sustained investment in digital urban infrastructure.
- North America accounted for more than 30.6% of the global smart city market in 2025, supported by mature digital infrastructure and municipal technology investments.
- Asia-Pacific remained one of the fastest-growing smart city regions, driven by rapid urbanization and government-backed digital transformation programs.
- The United States smart cities market reached $171.2 billion in 2025 and is projected to nearly triple by 2034.
- Smart transportation represented 37.8% of the global smart city market in 2025, making it the largest application segment.
- Artificial intelligence, IoT, cloud computing, and advanced analytics continue to accelerate investments in intelligent urban infrastructure across developed and emerging economies.
- Governments increasingly prioritize smart city programs to improve sustainability, mobility, energy efficiency, and digital public services while supporting long-term economic growth.
Recent Developments
- During 2025, governments expanded investments in AI-powered traffic management, intelligent utilities, and connected public infrastructure across major metropolitan regions.
- New smart city projects increasingly integrate AI, IoT, edge computing, and 5G instead of deploying standalone technologies.
- Municipal governments continue replacing legacy systems with cloud-based digital platforms that improve service delivery and operational efficiency.
- Transportation remains the largest investment category as cities deploy intelligent traffic signals, connected vehicles, and mobility platforms.
- Utilities increasingly deploy smart grids, digital water monitoring, and predictive maintenance systems to reduce operating costs.
- Sustainability initiatives continue driving investments in smart lighting, renewable energy integration, and digital environmental monitoring.
- Digital twins have become a growing priority for urban planning, enabling cities to simulate infrastructure projects before construction begins.
- Cities increasingly adopt integrated command centers that combine transportation, emergency response, utilities, and surveillance into a unified operational platform.
What Are Smart Cities?
- Smart cities use connected technologies, sensors, and data analytics to improve urban services and infrastructure performance.
- Modern smart city ecosystems combine IoT devices, AI, cloud platforms, and high-speed connectivity to support real-time decision-making.
- Intelligent transportation systems reduce congestion through adaptive traffic management and connected mobility services.
- Smart utility networks monitor electricity, water, and gas infrastructure continuously, improving reliability and reducing waste.
- Connected public safety systems integrate cameras, sensors, emergency communications, and analytics for faster incident response.
- Digital governance platforms enable residents to access permits, payments, reporting tools, and municipal services online.
- Environmental monitoring systems collect air quality, weather, and pollution data to support sustainability initiatives.
- Smart cities aim to improve quality of life while making urban operations more efficient, resilient, and environmentally sustainable.
Smart Cities Market Growth Statistics
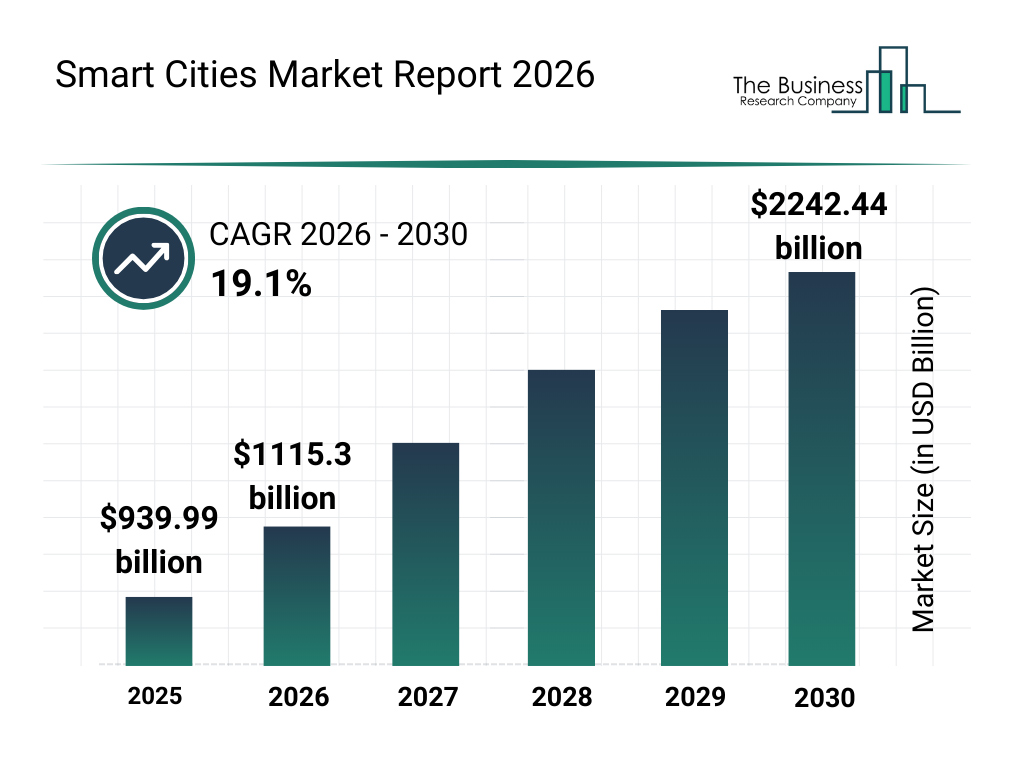
- The global smart cities market was valued at $939.99 billion in 2025, highlighting the already substantial scale of investments in smart urban infrastructure and technologies.
- In 2026, the smart cities market is expected to reach approximately $1.12 trillion, up from $939.99 billion in 2025.
- The market is projected to expand at a strong 19.1% CAGR between 2026 and 2030, indicating sustained demand for smart city technologies worldwide.
- Based on the chart’s growth trajectory, the market could rise to approximately $1.33 trillion in 2027 and $1.58 trillion in 2028.
- By 2029, the global smart cities market is estimated to approach $1.87 trillion, bringing it close to the $2 trillion milestone.
- The market is forecast to reach $2.24 trillion by 2030, more than doubling its 2026 value within just four years.
- Overall, the smart cities market is projected to add roughly $1.13 trillion in value between 2026 and 2030, reflecting rapid global investment in connected infrastructure, transportation, energy, and digital urban services.
Smart City Investment and Spending Statistics
- The global smart cities market size is projected to surge from $1.3 trillion in 2026 to $8.8 trillion by 2033.
- The intelligent transportation system sector captured the largest application market share at 29.4% in 2025.
- Global spending on IoT for smart cities alone reached a staggering $264.3 billion in 2025.
- The energy management segment accounted for a dominant 57% share of the global smart utilities market in 2025.
- The Asia Pacific region currently leads global smart city investments, holding a 51.3% revenue share in 2025.
- Approximately 68% of the global population will reside in urban areas by 2050, driving further digital infrastructure demand.
- The city surveillance segment accounted for 22% of total market revenue in 2025 to manage and protect connected municipal systems.
- Foundational hardware components like sensors and smart meters claim a leading 38.4% market share in 2026.
Smart City Population and Urbanization Trends
- Cities were home to 45% of the world’s 8.2 billion people in 2025, more than double the urban share recorded in 1950.
- The global urban population has grown from 20% in 1950 to 45% in 2025, highlighting the long-term need for smart infrastructure.
- The United Nations projects that two-thirds of global population growth through 2050 will occur in cities.
- The number of megacities (10 million+ residents) increased from 8 in 1975 to 33 in 2025.
- More than 12,000 cities with populations above 50,000 are now included in global urban datasets, reflecting broader urban coverage than previous editions.
- Asia hosts 19 of the world’s 33 megacities, making it the largest concentration of major urban centers.
- Jakarta became the world’s largest urban agglomeration in 2025 with nearly 42 million residents, followed by Dhaka and Tokyo.
- Rapid urbanization continues to increase demand for digital transportation, utilities, housing, and public services across both developed and emerging economies.
Smart City Adoption by Region
- North America held over 30.6% of the global smart city market in 2025.
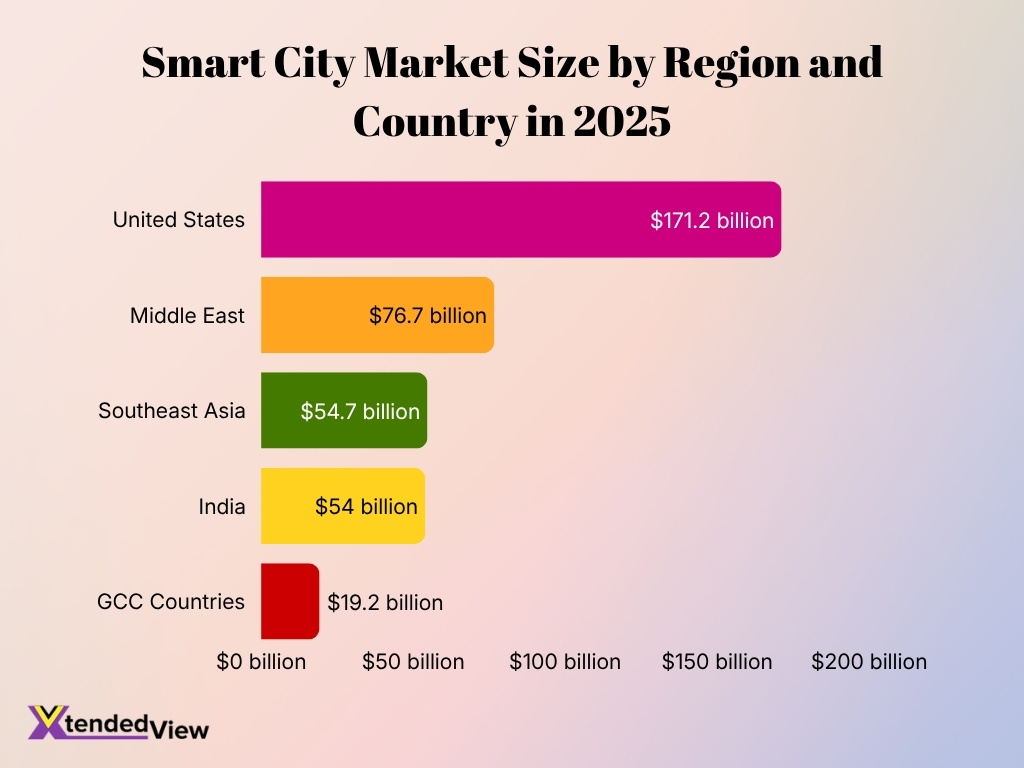
- The United States smart cities market reached $171.2 billion during 2025.
- Asia-Pacific remained the largest regional revenue contributor in several market analyses, accounting for 51.3% of revenue during 2025.
- Southeast Asia’s smart cities market reached $54.7 billion in 2025 and is forecast to reach $148.5 billion by 2034.
- The Middle East smart cities market reached $76.7 billion in 2025, supported by large-scale urban development projects.
- GCC countries recorded a smart cities market of $19.2 billion in 2025 and are projected to exceed $69 billion by 2034.
- India’s smart cities market reached $54 billion in 2025 and is projected to grow at 15.35% CAGR through 2034.
- Regional adoption continues to accelerate as governments expand digital infrastructure, sustainability initiatives, and connected public services.
Smart City Technologies and Infrastructure Statistics
- The global smart cities market was valued at $634 billion in 2024 and is projected to reach $2.74 trillion by 2034.
- Urban planning using digital twins is expected to generate global savings of $280 billion by 2030.
- The smart city hardware segment, including IoT sensors and smart meters, accounted for $274.1 billion in 2024.
- Enterprise IoT connections reached 10.7 billion globally in 2024 to support automated urban operations.
- Integrating digital twins with 500 data sources has enabled pilot cities to achieve a 30% improvement in traffic flow.
- The smart transportation sector, focusing on AI-powered traffic management, was valued at $161.3 billion in 2024.
- Global investments in digital twin technology are forecast to grow to $154 billion by 2030.
- Implementing smart energy grids and building sensors has reduced institutional energy consumption by up to 31%.
- The public safety technology segment in smart cities is projected to grow at a 19% CAGR through advanced surveillance.
IoT in Smart Cities Market Statistics
- The global IoT in Smart Cities market is projected to reach $312.2 billion by 2026 with a 19.0% compound annual growth rate.
- Integrating IoT-powered smart bins into municipal waste management led to a 42% decrease in fuel consumption for collection vehicles.
- Adaptive IoT traffic control systems have been shown to reduce average travel times by 20% to 30% in highly congested urban areas.
- Implementing IoT technology in smart commercial buildings can decrease total energy consumption by up to 30%.
- Citywide deployments of smart street lighting systems provide energy savings of up to 50% compared to traditional lighting infrastructure.
- Real-time IoT leak detection sensors have successfully reduced municipal water loss by 25% within a two-year timeframe.
- Utilizing edge AI traffic management frameworks can significantly clear pathways and achieve a 40% reduction in emergency response times.
- Smart building automation controls connected via IoT can lower overall operating expenses by 20% for municipal and property administrators.
- Optimized vehicle traffic flows using connected intersection sensors resulted in a 15% decrease in carbon dioxide emissions.
Leading Smart City Application Segments
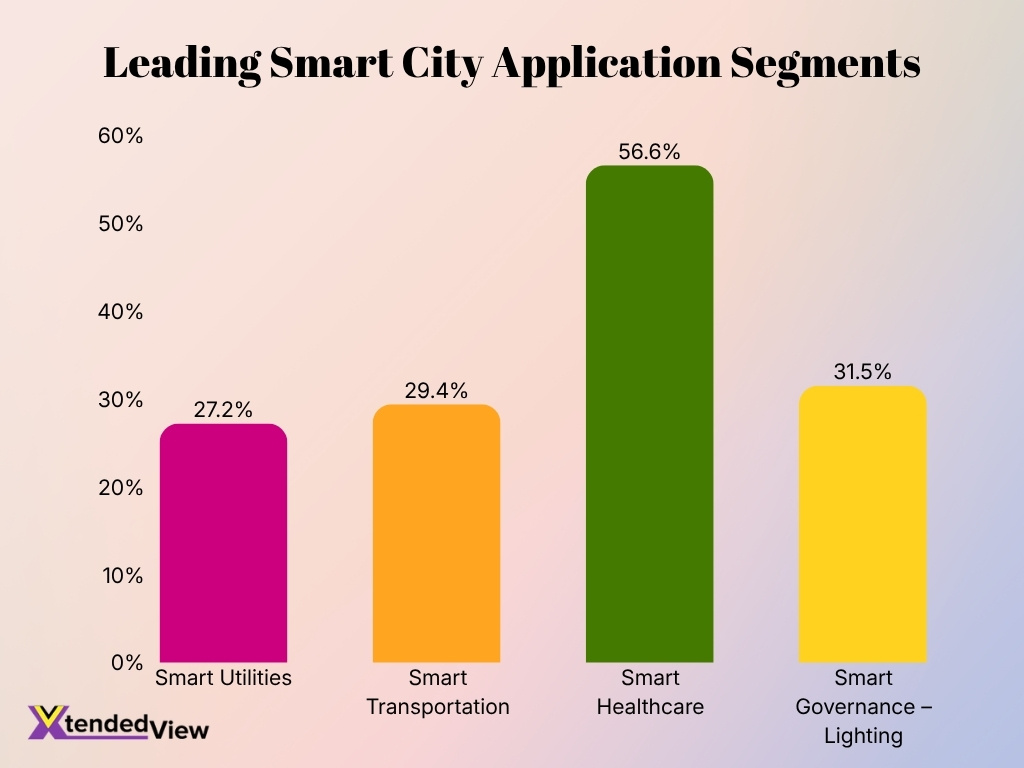
- Smart healthcare leads the application segments with a 56.6% market share, highlighting the growing role of connected healthcare systems, digital health services, and smart medical infrastructure.
- Smart governance and lighting account for 31.5% of the market, reflecting increased adoption of intelligent lighting and technology-driven public infrastructure.
- Smart transportation represents a 29.4% market share, supported by investments in intelligent traffic management, connected mobility, and modern transportation networks.
- Smart utilities hold a 27.2% share, showing significant adoption of smart technologies across energy, water, and other essential urban utility systems.
- The gap between smart healthcare and smart utilities is 29.4 percentage points, making healthcare substantially more prominent among the application segments shown.
AI and Data Analytics in Smart Cities
- The global AI in smart cities market is projected to reach $345.3 billion by 2033.
- Over 60% of cities globally are currently adopting AI technologies for urban operations.
- AI-driven surveillance systems have successfully reduced urban crime rates by up to 20%.
- Digital twin technologies allow municipalities to reduce operational costs by 15% to 25%.
- AI-powered digital twins improve municipal emergency response times by 20% to 40%.
- The AI traffic optimization market is forecast to reach approximately $164.72 billion by 2035.
- Municipalities using AI natural language tools report a 40% increase in citizen service efficiency.
- Cities leveraging AI for environmental monitoring have reduced pollution levels by 15% to 25%.
- The market for AI in urban planning is expected to reach $9.1 billion by 2033.
5G and Connectivity in Smart Cities
- The global 5G infrastructure market is projected to reach $853.72 billion by 2034 with a 48.5% compound annual growth rate.
- High-speed 5G networks can support connection densities of up to 1 million IoT devices per square kilometer in urban areas.
- Currently, over 70% of global smart city initiatives rely directly on IoT-enabled infrastructure for daily operations.
- By 2025, 5G technology is expected to power more than 50% of all IoT device connections within smart cities.
- Advanced 5G traffic systems integrated with edge AI have demonstrated a 26% reduction in urban travel time.
- Pilot programs using 5G adaptive traffic lights successfully reduced vehicle emissions by 21% and idling time by 41%.
- Real-time 5G traffic monitoring can reduce total and fatal road incidents by 13% to 36% across metropolitan networks.
- With data processing speeds up to 70 times faster than 4G, 5G networks provide instantaneous responsiveness for emergency services.
- The Enhanced Mobile Broadband segment accounted for 52.84% of the entire 5G services market share in 2025.
Smart City Rankings
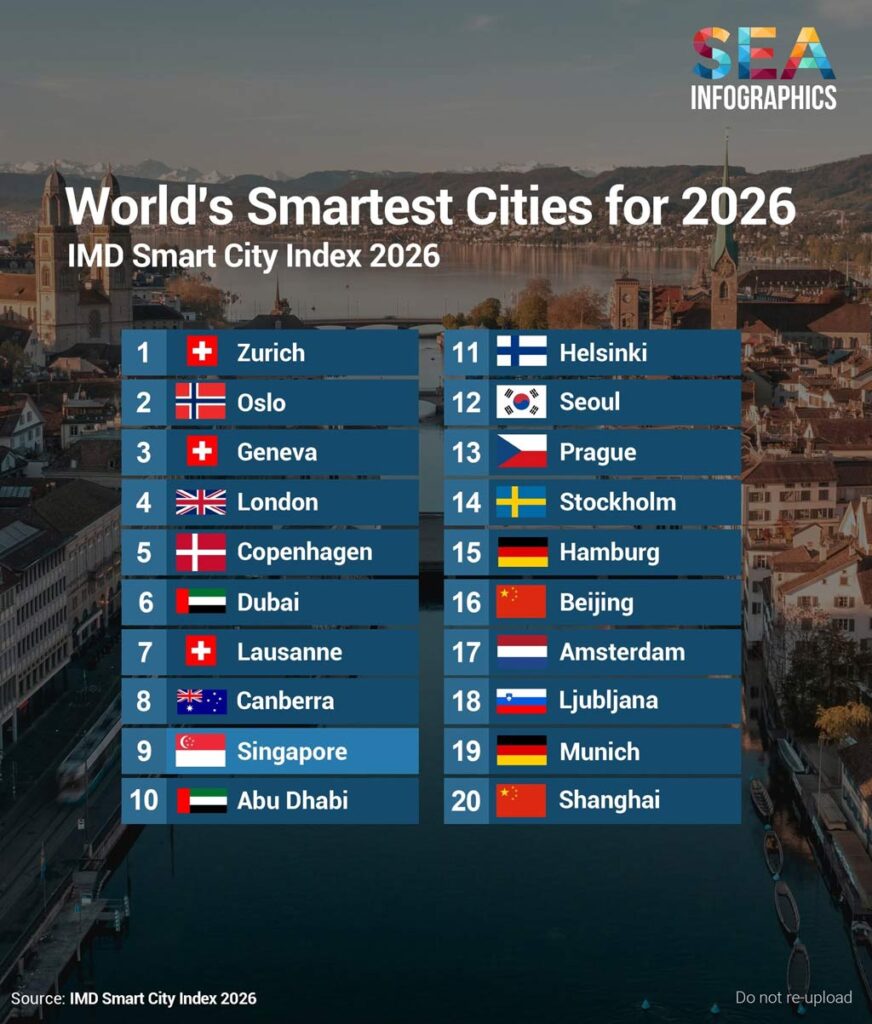
- Zurich ranks as the world’s smartest city in 2026, taking the No. 1 position in the IMD Smart City Index.
- European cities dominate the top of the ranking, with Zurich, Oslo, Geneva, London, and Copenhagen occupying all five leading positions.
- Switzerland has an especially strong presence, with three cities in the top 10: Zurich (1st), Geneva (3rd), and Lausanne (7th).
- The United Arab Emirates places two cities in the global top 10, with Dubai ranking 6th and Abu Dhabi 10th.
- Singapore ranks 9th, making it the highest-ranked Asian city in the top 10, while Seoul follows at 12th globally.
- Northern European capitals perform strongly, including Oslo (2nd), Copenhagen (5th), Helsinki (11th), and Stockholm (14th).
- Germany has two cities among the world’s top 20 smart cities, with Hamburg at 15th and Munich at 19th.
- China also has two cities in the top 20, with Beijing ranking 16th and Shanghai ranking 20th.
- Overall, the ranking shows a clear European concentration, with European cities accounting for 13 of the top 20 positions in the 2026 list.
Smart Transportation and Mobility Statistics
- The global smart transportation market is projected to reach $340.69 billion by 2032, exhibiting a 13.2% CAGR.
- AI-powered adaptive traffic signals and machine-learning algorithms can reduce urban corridor travel times by 15% to 25%.
- Unified digital ticketing on connected mobility platforms successfully shifts 10% to 15% of private-car trips to shared transit modes.
- Drivers actively searching for parking spaces are responsible for approximately 30% of total traffic congestion within crowded cities.
- Implementing smart parking software decreases the amount of time drivers spend searching for an available spot by an estimated 64% per vehicle.
- Cloud-based services captured 41.30% of the smart transportation market in 2025 to support scalable, real-time data processing.
- Dedicated highway corridors utilizing V2X infrastructure and autonomous platooning can boost freight throughput by 30% to 40%.
- Municipal deployments of AI-optimized signal networks are projected to cut overall urban transport emissions by 8% to 12% by 2035.
Smart Energy and Utilities Statistics
- Global smart grid modernization investments are propelling the market size to a projected $161.15 billion by 2029.
- Utility providers globally have already installed over 1.06 billion smart meters to precisely track and manage consumption.
- Implementing predictive maintenance can reduce utility equipment breakdowns by 70% and cut unexpected downtime by 35% to 45%.
- AI-driven smart water systems can achieve up to 98.4% accuracy in detecting leaks and minimizing non-revenue water loss.
- Grid modernization and renewable integration require massive capital, exceeding $470 billion in annual global investments.
- Intelligent smart street lighting infrastructure can reduce municipal energy consumption by 50% to 70%.
- AI-powered load forecasting models improve demand prediction accuracy by up to 30% over traditional statistical methods.
- Optimized utility infrastructure must efficiently manage an extraordinary 3,500 terawatt-hours of incremental electricity demand over the next three years.
Smart Waste Management Statistics
- More than 66 smart cities use technology-enabled systems to improve waste management operations.
- Around 9,194 collection vehicles use RFID and GPS to digitize waste monitoring.
- All 100 Smart Cities use Integrated Command and Control Centres for waste tracking.
- The global smart waste management market is projected to reach $6.52 billion by 2026.
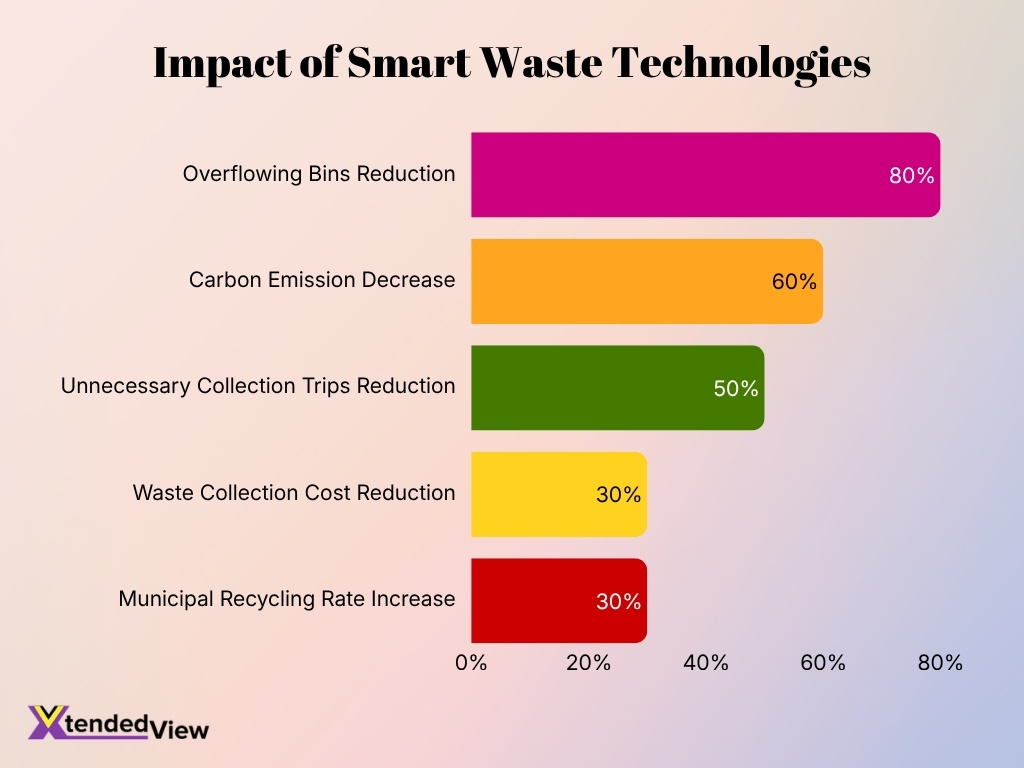
- IoT-enabled smart bins reduce municipal waste collection costs by up to 30%.
- Optimized GPS routing decreases carbon emissions from collection fleets by up to 60%.
- Real-time sensor monitoring reduces instances of overflowing waste bins by up to 80%.
- Cities using predictive analytics report a 50% reduction in unnecessary collection trips.
- Smart infrastructure implementation successfully increases municipal recycling rates by 20% to 30%.
Smart Buildings and Real Estate Statistics
- Buildings account for nearly 40% of global end-use energy consumption.
- Smart building automation systems can reduce HVAC energy consumption by 15% to 30%.
- Predictive maintenance in smart buildings can reduce overall maintenance costs by up to 33%.
- Predictive maintenance technologies can also cut unplanned equipment downtime by up to 75%.
- The global digital twin market size is projected to grow to $384.79 billion by 2034.
- The global smart office market is estimated to reach approximately $142 billion by 2035.
- Smart lighting control systems enable savings of 35% to 40% of electricity consumed by lighting.
- Utilizing a building energy management system can reduce total energy use by 10% to 25%.
- Smart water flow monitoring devices can reduce overall building water consumption by an average of 10%.
- The digital twin real estate market is projected to achieve a compound annual growth rate of 29.30%.
Public Safety and Security in Smart Cities
- More than 84,000 CCTV cameras actively monitor 100 smart cities for crime surveillance.
- Exactly 1,884 emergency call boxes are installed to improve rapid response capabilities.
- Around 3,000 public address systems currently support efficient disaster communication.
- All 100 Integrated Command and Control Centres provide real-time security monitoring.
- Intelligent traffic enforcement has reduced fatal traffic accidents by up to 10 percent.
- AI-powered predictive analytics can decrease emergency response times by 20 to 35 percent.
- Smart public safety technologies reduce overall city crime rates by 30 to 40 percent.
- Automated number plate recognition tracks violations across more than 70 percent of urban zones.
Environmental and Sustainability Impact
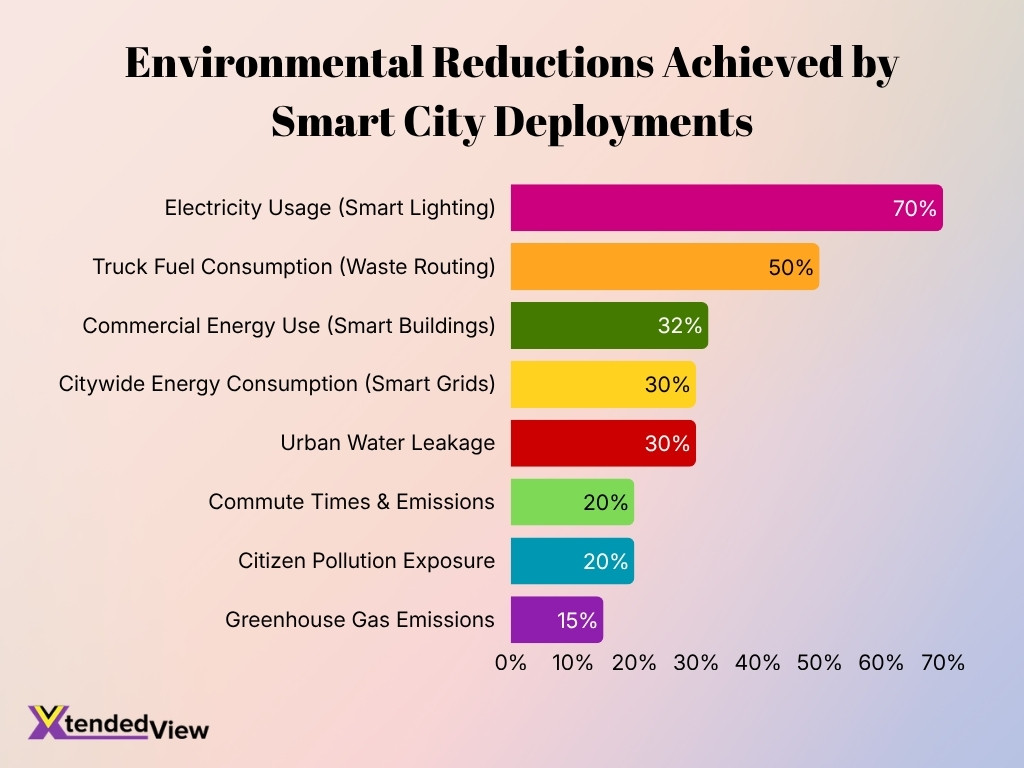
- Smart city deployments can reduce greenhouse gas emissions by 10% to 15% globally.
- Upgrading to smart street lighting cuts municipal electricity usage by 50% to 70%.
- Intelligent water management systems reduce urban water leakage by up to 30%.
- AI-driven traffic optimization lowers vehicle commute times and emissions by 20%.
- Smart waste collection routing decreases truck fuel consumption by 40% to 50%.
- Commercial spaces using smart building technology lower their energy use by 32%.
- Integrating smart grids decreases overall citywide energy consumption by 30%.
- Urban areas currently account for 70% of all global carbon emissions.
- IoT sensor networks help cities reduce citizen pollution exposure by 10% to 20%.
E-Governance and Digital Services Statistics
- All 100 Smart Cities utilize Integrated Command and Control Centres for data-driven governance and real-time municipal decisions.
- Over 94% of the 8,067 Smart Cities Mission projects were completed by 2025 with an investment of ₹1.64 lakh crore.
- Nearly 99.44% of the budgeted outlay for the mission had been released to cities by March 2025.
- The UMANG platform has registered over 11.66 crore users and processed approximately 798 crore digital transactions over three years.
- As of July 2026, UMANG hosts 2,575 e-governance services, including 880 central and 1,695 state digital offerings.
- DigiLocker has surpassed 72.43 crore registered users and handled 72.86 crore document access transactions for secure records.
- A network of 4,07,122 Common Service Centres currently operates at the Gram Panchayat level to boost rural e-governance access.
- Over 84,000 CCTV cameras and 1,740 km of smart roads have been developed to improve public safety and urban mobility.
- Women Village Level Entrepreneurs currently operate 70,069 Common Service Centres, promoting digital literacy and inclusive growth.
Frequently Asked Questions (FAQs)
The global smart city market is projected to grow at a 14.16% CAGR between 2026 and 2034.
The global smart city market is forecast to reach USD 5.57 trillion by 2034.
Cities were home to 45% of the global population, or about 8.2 billion people, in 2025.
The United Nations identified 33 megacities with populations exceeding 10 million residents in 2025.
19 of the world’s 33 megacities, or about 58%, are located in Asia as of 2025.
Conclusion
Smart cities continue to evolve through advances in artificial intelligence, IoT, high-speed connectivity, and data-driven governance. The latest statistics highlight strong investments in intelligent infrastructure, transportation, utilities, public safety, and sustainability. As urban populations continue to grow, governments and businesses are expanding smart city initiatives to improve quality of life, strengthen resilience, and deliver more efficient public services. These trends indicate that smart cities will remain central to sustainable urban development in the years ahead.
