
The supply chain industry sits at the center of global commerce, connecting manufacturers, suppliers, logistics providers, retailers, and consumers. From ensuring hospitals receive critical medical supplies to helping e-commerce companies deliver next-day orders, supply chains influence nearly every industry. As companies invest in automation, AI, logistics infrastructure, and risk management, the sector continues to evolve rapidly. Explore the latest supply chain industry statistics to understand the trends shaping business operations worldwide.
Editor’s Choice
- The global supply chain management market reached approximately $29.34 billion in 2025 and is projected to exceed $72.82 billion by 2034, growing at a CAGR of 10.4%.
- The supply chain management software market is forecast to grow from $38.51 billion in 2025 to $58.42 billion by 2030.
- The global logistics market surpassed $11.23 trillion in 2025 and is expected to reach $12.68 trillion in 2026.
- U.S. business logistics costs climbed to approximately $2.58 trillion in 2025, representing 8.8% of GDP.
- Around 80% of supply chain professionals plan to increase investment in analytics and visibility tools over the next two years.
- Ocean freight continues to dominate global trade, accounting for roughly 70% of logistics market activity worldwide.
- New tariffs and trade policies affected approximately 30% of global supply chain activities in 2025, forcing organizations to rethink sourcing strategies.
Recent Developments
- Global transportation and logistics output expanded by an estimated 2.5% during 2025 despite geopolitical and trade challenges.
- Industry forecasts suggest logistics output will grow another 2.4% in 2026.
- The semiconductor industry is projected to exceed $1 trillion in revenue during 2026, creating additional pressure on global supply chains.
- Semiconductor sales reached $791.7 billion in 2025, up 25.6% year over year.
- Approximately 95% of supply chain executives identified tariffs as the largest supply chain disruptor during 2025.
- Cyberattacks targeting logistics companies have increased by more than 47% since 2020.
- About 60% of supply chain professionals now prioritize cybersecurity investments to protect operational networks.
- Nearly 22% of procurement leaders reported shipping cost increases exceeding 10% by the end of 2025.
- Major supply chain operators accelerated AI deployment in forecasting, transportation planning, and warehouse automation throughout 2025 and early 2026.
Global Supply Chain Industry Statistics: Market Size and Growth
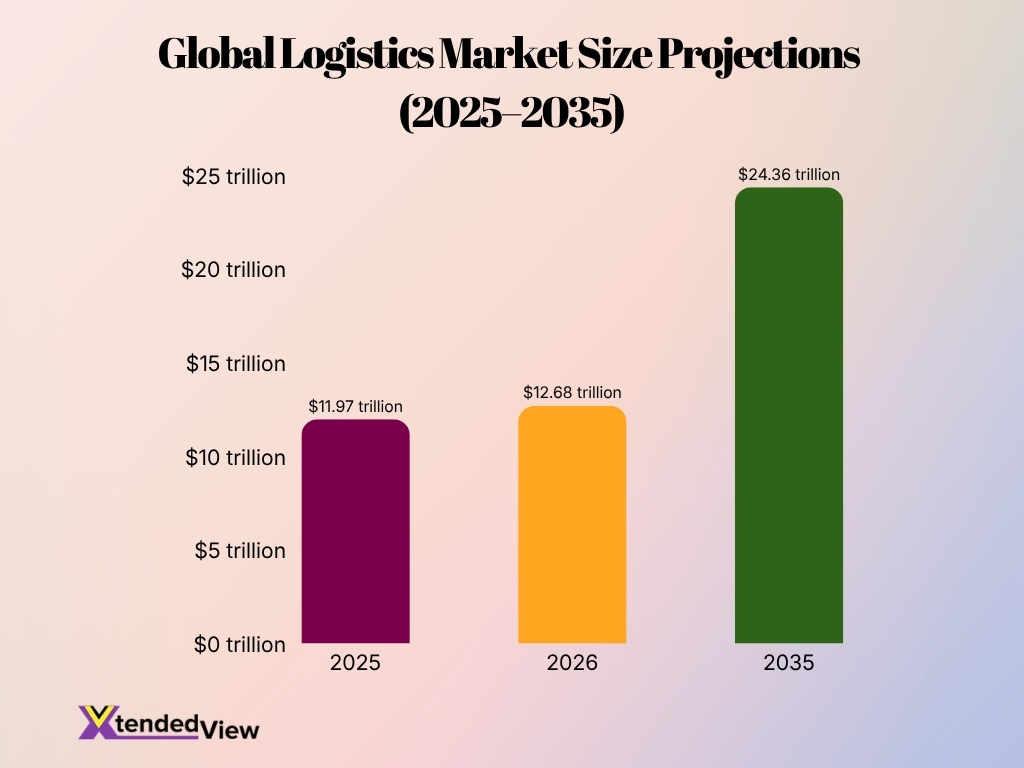
- The global logistics market was valued at approximately $11.97 trillion in 2025.
- Industry forecasts place the logistics market at $12.68 trillion in 2026.
- By 2035, the logistics industry could surpass $24.36 trillion globally.
- The supply chain management market is expected to grow at a 10.4% CAGR through 2034.
- Another industry forecast values the SCM market at $98 billion by 2035, reflecting strong enterprise software demand.
- Asia-Pacific accounted for 44.6% of the global logistics market share in 2024, maintaining leadership entering 2026.
- The logistics sector is expected to expand at a CAGR of 8.05% between 2026 and 2035.
- Third-party logistics providers controlled 56.3% of logistics market revenue in 2025.
- Road transportation represented 59.2% of global transportation demand in 2025.
- E-commerce growth remains one of the largest contributors to logistics market expansion through 2030 and beyond.
Financial Performance and Cost Supply Chain Industry Statistics
- U.S. logistics costs reached $2.58 trillion in 2025, the highest level on record.
- Logistics spending accounted for approximately 8.8% of U.S. GDP in 2025.
- Around 22% of procurement professionals reported shipping-cost increases exceeding 10% during late 2025.
- Shipping rates from Asia to the U.S. West Coast increased nearly 30% within a few weeks in 2025.
- Transportation and logistics output in China is forecast to grow 3.3% during 2026.
- The U.S. logistics sector is expected to rebound by approximately 1% in 2026 following a weaker 2025.
- Global trade uncertainty continues to increase inventory carrying costs and transportation expenses across major industries.
- Green logistics investments are expected to support a market worth $1.4 trillion in 2025.
- The green logistics sector is forecast to grow at a 9.5% CAGR through 2035.
Warehousing and Inventory Supply Chain Industry Statistics
- The global warehousing market is projected to reach an estimated $1.6 trillion in 2026.
- Major warehouse leasing activity increased by 15% to reach 19.3 million square feet in Q1 2026.
- More than 4 million warehouse robots are expected to be deployed globally by the end of 2026.
- Implementing automated warehouse solutions can successfully reduce labor costs by 25% to 30%.
- The cloud-based supply chain segment is projected to dominate with a 64.23% market share in 2026.
- Manufacturing and 3PL operators captured the largest share of leasing demand at 48% and 33%, respectively.
- Demand for cold-chain logistics remains extremely robust, with the market currently valued at $447.5 billion.
- The supply chain management software market is rapidly growing and projected to hit $32.9 billion in 2026.
- Advancements in operations will drive the deployment of over 50,000 active robotic warehouses worldwide by 2026.
Logistics Transportation Mode Market Share Statistics
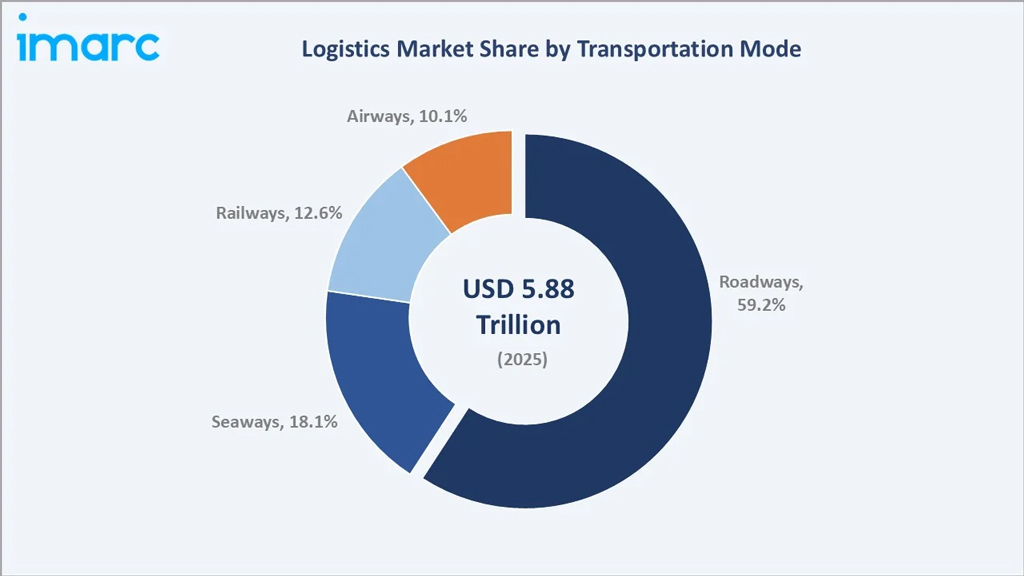
- Roadways dominated the logistics market with a 59.2% share, making them the largest transportation mode in 2025.
- Seaways accounted for 18.1% of the global logistics market, ranking as the second-largest transportation mode.
- Railways held a 12.6% market share, highlighting their important role in freight transportation.
- Airways represented 10.1% of the logistics market, reflecting their focus on high-value and time-sensitive shipments.
- The global logistics market was valued at $5.88 trillion in 2025, with road transport capturing the majority of the market.
Procurement and Sourcing Supply Chain Industry Statistics
- Around 65% of procurement leaders increased supplier diversification efforts in 2025 to reduce dependency risks.
- Approximately 72% of organizations now prioritize multi-sourcing strategies over single sourcing models.
- Supplier risk management investments grew by over 40% between 2023 and 2025.
- Nearly 50% of procurement teams reported delays caused by supplier disruptions in 2025.
- Direct procurement costs increased by 8–12% across manufacturing sectors in 2025.
- About 60% of companies adopted digital procurement platforms by early 2026.
- Ethical sourcing initiatives expanded, with over 55% of firms implementing supplier sustainability audits.
- Small and mid-sized enterprises reported a 25% increase in procurement outsourcing.
- Nearshoring adoption rose by about 20% year over year in 2025, especially in North America.
E-commerce and Fulfillment Supply Chain Statistics
- Global e-commerce sales reached approximately $6.3 trillion in 2025, driving fulfillment demand.
- Same-day and next-day delivery expectations increased, with over 65% of consumers expecting fast delivery options.
- Last-mile delivery accounts for nearly 53% of total shipping costs.
- Reverse logistics costs grew to represent 20–30% of total logistics costs.
- Over 70% of warehouses now support omnichannel fulfillment capabilities.
- U.S. e-commerce penetration reached about 22% of total retail sales in 2025.
- Automated fulfillment centers improved order processing speed by up to 40%.
- Around 45% of retailers invested in micro-fulfillment centers.
- Cross-border e-commerce logistics demand grew by over 25% year over year in 2025.
End-to-End Digital Integration in Supply Chain vs. Service Chain
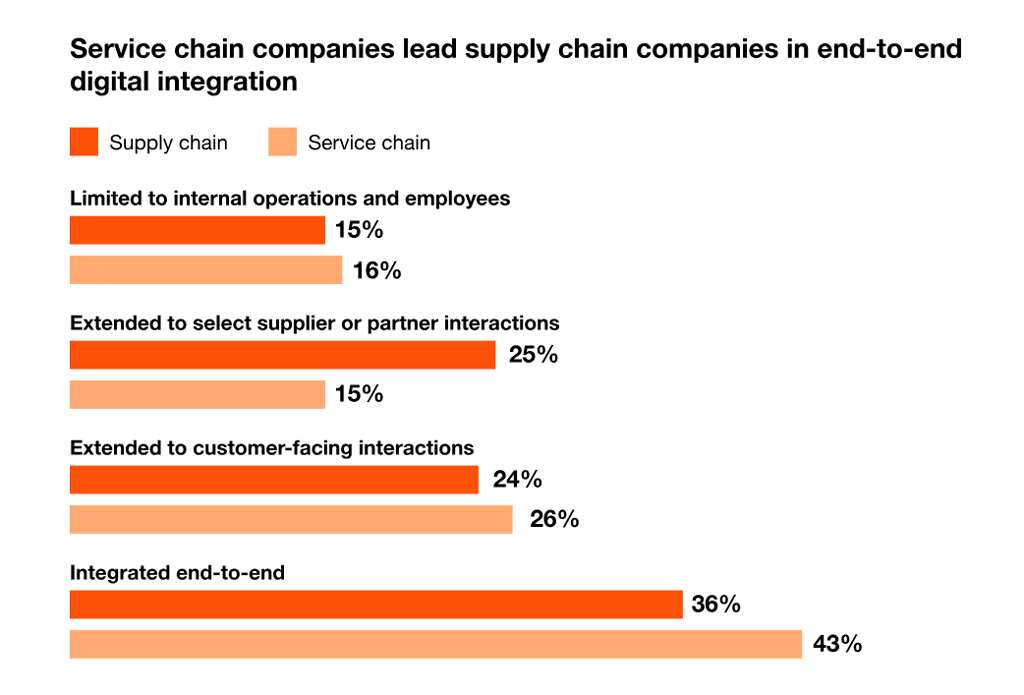
- Service chain companies lead in end-to-end digital integration, with 43% reporting fully integrated operations compared to 36% of supply chain companies.
- 36% of supply chain companies have achieved integrated end-to-end digital operations, trailing service chain companies by 7 percentage points.
- 26% of service chain companies have extended digital integration to customer-facing interactions, slightly ahead of 24% for supply chain companies.
- 25% of supply chain companies have expanded digital integration to supplier or partner interactions, compared to just 15% of service chain companies.
- Only 15% of supply chain companies remain limited to internal operations and employees, nearly matching 16% of service chain companies.
- The largest adoption gap appears in integrated end-to-end operations, where service chain companies outperform supply chain companies by 7 percentage points.
- Supply chain companies show a stronger focus on supplier and partner connectivity, while service chain companies prioritize customer-facing and end-to-end digital integration.
- Overall, the data suggests that service chain companies are further ahead in delivering comprehensive digital integration across their operations.
Supply Chain Statistics on Technology and Automation
- Approximately 80% of supply chain organizations plan to increase spending on automation technologies by 2026.
- Warehouse automation adoption grew by over 30% globally.
- Robotics usage improved productivity by 25–35%.
- Around 50% of supply chain tasks could be automated.
- Autonomous mobile robot deployments increased by over 45% in 2025.
- Digital twin adoption increased by about 35%.
- Over 60% of enterprises implemented cloud-based supply chain platforms.
- IoT-enabled solutions improved asset tracking accuracy by up to 95%.
- Companies using automation reported cost reductions of 10–20%.
Supply Chain Statistics: Disruptions and Risk Management
- Approximately 76% of companies experienced disruptions in 2025.
- Companies now face one major disruption every 3.7 years on average.
- Disruptions can reduce profits by up to 45% over a decade.
- Around 60% of organizations increased resilience investments.
- Cybersecurity incidents have risen by over 40% since 2020.
- Nearly 50% of executives rank geopolitical risks as top threats.
- Inventory buffering strategies increased by 30% globally.
- About 35% of companies are shifting toward regional supply chains.
- Risk management software adoption grew by 28% in 2025.
AI and Data Analytics Supply Chain Industry Statistics
- The AI in the supply chain market is expected to reach $41.23 billion by 2030.
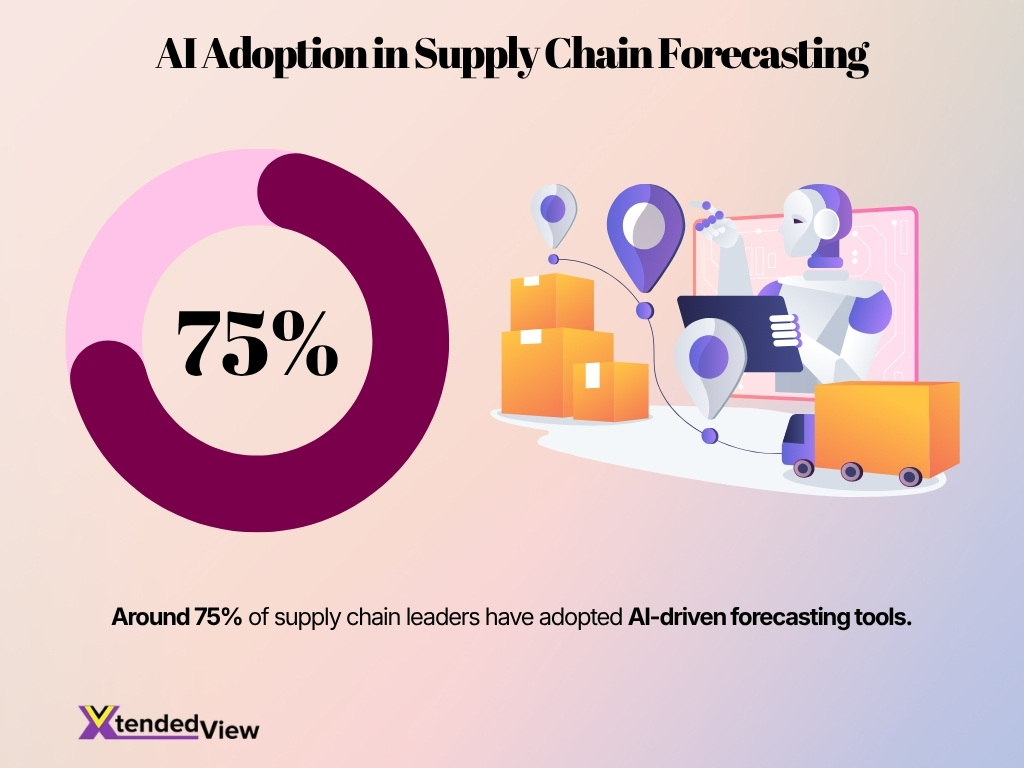
- Around 75% of supply chain leaders have adopted AI-driven forecasting tools.
- AI-powered forecasting improved accuracy by 20–50%.
- Predictive analytics reduced inventory costs by up to 15%.
- Real-time visibility increased decision-making speed by over 30%.
- About 68% of organizations plan to increase analytics investment.
- AI-enabled route optimization reduced transportation costs by 10–15%.
- Machine learning reduced stockouts by up to 35%.
- Data-driven supply chains achieved 5–10% higher service levels.
Labor and Workforce Supply Chain Statistics
- The global logistics workforce shortage reached over 2 million workers in 2025.
- U.S. truck driver shortages exceeded 80,000 drivers.
- Around 62% of logistics companies reported hiring difficulties.
- Warehouse labor costs increased by over 10% in 2025.
- Automation aims to offset up to 30% of labor shortages.
- Turnover rates remain high at 20–25% annually.
- Training investments increased by over 35%.
- Gig economy participation grew by over 18% year over year.
- Nearly 45% of companies offer reskilling programs.
Manufacturing Supply Chain Statistics
- Global manufacturing output is projected to grow by 3.9% in 2026.
- Manufacturing contributes nearly 16% of global GDP.
- Around 70% of manufacturers increased digitization efforts.
- Smart factory adoption is expected to reach $620 billion.
- Approximately 55% of manufacturers are investing in reshoring.
- Disruptions caused delays for over 60% of manufacturers.
- Industrial IoT improved efficiency by up to 30%.
- Inventory carrying costs increased by 8–10% in 2025.
- Digital twins reduced downtime by up to 25%.
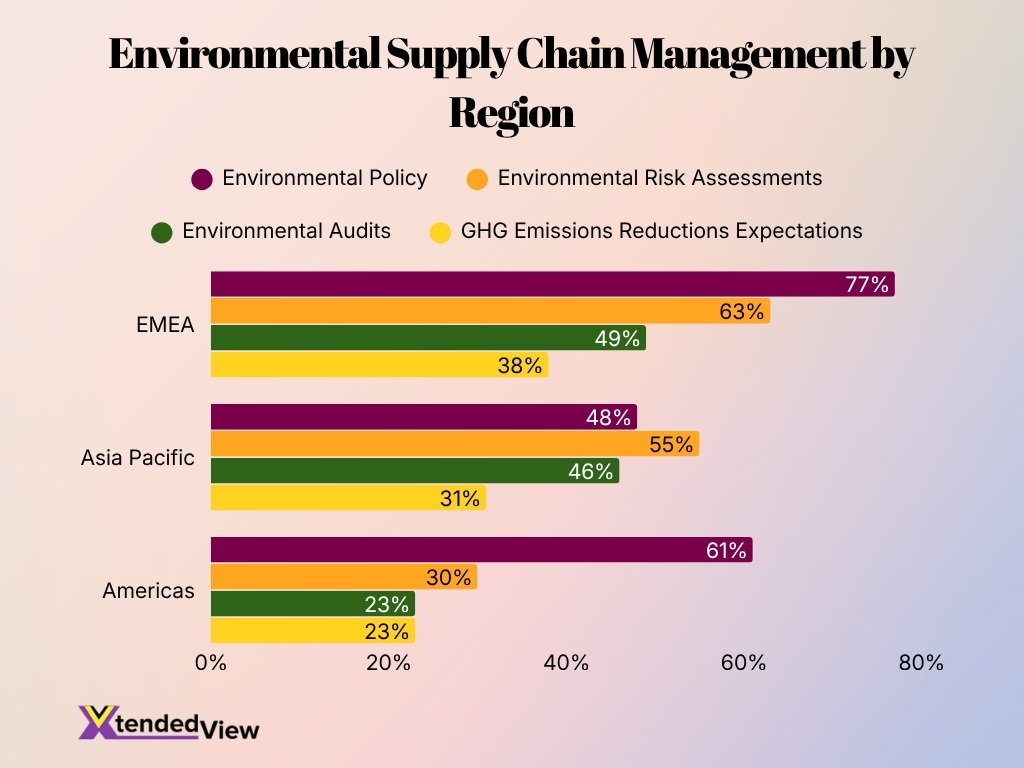
Environmental Supply Chain Management Statistics by Region
- EMEA leads in Environmental Policy adoption (77%), the highest among all regions.
- EMEA also records the highest Environmental Risk Assessments (63%) disclosure rate.
- Asia Pacific ranks first in Environmental Risk Assessments, with 55% of companies reporting this practice.
- Environmental Audits are most common in EMEA (49%), followed closely by Asia Pacific (46%).
- Americas reports 61% adoption of Environmental Policies, second only to EMEA.
- GHG Emissions Reduction Expectations are highest in EMEA (38%), compared to 31% in the Asia Pacific.
- The Americas has the lowest Environmental Risk Assessments (30%) among the three regions.
- Environmental Audits and GHG Emissions Reduction Expectations are both 23% in the Americas.
- Asia Pacific outperforms the Americas in Environmental Audits (46% vs. 23%).
- Overall, EMEA demonstrates the strongest environmental supply chain management practices across most disclosure categories.
Inventory Management Statistics
- Businesses increased safety stock levels by 20–30%.
- Inventory distortion costs retailers nearly $1.8 trillion annually.
- Approximately 43% of small businesses struggle with tracking.
- Automated systems improved accuracy to over 95%.
- Real-time visibility reduced stockouts by up to 35%.
- Around 60% of companies implemented optimization tools.
- Inventory turnover improved by 10–15%.
- Dead stock accounts for 20–30% of inventory.
- Cloud-based platforms adoption grew by over 40%.
Regional Supply Chain Statistics
- Asia-Pacific accounts for over 44% of the global logistics market.
- North America represents approximately 25% of global activity.
- Europe contributes roughly 20% of logistics revenue.
- Latin America is growing at a 6–7% CAGR.
- Africa is expanding at over 7% CAGR.
- U.S. ports handled more than 2.3 billion metric tons of cargo.
- China accounts for over 14% of global exports.
- India’s logistics market is expected to reach $380 billion by 2026.
- Cross-border trade volumes increased by over 5% globally.
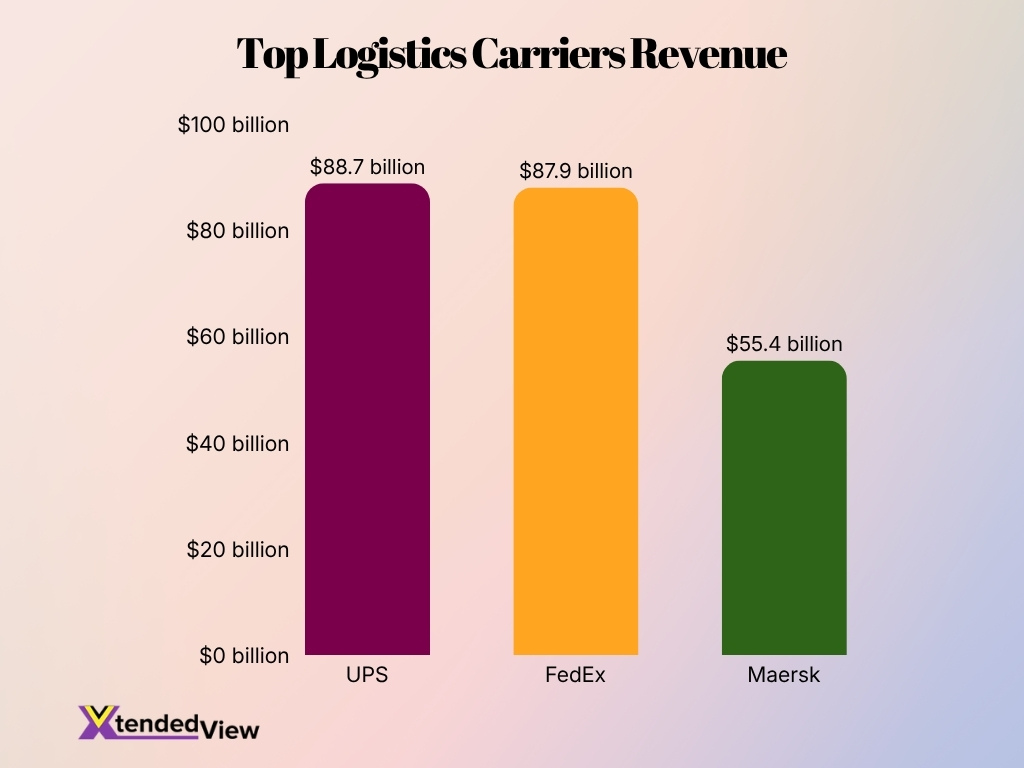
Leading Supply Chain Companies Statistics
- The top 10 logistics companies generated over $600 billion in revenue in 2025.
- Amazon delivered more than 13 billion items globally at rapid speeds in 2025.
- UPS achieved a total consolidated revenue of $88.7 billion during the year 2025.
- FedEx reported comprehensive annual corporate revenues of $87.9 billion for 2025.
- DHL operates an extensive global logistics network spanning over 220 countries and territories.
- Maersk generated $55.4 billion in total revenue from its global shipping operations in 2024.
- Walmart manages a massive global supply chain supporting over 10,000 retail stores worldwide.
Future Outlook for the Supply Chain Industry
- The market is projected to surpass $72 billion by 2034.
- AI adoption will grow at over 20% CAGR.
- Around 85% of companies plan digital transformation investments.
- Blockchain adoption is expected to grow by over 50% annually.
- Autonomous delivery could reach $18 billion by 2030.
- Resilience strategies may reduce costs by up to 30%.
- Nearshoring will continue expanding globally.
- Sustainability investments will grow at double-digit rates.
- Digital supply chains will improve service levels by 10–15%.
Frequently Asked Questions (FAQs)
The global supply chain management market is projected to reach $72.82 billion by 2034, up from $29.34 billion in 2025, growing at a 10.4% CAGR.
The global logistics market is expected to reach $12.68 trillion in 2026, compared with $11.23 trillion in 2025.
Approximately 80% of supply chain professionals plan to increase investments in supply chain analytics and visibility tools over the next two years.
U.S. business logistics costs reached $2.58 trillion, accounting for 8.8% of U.S. GDP in 2025.
The Asia-Pacific region held 44.6% of the global logistics market share in 2024 and remains the largest regional logistics market entering 2026.
Conclusion
The supply chain industry continues to evolve as businesses respond to shifting consumer demands, geopolitical uncertainty, and rapid technological advancements. Data shows a clear shift toward automation, AI-driven decision-making, and regional diversification strategies. At the same time, rising costs, workforce shortages, and sustainability pressures are reshaping operational priorities.
Looking ahead, companies that invest in resilience, visibility, and digital transformation will gain a competitive edge. As supply chains become more connected and data-driven, their role will expand beyond logistics to become a core driver of business performance and growth.