
Cloud kitchens have reshaped the restaurant industry by allowing brands to serve customers without operating dine-in locations. This model helps food businesses expand faster, reduce overhead costs, and meet growing demand for app-based food delivery. From national restaurant chains launching virtual brands to local entrepreneurs testing new cuisines with minimal investment, cloud kitchens now play a major role in the food service economy. The statistics below highlight the scale, growth, and consumer adoption trends driving the cloud kitchen market.
Editor’s Choice
- The global cloud kitchen market is expected to reach approximately $88.7 billion in 2026, up from about $80.3 billion in 2025.
- Industry forecasts suggest the market could surpass $203 billion by 2033, reflecting sustained demand for delivery-first restaurant models.
- Another industry estimate values the cloud kitchen sector at $83.5 billion in 2026, with growth toward $175.1 billion by 2034.
- The broader online food delivery market is projected to generate $350.6 billion in 2026 globally.
- Cloud kitchen operators benefit from significantly lower startup costs than traditional restaurants because they eliminate dining space and front-of-house expenses.
- Market forecasts place cloud kitchen CAGR between 9% and 15% through the next decade, depending on region and business model.
- Asia-Pacific remains the largest cloud kitchen growth region due to urbanization, smartphone adoption, and rising online food ordering activity.
Recent Developments
- In 2026, the cloud kitchen market is projected to add more than $8 billion in annual market value compared with 2025.
- Industry reports show increased adoption of AI-powered menu optimization and demand forecasting tools among cloud kitchen operators.
- Shared-kitchen and multi-brand formats continue to expand as operators seek higher asset utilization rates.
- Venture-backed operators increasingly focus on profitability rather than rapid geographic expansion.
- The cloud kitchen market is forecast to grow by nearly $97 billion between 2024 and 2029 under some industry projections.
- AI-based routing and delivery optimization platforms are helping operators reduce delayed deliveries and improve customer satisfaction.
- Industry studies in 2026 found that approximately 15% of online food businesses in England operate as dark kitchens.
- Regulatory scrutiny has increased around transparency, food safety, and labeling requirements for delivery-only restaurants.
- Major delivery ecosystems continue investing in logistics technology to shorten delivery times and increase order volumes.
General Cloud Kitchen Industry Statistics
- The cloud kitchen industry grew from an estimated $74.2 billion in 2025 to much higher projected levels over the coming decade.
- Industry forecasts commonly place annual growth above 10% CAGR, outperforming many traditional restaurant segments.
- Rising smartphone penetration remains one of the strongest demand drivers for delivery-only food businesses.
- Urban consumers increasingly prefer convenience-based meal ordering over restaurant visits.
- Cloud kitchens allow operators to launch multiple brands from a single facility, improving kitchen utilization.
- Delivery-only kitchens typically require less real estate investment than full-service restaurants.
- Food delivery platform growth continues to create new customer acquisition channels for cloud kitchen operators.
- Younger consumers remain the most active users of app-based food ordering services.
- Cloud kitchens are increasingly used by established restaurant chains to test new concepts with lower operational risk.
Global Cloud Kitchen Market Size and Growth Statistics
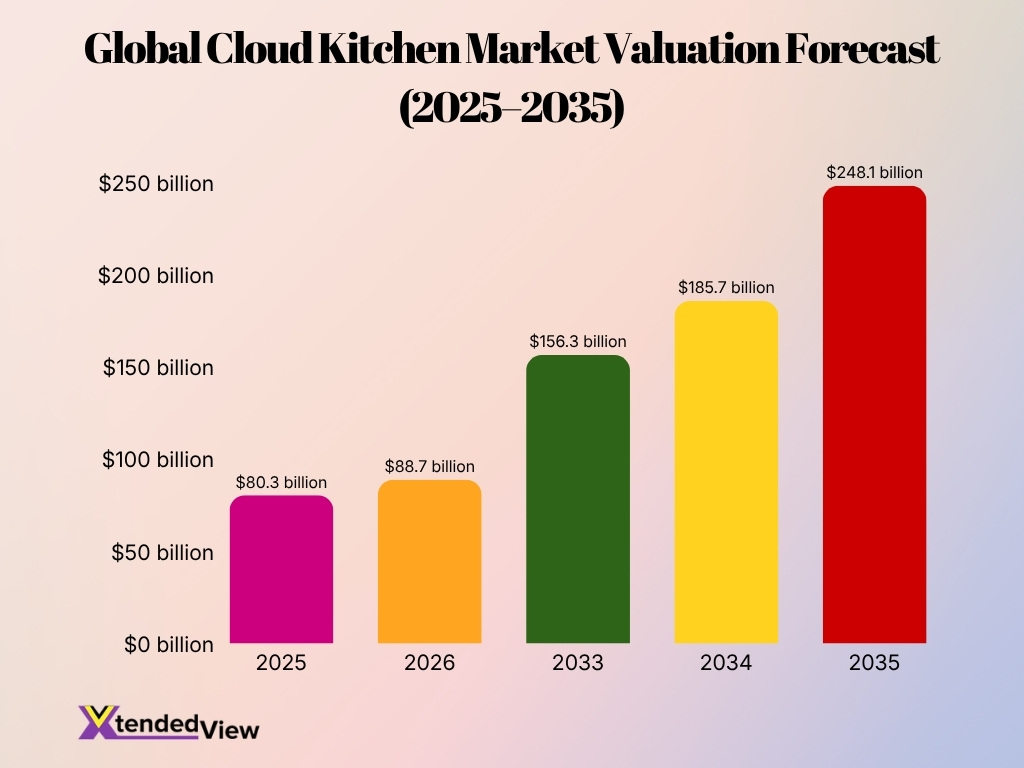
- The global cloud kitchen market was valued at approximately $80.3 billion in 2025.
- Market value is forecast to reach roughly $88.7 billion in 2026.
- Another forecast estimates the 2026 market at $83.1 billion.
- Industry projections suggest a market value of $156.3 billion by 2033.
- Some forecasts predict the sector will surpass $185.7 billion by 2034.
- Long-range estimates place the market near $248.1 billion by 2035.
- Growth rates across major studies range from 9.0% to 12.8% CAGR.
- The market is expected to add over $100 billion in new value during the next decade under multiple forecasts.
- Asia-Pacific currently accounts for the largest share of global cloud kitchen activity due to population density and delivery adoption.
Cloud Kitchen Revenue and Profit Margin Statistics
- Cloud kitchens can reduce operating costs by 30% to 50% compared to standard brick-and-mortar restaurants.
- Well-managed cloud kitchens frequently achieve strong gross profit margins ranging from 40% to 60%.
- Optimized delivery-only models easily exceed the typical 3% to 10% net margins seen in full-service dining.
- Third-party delivery commissions remain a significant drain by consuming 15% to 35% of the total order value.
- Sharing staff and facilities in multi-brand kitchens can boost revenue per square foot by up to 40%.
- Shifting customers to direct ordering channels typically improves overall net margins by roughly 20% to 30%.
- Establishing strong loyalty programs can successfully increase a kitchen’s customer lifetime value by over 25%.
- Data-driven menu engineering and optimal pricing strategies can directly increase total profitability by 10% to 15%.
Cloud Kitchen Operational Costs and Expense Statistics
- Real estate expenses for cloud kitchens are typically 40% to 60% lower than those of traditional restaurants.
- By eliminating front-of-house staff, operators can reduce total labor costs by roughly 25% to 30%.
- Third-party delivery platform commissions consume up to 15% to 30% of a cloud kitchen’s gross revenue.
- Average food costs for delivery-only operations consistently represent 25% to 35% of total sales.
- Utility expenses are generally slashed by up to 50% due to the significantly smaller facility footprints.
- Launching a shared kitchen facility requires an initial capital expenditure as low as $25,000 to $50,000.
- Premium sustainable packaging materials account for an estimated 5% to 8% of total operational expenses.
- Integrating inventory management software reduces overall food waste by an average of 15% to 20%.
Cloud Kitchen Market Share Insights
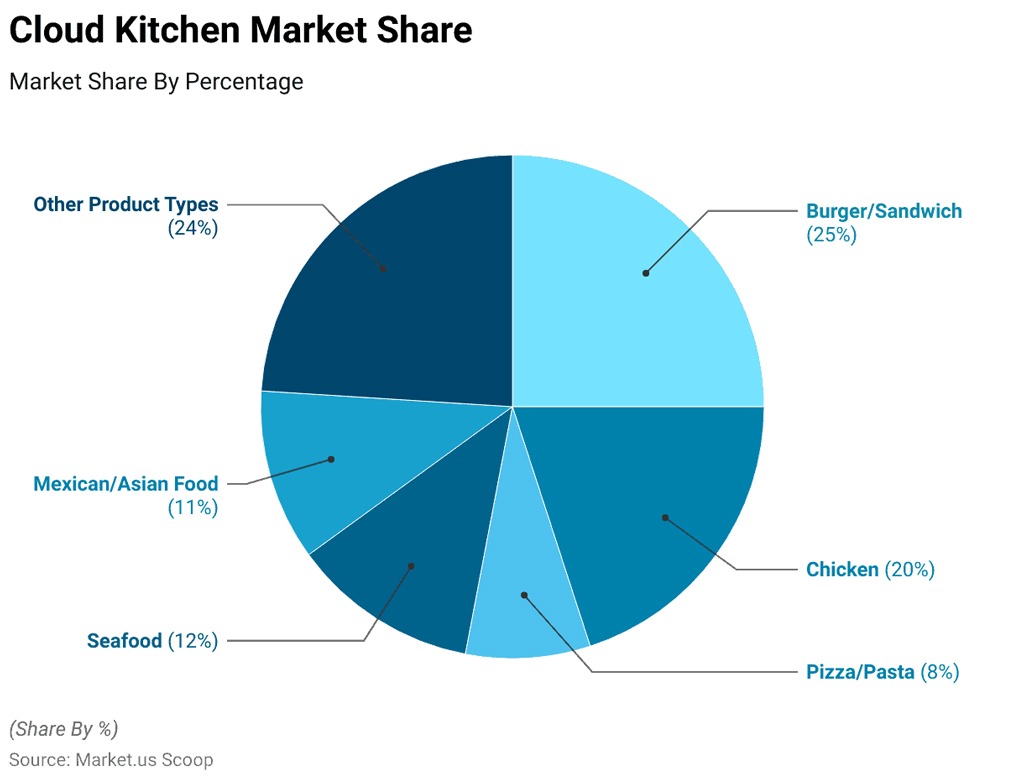
- Burger/Sandwich leads the cloud kitchen market with a 25% share, making it the most popular food category.
- Other Product Types account for 24% of the market, showing strong demand for diverse menu offerings.
- Chicken holds a significant 20% market share, ranking as the third-largest cloud kitchen segment.
- Seafood represents 12% of the market, reflecting steady consumer demand for seafood-based meals.
- Mexican/Asian Food captures 11% of cloud kitchen sales, highlighting growing interest in international cuisines.
- Pizza/Pasta contributes 8% of the market, making it the smallest segment among the listed categories.
- The top three categories, Burger/Sandwich (25%), Other Product Types (24%), and Chicken (20%), collectively control 69% of the market.
- Combined, Seafood (12%), Mexican/Asian Food (11%), and Pizza/Pasta (8%) make up 31% of the cloud kitchen market.
Regional Cloud Kitchen Growth and Market Share Statistics
- Asia-Pacific dominated the global cloud kitchen industry with a substantial 48.28% market share in 2025.
- The United States virtual kitchen market is projected to reach an impressive $27.47 billion by 2032.
- North America captured 26.70% of the worldwide market revenue, equating to $20.42 billion in 2025.
- The Middle East and Africa region is anticipated to be the fastest-growing market with an 11.2% CAGR through 2034.
- The European cloud kitchen sector accounted for $12.53 billion in 2025 due to increasing digital food ordering.
- India is forecast to experience a strong 14.60% CAGR driven by rapid urbanization and high internet penetration.
- China is projected to achieve a massive market valuation of $28.94 billion by the year 2026.
- The Japan cloud kitchen market is steadily expanding and is expected to reach $2.46 billion by 2026.
India Cloud Kitchen Statistics
- The Indian cloud kitchen market is projected to reach $3.69 billion by 2034 while growing at a 12.28% CAGR.
- Independent cloud kitchens dominate the delivery sector by capturing 60.8% of the total market share as of 2025.
- South India remains the leading region with a 35.0% market share, fueled by high-tech workforce order volumes.
- Burgers and sandwiches are the dominant product type, representing 35.8% of total revenue across the ecosystem.
- Delivery-first formats currently account for over 40% of organized food service revenue within India’s top eight cities.
- Small kitchen pod formats are expanding the fastest with a 14.6% CAGR due to urban real estate constraints.
- A massive 93 million biryani orders were processed by top platforms in 2025, proving strong demand for regional food.
- High aggregator commission rates of 25% to 35% continue to heavily impact operating profit margins for independent operators.
- Online digital platforms are projected to capture 20% of India’s total food delivery market by the year 2030.
Cloud Kitchen Order Channel Statistics
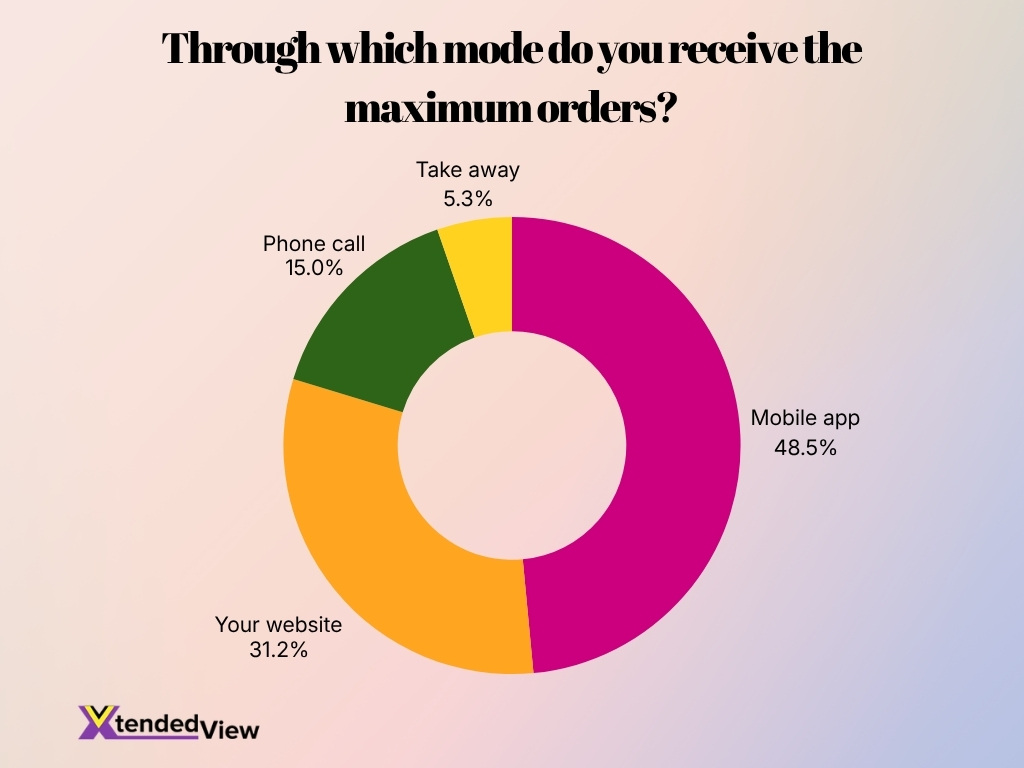
- Mobile apps generate the highest share of orders at 48.5%, making them the dominant customer ordering channel.
- Restaurant websites account for 31.2% of orders, showing strong demand for direct online ordering.
- Phone calls still contribute 15.0% of total orders, highlighting the importance of traditional ordering methods.
- Take-away orders represent just 5.3%, making it the least-used order channel among customers.
- Combined, mobile apps and websites drive 79.7% of all orders, demonstrating the dominance of digital ordering platforms.
Cloud Kitchen Menu Trends and Popular Cuisine Statistics
- The burger and sandwich segment commands the largest global market share among all cloud kitchen food categories.
- Cloud kitchen menus featuring health and wellness options have experienced a 25% higher order volume in targeted local markets.
- Plant-based menu items have witnessed a 30% growth in delivery orders across North American and European virtual restaurants.
- Regional and ethnic cuisine concepts report a 15% higher customer retention rate due to their unique market differentiation.
- Offering personalized meal bundles and combo deals successfully increases a cloud kitchen’s average order value by up to 20%.
- Launching limited-time menu items generates immediate consumer urgency, boosting monthly repeat purchases by approximately 18%.
- Dessert-focused virtual brands capitalize on impulse buying, accounting for nearly 22% of late-night delivery orders.
- Implementing data-driven menu engineering helps operators identify high-margin items and improve overall profit margins by 12%.
- Nearly 65% of delivery consumers state that sustainable and eco-friendly packaging directly influences their food ordering decisions.
Cloud Kitchen Investment and Funding Statistics
- Global ghost kitchen startups secured over $5 billion in funding recently due to the global food delivery boom.
- The highest-performing ghost kitchens report 10% to 30% profit margins, prioritizing efficiency over expansion.
- Shared-kitchen businesses reduce real estate costs by 40% to 60%, attracting funding through lower infrastructure risks.
- Approximately 45% of cloud kitchens will integrate AI tools by 2025 to optimize operational logistics.
- The global online food delivery market is projected to exceed $200 billion by 2025, driving investor interest.
- Leading operator Rebel Foods completed a $210 million funding round, achieving a $1.4 billion valuation.
- The global cloud kitchen market is projected to reach $175.14 billion by 2034, growing at a 9.70% CAGR.
- The delivery-only model drops labor costs to 20% to 25%, demonstrating high scalability potential to investors.
- The share of valuation captured by the top 10 startups stands at 85%, highlighting rapid industry consolidation.
- Ghost kitchen startups report a median valuation of $21.5 million with a valuation-to-capital-raised ratio of 3.2x.
Multi-Brand Cloud Kitchen Statistics
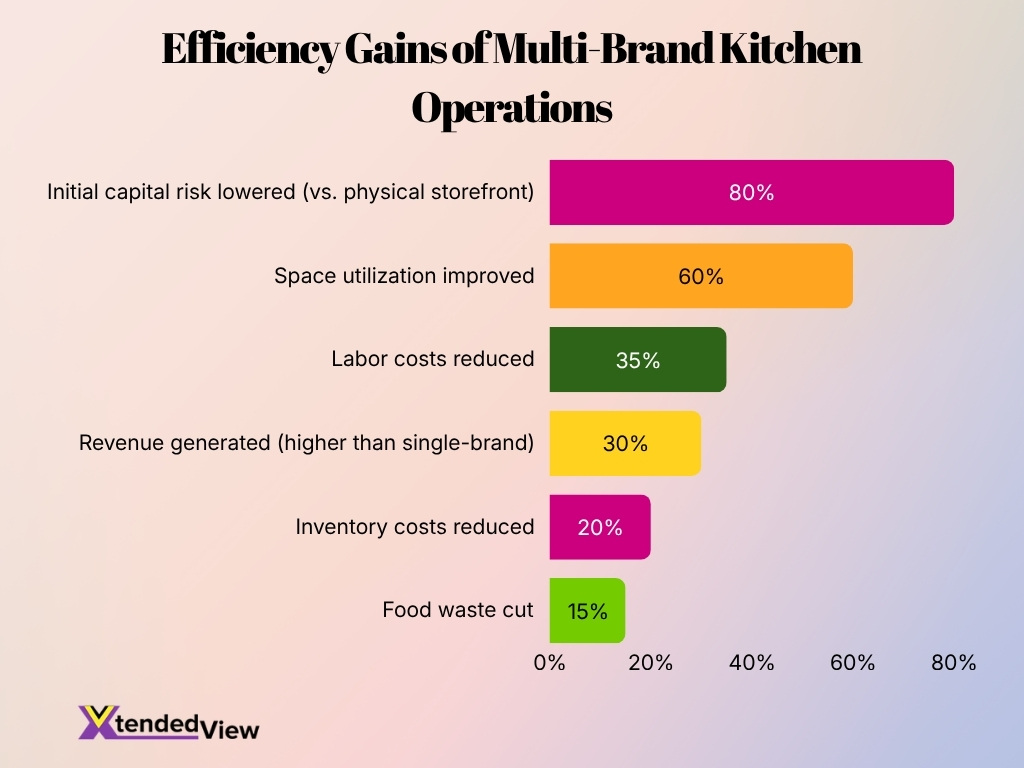
- Multi-brand cloud kitchens improve space utilization by up to 60% by operating multiple concepts from a single facility.
- Sharing ingredients across multiple virtual brands reduces inventory costs by 20% and cuts food waste by 15%.
- Multi-brand operators generate up to 30% higher revenue per kitchen compared to traditional single-brand facilities.
- A single cloud kitchen facility can efficiently support 4 to 8 different virtual restaurant concepts simultaneously.
- Testing new food concepts through a multi-brand strategy lowers initial capital risk by 80% compared to physical storefronts.
- Leveraging consumer data analytics enables operators to launch niche virtual brands 3 times faster than traditional setups.
- Delivery-only virtual brands can be launched and operational in just 2 to 4 weeks since physical storefronts are unnecessary.
- Menu diversification across various virtual brands helps stabilize revenue and can increase profit margins to 15%.
- Centralized staffing and shared equipment in multi-brand kitchens reduce overall labor costs by 25% to 35%.
- Over 75% of successful operators rely on performance analytics to identify which specific food brands deserve expansion.
Virtual Restaurant Statistics
- The global virtual restaurant market is projected to reach $112.99 billion by 2026, growing at a 16.2% compound annual growth rate.
- Operating a virtual brand reduces real estate and overhead expenses by 40% to 60% compared to a traditional dining establishment.
- Ghost kitchens can successfully serve three times more delivery customers within the exact same square footage as traditional restaurants.
- Startup costs for a virtual restaurant range from $16,000 to $78,000, which is significantly cheaper than a full-service restaurant buildout.
- Establishing a delivery-only virtual brand can generate an extra $5,000 to $20,000 in monthly revenue without increasing fixed labor costs.
- An estimated 70% of new restaurant concepts are now structured as virtual kitchens or heavily rely on delivery-first operational models.
- Fresh and ready-to-eat meal options currently constitute a massive 92% of the total virtual restaurant market in the United States.
- Over 60% of modern consumers order takeout or delivery at least once a week, directly driving the rapid expansion of digital food concepts.
Cloud Kitchen Consumer Behavior and Ordering Statistics
- The global online food delivery market is expected to generate $350.6 billion in revenue during 2026.
- Global online food delivery revenue reached approximately $320 billion in 2025.
- Nearly 85% of regular customers prefer mobile ordering for its overall convenience and speed.
- Around 92% of Generation Z consumers order food online at least once weekly.
- About 78% of young adults discover new cloud kitchens and virtual brands primarily through social media.
- Exactly 33% of customers are willing to pay extra for shorter delivery times and real-time tracking.
- In England, around 40% of consumers use food delivery services weekly.
- Only 25% of surveyed consumers recognize dark kitchens by name while ordering from virtual brands.
- Roughly 45% of consumers state that loyalty programs and personalized offers drive repeat ordering.
Key Food Delivery App User Statistics
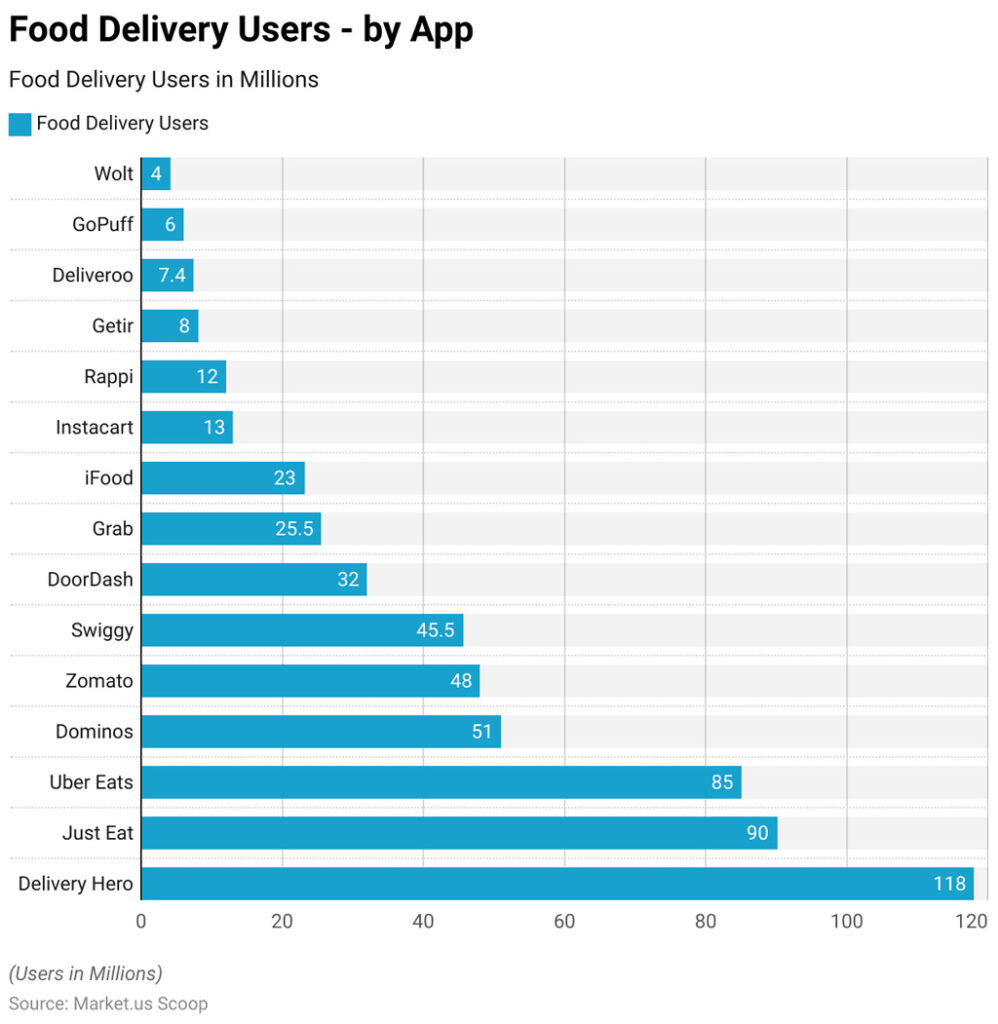
- Delivery Hero leads the market with 118 million users, the highest among all food delivery apps.
- Just Eat ranks second with 90 million users, trailing Delivery Hero by 28 million users.
- Uber Eats serves 85 million users, making it the third-largest food delivery platform globally.
- Domino’s has built a strong digital presence with 51 million users on its delivery platform.
- Zomato reaches 48 million users, slightly ahead of Swiggy’s 45.5 million users.
- DoorDash maintains a sizable user base of 32 million, outperforming several regional competitors.
- Grab records 25.5 million users, highlighting its strength across Southeast Asia.
- iFood attracts 23 million users, making it one of Latin America’s leading delivery apps.
- Instacart serves 13 million users, narrowly ahead of Rappi’s 12 million users.
- Getir has 8 million users, surpassing both Deliveroo (7.4 million) and GoPuff (6 million).
- Wolt reports the smallest user base in the ranking with 4 million users.
- The gap between the largest and smallest platforms is 114 million users, from Delivery Hero (118 million) to Wolt (4 million).
Cloud Kitchen Competitive Landscape and Key Player Statistics
- Independent cloud kitchens captured the largest global market share of 61.7% in 2025.
- Multi-brand kitchen models generated 30% higher average revenue compared to single-brand operations.
- Food delivery platform-owned kitchens contributed approximately $25 billion to global revenue in 2024.
- Over 60% of consumers now prefer ordering food online for delivery or takeout.
- Nearly 70% of consumers express a strong interest in trying new cuisines, making brand diversification highly profitable.
- Operators leveraging data-driven menu customization achieved 25% higher order volumes in targeted localized markets.
- Kitchens utilizing AI and automation operate with up to 30% lower overhead costs compared to traditional restaurants.
- Nearly 18% of all US restaurants were operating some form of a virtual kitchen alongside their core business by 2024.
- Virtual restaurants reduce real estate and front-of-house expenses by 40-60%, significantly accelerating new market entries.
- Approximately 49% of consumers place repeat delivery orders at least once a week, highlighting the value of customer retention.
Cloud Kitchen Technology and Automation Statistics
- Nearly 45% of professional kitchens are expected to adopt AI tools by 2025 to enhance demand forecasting.
- AI-powered waste management systems are helping operators cut food losses by 30% to 50% annually.
- The global cloud kitchen market is projected to grow from $38.30 billion in 2025 to $90.51 billion by 2031.
- Profit margins for automated ghost kitchens range from 8% to 15%, outpacing traditional restaurant margins.
- Early adopters of kitchen robotics and automation report a 30% decrease in food preparation times.
- Tech-driven, delivery-only models reduce labor costs to just 20% to 25% of overall revenue.
- Startup costs for an automated ghost kitchen are significantly lower, ranging from $16,000 to $78,000.
- The independent cloud kitchen segment is projected to dominate the global market with a 65% share in 2026.
- AI-driven computer vision systems in kitchens have helped reduce plate and preparation waste by up to 51%.
- The global cloud kitchen sector is accelerating at a CAGR of 12.4%, driven heavily by digital-first ordering.
Cloud Kitchen Challenges Statistics
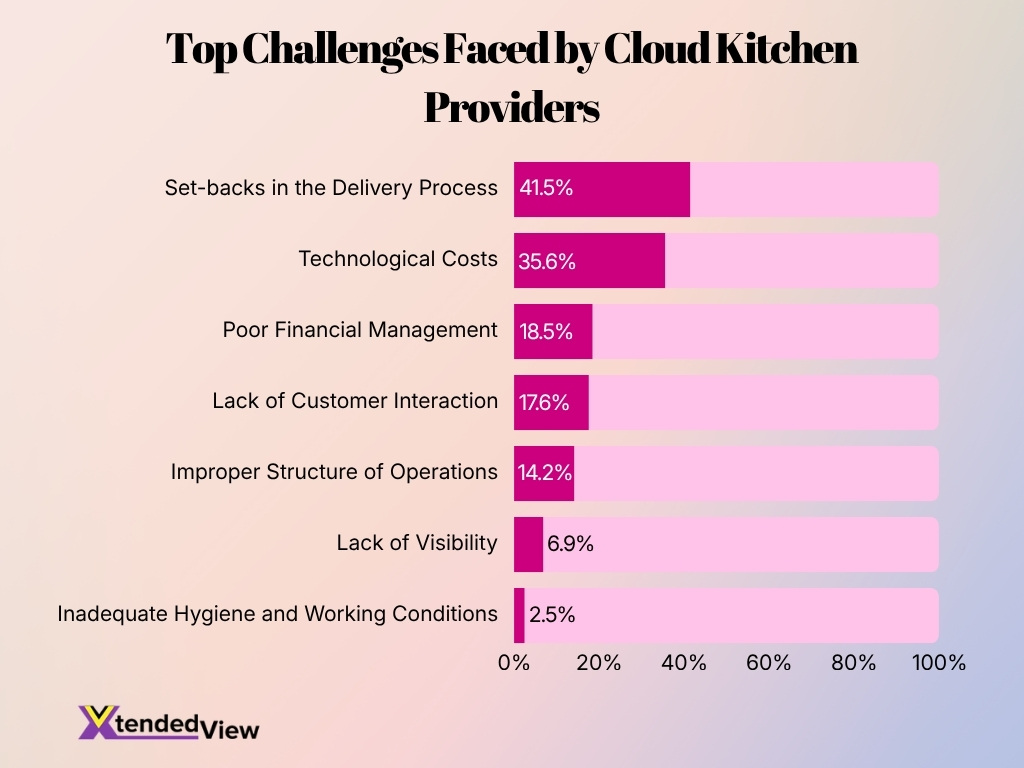
- Delivery process setbacks are the biggest challenge for cloud kitchens, cited by 41.5% of providers.
- Technological costs rank second, with 35.6% of operators struggling with software and infrastructure expenses.
- Poor financial management affects 18.5% of cloud kitchen businesses, impacting profitability and growth.
- Lack of customer interaction is a concern for 17.6% of providers due to the absence of direct dining experiences.
- Improper operational structure challenges 14.2% of cloud kitchens, highlighting workflow inefficiencies.
- Lack of visibility impacts 6.9% of operators, making customer acquisition and brand awareness difficult.
- Inadequate hygiene and working conditions are reported by only 2.5% of respondents, the least-cited challenge.
- The top two challenges, delivery setbacks (41.5%) and technology costs (35.6%), significantly outweigh all other operational concerns.
- Delivery-related issues are nearly 16 times more common than concerns about hygiene and working conditions (2.5%).
- More than three in four respondents (77.1%) identify either delivery setbacks or technological costs as major cloud kitchen challenges.
Future Outlook of Cloud Kitchen Statistics
- The global cloud kitchen market is projected to surge to $286.3 billion by 2036 at a 12.4% CAGR.
- Independent cloud kitchens are expected to dominate the industry by capturing approximately 61% of the global market share.
- The AI, robotics, and automation segment within cloud kitchens is anticipated to grow rapidly at a 13.80% CAGR.
- Cloud kitchen operators can consistently retain 70% to 75% of their gross order value after delivery commissions.
- AI-driven commercial cooking operations are demonstrating operational efficiency gains of over 15% compared to manual preparation.
- The kitchen pods format is expanding at a remarkable 14.6% CAGR globally due to high urban real estate constraints.
- Chain-based delivery kitchens are strategically forecasted to secure a 45.6% market share globally by the year 2035.
- Mature cloud kitchen facilities report favorable EBITDA margins of 8% to 15%, directly outpacing traditional dine-in restaurants.
Frequently Asked Questions (FAQs)
The global cloud kitchen market is projected to reach approximately $91.7 billion in 2026.
The global cloud kitchen market is forecast to grow at a 11.7% to 12.3% CAGR between 2026 and 2035.
The market is projected to reach between $248.1 billion and $263.3 billion by 2035.
Asia-Pacific accounted for approximately 48.3% of the global cloud kitchen market in 2025.
India’s cloud kitchen market is expected to grow to $3.69 billion by 2034, from $1.24 billion in 2025.
Conclusion
Cloud kitchens have evolved from a niche restaurant format into a major force within the global food service industry. The market continues to benefit from growing food delivery demand, widespread smartphone adoption, and advances in automation technology. At the same time, operators face challenges related to competition, customer acquisition costs, and platform dependency.
Looking ahead, AI-driven operations, multi-brand strategies, and direct-ordering channels are likely to shape the next phase of industry growth. As market value moves toward the $150 billion to $200 billion range over the coming decade, cloud kitchens are expected to remain a central part of how consumers order and experience food worldwide.