
The competition between iPhone and Android continues to shape the global smartphone industry. Businesses use these insights to optimize app development budgets, while marketers rely on platform-specific user behavior to improve advertising performance. Consumer preferences, device pricing, AI capabilities, and ecosystem loyalty all influence the ongoing rivalry between the two mobile platforms. Explore the latest statistics to understand how iPhone and Android users compare across markets, demographics, and adoption trends.
Editor’s Choice
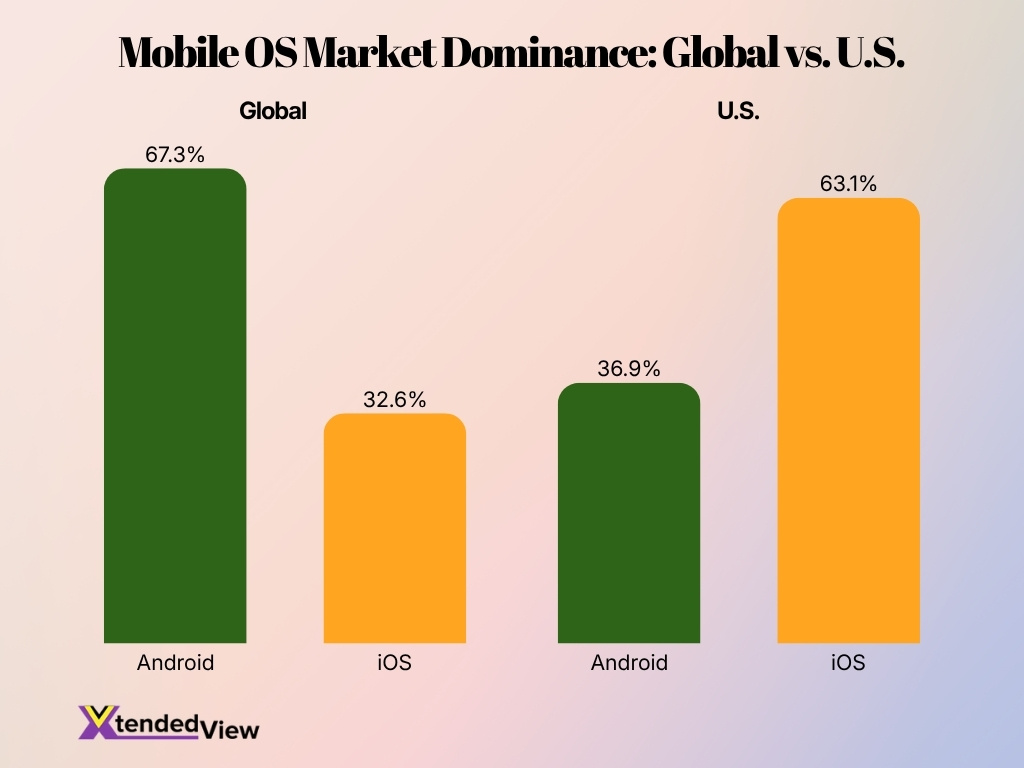
- Android holds 67.3% of the global mobile operating system market in April 2026, while iOS accounts for 32.6%.
- iOS controls 63.1% of the U.S. mobile OS market, compared with Android’s 36.9% share in 2026.
- Android’s global market share remained above 67% throughout the last 12 months, maintaining its lead in emerging economies.
- Apple achieved a record 20% share of worldwide smartphone shipments in 2025, surpassing all smartphone manufacturers.
- Apple’s share of U.S. smartphone shipments reached 69% in Q4 2025, the highest level ever recorded by the company.
- Android represented 73% of global smartphone sales in Q1 2026, while iOS accounted for most of the remaining share.
- Mobile devices generated 50.3% of global web traffic in 2026, highlighting the growing importance of smartphone ecosystems.
Recent Developments
- Apple led the global smartphone market in 2025 with a 20% shipment share, ahead of Samsung’s 19%.
- Global smartphone shipments increased 2% year over year in 2025, signaling continued recovery in consumer demand.
- Apple’s iPhone 17 lineup helped drive record shipment volumes exceeding 247 million units in 2025 forecasts.
- Android’s worldwide market share declined from 76% in Q1 2025 to 73% in Q1 2026, indicating modest gains for iOS.
- In the U.S., Android’s shipment share fell to 31% in Q4 2025, while iOS surged to 69%.
- Demand for premium smartphones increased in markets such as India, Japan, and Southeast Asia, benefiting Apple throughout 2025.
- Manufacturers accelerated shipments during early 2025 to reduce tariff-related risks in major markets.
- AI-powered smartphone features became a primary purchasing factor during 2025 flagship launches.
- Google and Nothing recorded shipment growth of 25% and 31%, respectively, during 2025, reflecting growing Android ecosystem diversity.
iPhone vs Android Global Market Share Statistics
- Android owns 67.3% of the worldwide mobile operating system market as of April 2026.
- iOS holds 32.6% of the global mobile operating system market in 2026.
- Android maintains more than a 2-to-1 lead over iOS in worldwide mobile OS usage.
- Counterpoint reported Android’s global smartphone sales share at 73% during Q1 2026.
- Android controlled approximately 72.7% of the global smartphone market during 2025, according to industry estimates.
- iPhone’s global smartphone market share stood near 26.8% during 2025.
- Android represented roughly 70.6% of active mobile devices globally, while iOS accounted for 28.7%.
- Together, Android and iOS control more than 99% of the worldwide mobile OS market.
- Android’s dominance remains strongest in price-sensitive and emerging markets across Asia, Africa, and Latin America.
iPhone vs Android Market Share in the US
- iOS accounts for 63.1% of the U.S. mobile operating system market in 2026.
- Android holds 36.9% of the U.S. mobile operating system market.
- Apple reached a record 69% U.S. smartphone shipment share in Q4 2025.
- Android’s U.S. shipment share dropped to 31% in Q4 2025.
- During Q1 2025, iOS held 55% of the U.S. market, compared with Android’s 45%.
- U.S. smartphone shipments increased 2% year over year in Q2 2025.
- Apple benefited significantly from promotions offered by major U.S. carriers throughout 2025.
- Industry tracking showed iOS fluctuating between 50% and 65% U.S. market share across the last 10 quarters.
- North America remains one of the few major regions where iPhone consistently outperforms Android.
iPhone vs Android User Base Statistics
- Android commands the global smartphone market with roughly 72% of active devices worldwide.
- iOS captures approximately 28% of all active smartphones globally.
- The Android user base exceeds 3.9 billion active devices, over two times larger than the iPhone user base.
- Apple captured nearly 20% of worldwide smartphone shipments during the second quarter of 2025.
- Android dominates developing economies like India, holding over 95% of the market share.
- More than 99% of smartphone users globally rely on either Android or iOS.
- Apple’s App Store generated around $138 billion in revenue in 2025, significantly outpacing Android.
- Android devices accounted for 79% of global smartphone sales in the third quarter of 2025.
- iOS holds a dominant 58% smartphone market share in the United States.
iPhone vs Android User Demographics by Age
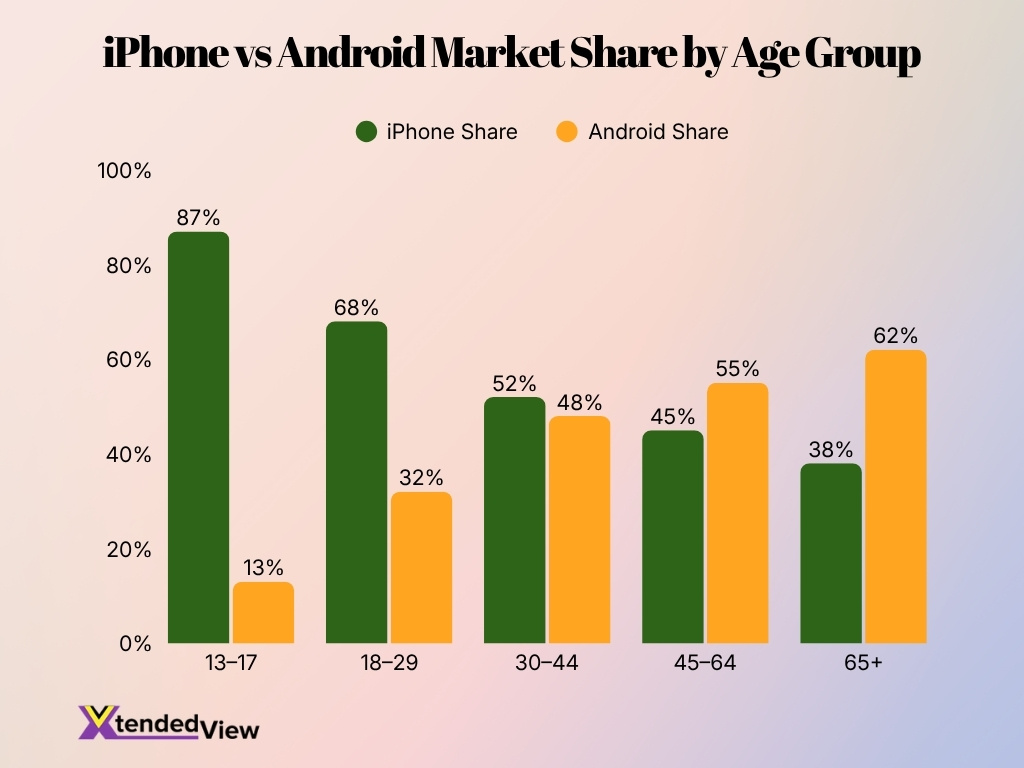
- 87% of U.S. teenagers currently own an iPhone, leaving only 13% for Android.
- 68% of U.S. adults aged 18–29 use an iPhone, compared to 32% on Android.
- 52% of users aged 30–44 in the U.S. prefer iOS, while 48% choose Android.
- 55% of U.S. adults aged 45–64 adopt Android, compared to 45% using iPhone.
- 62% of U.S. seniors aged 65+ use Android, while 38% own an iPhone.
- 57% of Gen Z globally operate Android devices, whereas 31% use an iPhone.
- 55% of Millennials worldwide prefer Android, while 35% choose iPhone.
- 60% of Gen X users globally prefer Android, leaving just 22% on iOS.
Gender Preferences Among iPhone and Android Users
- Globally, 31% of women own an iPhone compared to just 28% of men.
- Android devices are preferred by 60% of male smartphone users versus 54% of females.
- In the UK mobile market, 55% of women use iOS while 51% of men favor Android.
- Behavioral studies show women are 2.25 times more likely to purchase an iPhone than men.
- Android user demographics historically skew male, showing a split of 54% male to 46% female.
- Across surveyed global regions, the average iOS user is reported to be 18% more likely to be female.
- Roughly 30.9% of women intend to upgrade to iOS compared to 22.8% leaning toward Android.
- Demographic data reveals that men are 10% more likely to adopt the Android OS over iOS.
Average Income of iPhone vs Android Users
- The average annual income for an iPhone user is $53,251, compared to $37,040 for an Android user.
- Median iPhone app users earn $85,000 annually, which is 40% higher than the $61,000 median for Android users.
- iPhone users in the U.S. are 48% more likely to earn over $125,000 per year than Android owners.
- The average Android smartphone costs $286, attracting more consumers earning below the national median income.
- Apple users spend an average of $12.77 per app on digital purchases, compared to just $6.19 for Android users.
- iPhone owners spend approximately $117 monthly on premium apparel, nearly double the $62 spent by Android users.
- In-app spending averages $1.00 per user for iOS devices, compared to only $0.47 per user for Android devices.
- iPhone users are 27% more likely to hold a graduate degree, closely correlating with their higher income brackets.
iOS vs Android Market Share by Region
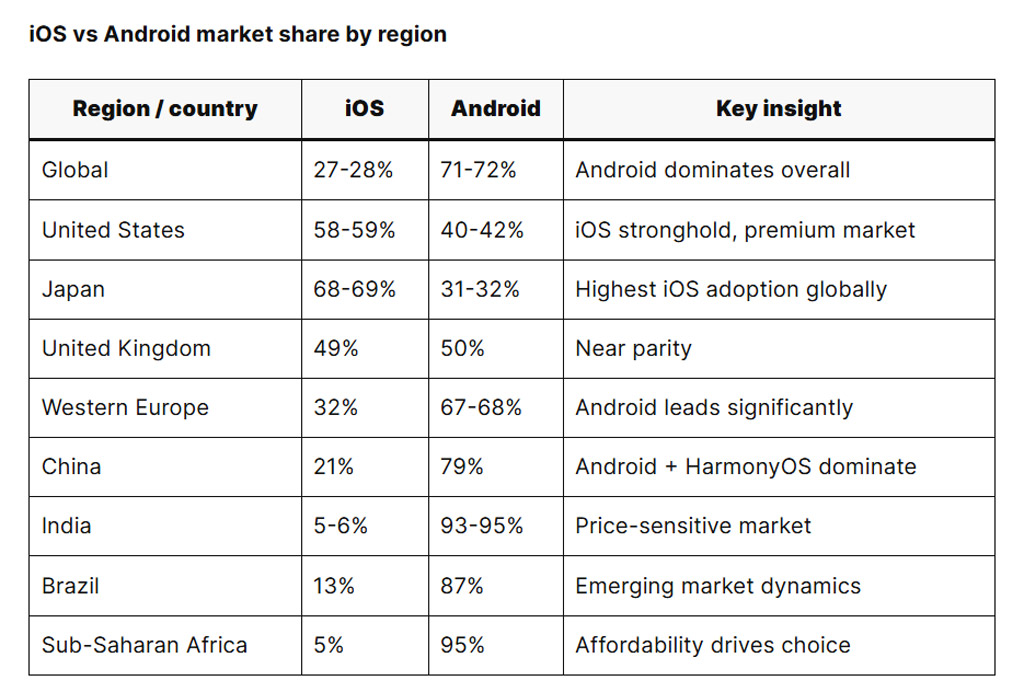
- Android holds 71–72% of the global smartphone market, compared to 27–28% for iOS.
- The United States remains an iOS stronghold with 58–59% market share.
- Japan leads the world in iOS adoption with an impressive 68–69% share.
- The United Kingdom shows near parity, with iOS at 49% and Android at 50%.
- Android commands 67–68% of the market across Western Europe.
- In China, Android and HarmonyOS account for 79% of smartphone users.
- India is overwhelmingly Android-centric, with 93–95% market share.
- iOS penetration in India remains low at just 5–6%.
- Brazil’s smartphone market is dominated by Android with an 87% share.
- Sub-Saharan Africa records the highest Android share, reaching 95%.
- Affordability and pricing continue to be the biggest drivers of Android adoption in emerging markets.
- Premium smartphone markets such as the U.S. and Japan strongly favor Apple’s iOS ecosystem.
Daily Screen Time: iPhone vs Android Users
- iPhone users average 4 hours and 54 minutes of daily screen time compared to 3 hours and 42 minutes for Android users.
- The global average for daily mobile screen time has reached approximately 3 hours and 43 minutes for the typical adult.
- Gen Z demographics exceed the average significantly, with daily screen time often surpassing 6 hours per day.
- Social media applications consume the largest share of mobile usage, making up 35.2% of total daily internet time.
- iPhone users typically send 58 text messages daily, while Android users average only 26 text messages.
- Over the past decade, daily phone screen time has surged by 134%, adding roughly 2 hours and 11 minutes of usage.
- An average smartphone user checks their mobile device 58 times per day, often beginning within 3 minutes of the last session.
- Mobile gaming continues to be a major activity, engaging 67.6% of active internet users across both platforms weekly.
- iOS users spend an average of 6.2 minutes per app session, whereas Android users average slightly longer at 7.5 minutes.
Mobile Usage and Engagement Statistics
- Mobile devices account for over 50% of global web traffic in 2026.
- Smartphone users interact with their devices an average of 58 times per day.
- More than 90% of mobile internet time occurs within apps rather than web browsers.
- Consumers spend over 5 trillion hours annually using mobile applications worldwide.
- Mobile commerce generated more than $2.5 trillion in global sales during 2025.
- Push notifications increase app engagement rates by approximately 88% compared with users who disable notifications.
- Smartphone users check messaging apps more frequently than any other app category.
- Video streaming remains one of the fastest-growing mobile activities globally.
- AI-enabled features increased daily engagement across both Android and iPhone ecosystems throughout 2025.
App Downloads: iPhone (App Store) vs Android (Google Play)
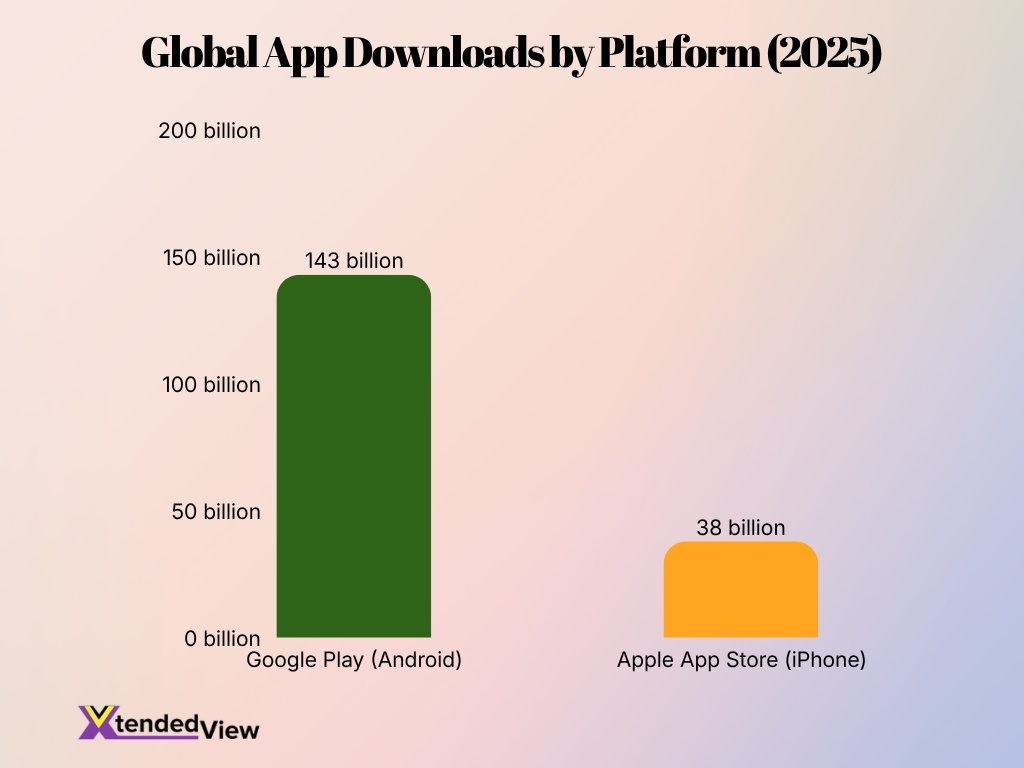
- Google Play led global app downloads with 143 billion downloads in 2025.
- Apple App Store recorded 38 billion downloads worldwide in 2025.
- Google Play generated 3.8× more downloads than the Apple App Store.
- Android accounted for approximately 79% of combined app downloads across both platforms.
- iPhone users contributed around 21% of total app downloads.
- The combined total reached 181 billion app downloads globally in 2025.
- Google Play dominated app distribution, driven by Android’s larger global user base.
- The download gap between platforms stood at 105 billion downloads in favor of Android.
- For every 1 App Store download, Google Play delivered nearly 4 downloads.
- Android remained the leading mobile ecosystem by app download volume worldwide.
In-App Spending Statistics for iPhone and Android
- Global consumer spending on mobile in-app purchases reached $167 billion in 2025.
- The Apple App Store generated $90.6 billion in revenue compared to Google Play’s $52.3 billion in 2025.
- The Apple App Store accounts for approximately 65% of the total global app revenue.
- An iOS user generates 2.5 times more revenue on average than an Android user.
- Mobile gaming apps represent the largest share by accounting for over 70% of total app revenue.
- Consumer spending on subscription-based apps globally exceeded $190 billion in 2025.
- In-app purchases currently account for 48.2% of all mobile app earnings globally.
- Users worldwide generated 5.3 trillion hours of app engagement, averaging 3.6 hours per day in 2025.
- There were 108.9 billion installs on Google Play compared to 47.4 billion on the App Store in 2025.
- The United States and China consistently rank as the highest-spending mobile markets in the world.
Device Lifespan and Upgrade Rates for iPhone vs Android
- The average iPhone remains active for approximately 4 to 5 years before replacement.
- Android devices are typically replaced after 3 to 4 years, depending on brand and price tier.
- Apple’s software support now extends up to 6 years or more for many iPhone models.
- Android manufacturers have expanded software support, with several flagship devices now receiving up to 7 years of updates.
- Global smartphone replacement cycles increased to approximately 43 months in 2025, up from 38 months several years ago.
- Refurbished smartphone sales grew by more than 6% year over year during 2025 as users held devices longer.
- iPhone devices account for a disproportionately large share of the refurbished smartphone market.
- Battery performance and software support remain the primary reasons consumers upgrade smartphones.
- Premium smartphones generally remain in use longer than budget devices due to higher durability and resale value.
Key Customer Loyalty Insights: iPhone vs Android
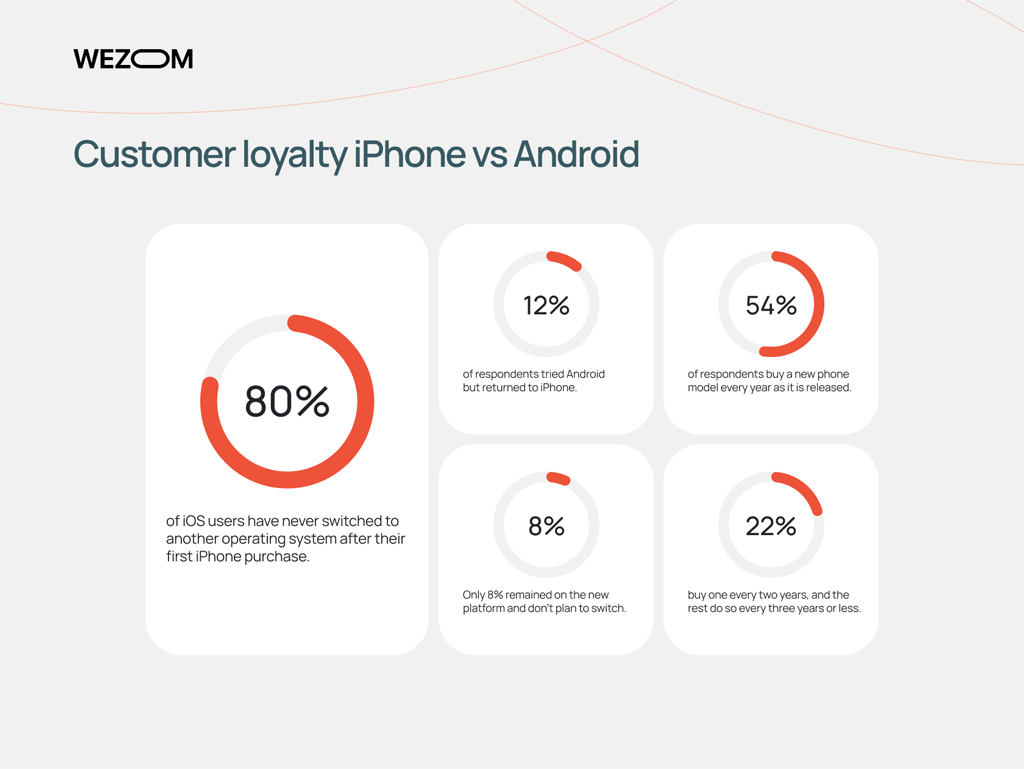
- 80% of iOS users have never switched to another operating system after buying their first iPhone.
- 12% of respondents tried Android but eventually returned to iPhone.
- Only 8% of switchers stayed on their new platform and do not plan to switch.
- 54% of users purchase a new smartphone every year when a new model is released.
- 22% of respondents upgrade their smartphones every two years.
- The data highlights stronger customer loyalty among iPhone users compared to Android users.
- A combined 20% of users have experimented with Android after using an iPhone.
- The 80% retention rate demonstrates Apple’s exceptionally high brand loyalty.
- Annual upgrade behavior remains common, with more than half of users (54%) buying new devices yearly.
- Long-term platform switching appears limited, as only 8% remain on the new operating system after switching.
Business and Enterprise Adoption Statistics
- iPhones account for approximately 65% of enterprise-owned smartphones in North America.
- More than 80% of Fortune 500 companies support iOS devices within their workplace environments.
- Mobile device management usage exceeded 75% among large enterprises globally in 2025.
- The enterprise segment recorded the largest mobile device management market share at 72% in 2025.
- Cloud-based deployment captured a major market share of 58% for enterprise device management in 2025.
- Approximately 99% of Fortune 500 companies adopted AI-enabled tools in some capacity during 2025.
- The Android platform accounted for a 60% market share in global managed enterprise operating systems in 2025.
- The global mobile device management market is projected to reach $12.04 billion by the end of 2026.
Security and Privacy Statistics: iPhone vs Android
- Apple’s App Store reviewed more than 7 million app submissions during 2025 to reduce fraud and security risks.
- Apple blocked over $9 billion in fraudulent transactions across the App Store ecosystem between 2020 and 2025.
- Android remains the most targeted mobile operating system because of its larger global market share.
- More than 70% of mobile malware detections worldwide occur on Android devices.
- iOS devices experience significantly fewer malware incidents due to stricter application controls.
- Biometric authentication usage exceeds 80% among smartphone users, with Face ID and fingerprint recognition leading adoption.
- Privacy concerns increasingly influence smartphone purchase decisions, particularly among younger consumers.
- Android security improved substantially through Google Play Protect and expanded update commitments from manufacturers.
- Enterprise IT teams continue to rank iOS among the most secure mobile platforms for corporate deployments.
AI and Smart Features Adoption Statistics
- More than 60% of smartphone users utilized at least one AI-powered mobile feature during 2025.
- Generative AI smartphone shipments globally surpassed 185.4 million units in 2025.
- AI-enabled smartphones are projected to account for over 40% of global smartphone shipments by 2027.
- Nearly 65% of premium smartphones launched recently feature dedicated AI accelerators for local processing.
- The global GenAI-powered smartphones market is projected to grow to $413.8 billion by 2034.
- Hybrid AI architectures combining on-device and cloud processing reached a 41% adoption rate in 2025.
- The healthcare AI smartphone sector alone is projected to reach a value of $8.4 billion by 2026.
- Asia currently dominates the AI smartphone market with a 53% market share.
- Over 78% of smartphone users in regulated markets express privacy concerns regarding personal AI data processing.
Frequently Asked Questions (FAQs)
Android holds 67.3% of the global mobile operating system market, while iOS accounts for 32.6% as of April 2026.
iOS controls 63.1% of the U.S. mobile operating system market, compared to Android’s 36.9% share in 2026.
More than 90% of iPhone users remain loyal when upgrading devices, while Android loyalty typically ranges between 70% and 80%.
There are approximately 3.9 billion Android users globally compared with about 1.56 billion iPhone users in 2026.
iPhone users spend an average of $101 per month on technology products and services, while Android users spend about $50 per month.
Conclusion
The latest iPhone vs Android users statistics highlight two highly successful ecosystems that continue to dominate the smartphone industry in different ways. Android remains the global leader in market share and total users, driven by its extensive device range and strong presence in emerging markets. Meanwhile, iPhone continues to lead in areas such as customer loyalty, app revenue, enterprise adoption, and premium smartphone demand, particularly in the United States and other developed economies.
As smartphone technology evolves, factors such as AI-powered features, privacy protections, software support, and ecosystem integration are becoming increasingly important to consumers. These trends influence how users interact with their devices, how much they spend on apps and services, and which platform they choose when upgrading. For businesses and marketers, understanding the differences between iPhone and Android users provides valuable insights that can improve targeting, product development, and long-term growth strategies in an increasingly mobile-first world.