
Operating systems (OS) are the invisible engines powering every connected device we use, from phones to laptops to tablets. The OS landscape continues to evolve rapidly, shaped by mobile expansion, desktop transitions, and new user priorities like security and performance. For example, Windows 11 became the most widely used desktop OS as users moved off Windows 10 ahead of its support end. On the mobile side, Android retains a near-universal lead in smartphone operating systems, influencing app development and global connectivity.
These trends matter for hardware makers, software developers, and enterprise planners. Read on to explore the latest operating system statistics, market shares, and usage patterns that define computing.
Editor’s Choice
- Android dominates global OS usage across all devices with around 44.44% of the market in 2025.
- Windows remains the top desktop OS, with roughly 71–72% market share worldwide.
- iOS holds 15% of global OS share, driven by strong engagement on iPhones and iPads.
- Mobile OS market share (71.94% Android, 27.64% iOS) reflects sustained mobile adoption.
- Chrome OS gains traction, especially in education, with US adoption near 8.4% in desktops.
- Windows 11 officially surpasses Windows 10 as the leading Windows version in 2025.
- Global PC shipments rose 8% in 2025, partly due to OS lifecycle changes.
Recent Developments
- In July 2025, Windows 11 overtook Windows 10 as the most used desktop OS, with Windows 11’s share exceeding 50%.
- Global PC shipments increased by about 8% year‑over‑year in 2025, linked to upgrades ahead of Windows 10 end‑of‑support.
- Chrome OS continued to grow, with global desktop share 1.5% and strong US education adoption (8.44%).
- Android 15 became the most popular Android version on smartphones, outpacing Android 14 and earlier builds.
- Mobile OS projections show continued growth in the mobile segment market value from $54.5B (2025) to $74.7B by 2030.
- HarmonyOS maintained a 4% global smartphone OS share in 2025 outside the Android‑iOS duopoly.
- There’s steady Linux growth in niche segments like Steam and gaming, now above 3% on Steam platforms.
Global Operating System Market Overview
- Android continues as the world’s most widely used OS across all device types (44.44% share in 2025).
- Windows holds roughly 27–32% of global OS usage when desktops, laptops, and other endpoints are combined.
- iOS and iPadOS together account for about 15–17% of worldwide OS share.
- macOS represents a small but growing segment in desktops and laptops (around 5–8% globally).
- Chrome OS typically stays below 2% globally, though regional pockets show higher demand.
- Linux desktops range from 3–5% of desktop usage globally, depending on the measurement source.
- The overall OS ecosystem reflects a mobile‑first skew, with mobile devices eclipsing traditional PCs in unit volume and active connections.
Desktop Operating System Market Share Worldwide
- Windows controls 71–72% of the global desktop OS market in 2025.
- macOS sits between 5–8% of global desktop OS share.
- Linux desktops average 3–5% worldwide, showing incremental growth.
- “Unknown” or unclassified OS instances can account for up to 10% in some datasets, indicating niche or legacy systems.
- Windows versions: Windows 11 overtook Windows 10 in 2025 usage share on desktops.
- Chrome OS holds 1.5–1.9% of the global desktop OS space.
- macOS’s share growth is often strongest in creative, enterprise, and remote‑work segments.
- Regional desktop OS rankings can vary, but Windows remains dominant in the US, Europe, and Asia.

Mobile Operating System Market Share Worldwide
- Android commands 71.94% global mobile OS market share in November 2025.
- iOS secures 27.64% worldwide mobile OS share as of late 2025.
- Samsung OS captures just 0.24% of the global mobile OS market.
- KaiOS holds a minimal 0.04% share in the worldwide mobile OS landscape.
- In the US, iOS leads with 59.21% mobile OS market share in 2025.
- Android dominates India with 96.67% mobile OS share in September 2025.
- The global smartphone OS market is valued at $54.51 billion in 2025.
- Android reaches up to 76% global share in select 2025 datasets.
- iOS grabs 67% of global app revenue despite a lower OS share.
Operating System Market Share by Device Type
- Android commands 71.94–72.15% of the global mobile OS market share worldwide.
- iOS holds 27.65% of the worldwide mobile operating system market.
- On desktops/laptops, Windows dominates with 71.68% global share.
- macOS captures 15.7% of the global desktop OS market.
- Chrome OS secures 1.86% of worldwide desktop operating systems.
- Linux (excluding ChromeOS) reaches 4.20% global desktop market share.
- Tablets see iPadOS/iOS at 51.07% and Android at 48.74% worldwide.
- Across all devices, Android leads at 44.44% global OS usage.
Operating System Market Share by Region
- North America sees Windows at 31.02%, iOS at 27.77%, and Android at 23.97% OS share in 2025.
- South America reports Windows leading with 43.99%, Android at 38.94% in 2025.
- Africa features Android dominance at 56.99%, Windows at 19.17% as of late 2025.
- Asia shows Android commanding 55.1%, Windows at 24.56% market share.
- Europe has Windows at 35.75%, Android at 29.88%, and iOS at 18.49% in 2025.
- Globally, Android holds 44.44%, Windows 27.45%, and iOS 15.94% across devices in 2025.
- Oceania records Android at 35.01%, iOS 26.89%, and Windows 23.29% OS usage.
- In the US, Windows reaches 32.95%, iOS 28.14%, and Android 21.06% in 2025.

macOS and OS X Usage Statistics
- macOS commands an 8.26% share of the global desktop OS market as of late 2025.
- macOS holds a robust 29.62% share in the U.S. desktop OS market.
- Apple Macs capture 15.1% of the global PC market in 2024–2025.
- 72% of employees prefer macOS over Windows when given a choice in businesses.
- 87% of engineering professionals rely on macOS for its stability.
- 44% of global software developers use macOS for coding tasks.
- 23% of U.S. educational institutions deploy Macs, especially in higher education.
- macOS 15.6 leads version usage at 11.44% worldwide in November 2025.
- SMB adoption of macOS climbed from 24% to 27% since late 2024.
Linux Desktop Operating System Statistics
- Linux desktops reached a global market share of 4.20% as of March 2025.
- Linux usage on Steam hit a record 3.2% of all users in November 2025.
- In the US desktop market, Linux crossed 5.03% in June 2025.
- Ubuntu leads Linux distros with 33.9% market share among variants.
- 25–30% of professional developers use Linux as their main OS.
- 47% of software developers work with Linux-based systems daily.
- Linux desktop user base grew by 12.6% in 2025 globally.
- 61.4% of large enterprises adopted Linux as core OS, up 9.8% YoY.
Chrome OS Market Share Statistics
- Chrome OS holds 1.53% of the global desktop OS market as of September 2025.
- US desktop share stands at 8.44%, fueled by education sector dominance.
- Global Chromebook shipments hit 22.11 million units in 2025.
- Education drives 58.30% of the Chrome OS market size.
- Enterprise adoption grows at 8.2% CAGR through 2025.
- Chrome OS commands 1.86% global desktop share per recent metrics.
- Projections show Chrome OS reaching 1.72% global share by 2026.
- x86 platforms hold 71.60% of the Chromebook architecture market.
- ARM-based Chromebooks expand at 8.70% CAGR, outpacing x86.
Windows Operating System Market Share Breakdown
- Windows 10 dominates the market with 53.19%, remaining the most widely used Windows version.
- Windows 11 shows strong adoption, capturing 43.22% of users and rapidly closing the gap with Windows 10.
- Legacy operating systems are nearly phased out, with Windows 7 accounting for only 2.48% of usage.
- Very old versions are almost obsolete, as Windows XP holds just 0.54% of the market.
- Windows 8.1 and Windows 8 have minimal presence, with 0.29% and 0.22%, respectively.
- Modern Windows versions (10 and 11) together represent over 96% of total Windows usage, highlighting a strong shift toward newer platforms.

Android Operating System Market Share Statistics
- Android commands a 72.15% global mobile OS market share as of January 2025.
- Worldwide, Android holds 71.94% of mobile OS usage in November 2025.
- In the US, Android secures 40.74% mobile OS market share from Nov 2024–2025.
- Android dominates South America with 83.76% mobile OS share in 2025.
- Samsung leads Android vendors at 20.66% global mobile market share, Xiaomi follows at 10.5%.
- Android tablets capture 51.7% of the global tablet OS market in 2025.
- Samsung and Xiaomi together drive over 30% of global Android smartphone shipments.
- Android’s all-device worldwide OS share stands at 37.87% in late 2025.
- Year-over-year, Android’s mobile share remains stable near 72% globally.
iOS Operating System Market Share Statistics
- iOS holds roughly 27–29% of global mobile OS share in 2025, up slightly from 2024.
- In the United States, iOS leads mobile usage with about a 57–59% share, driven by strong iPhone loyalty.
- iOS contributes approximately 15–17% of total OS usage across all devices worldwide.
- iOS users generate a higher average app revenue per user compared with Android users globally.
- Apple’s annual hardware refresh cycle continues to support consistent iOS upgrade adoption.
- iOS market share remains strongest in North America, Japan, and Western Europe.
- iOS devices account for over 65% of mobile web traffic in the US, despite lower unit volumes globally.
- Between 2024 and 2025, iOS gained 1 percentage point globally, reflecting steady ecosystem growth.
Legacy and Discontinued Operating Systems Statistics
- Windows 7 usage dropped below 3% globally by early 2025, continuing its post‑support decline.
- Windows XP and Vista combined account for less than 0.5% of desktop usage worldwide.
- Legacy mobile OS platforms like BlackBerry OS and Windows Phone now measure below 0.1% share.
- Older macOS versions (pre‑Catalina) represent under 2% of macOS installs globally.
- Enterprises with legacy OS deployments cite security and compatibility risks as top migration drivers.
- Industrial and embedded systems still run legacy OS versions in specialized environments, though numbers continue to shrink.
- Governments worldwide have accelerated legacy OS phase‑outs due to compliance requirements.
- Overall, legacy operating systems represent a shrinking but non‑zero footprint in 2025.
Tablet Operating System Usage Statistics
- Apple’s iPadOS commands 51.07% of the global tablet OS market share in November 2025.
- Android holds 48.74% worldwide tablet OS usage as of late 2025.
- iPadOS peaked at nearly 73% global tablet share in early 2019.
- Android grew by over 17 percentage points in the tablet market since 2019.
- Windows tablets claim just 0.01% of the global tablet OS market.
- Chrome OS tablet adoption stays under 1% internationally.
- Linux-based systems hold 0.14% tablet OS share worldwide.
- Tablet OS shares fluctuate more than smartphones due to seasonal product cycles.

Operating System Adoption by Version (Windows, Android, iOS)
- Windows 11 surpassed Windows 10 in mid‑2025, reaching over 50% of Windows desktop usage.
- Windows 10 declined to below 45% share as enterprises prepared for end‑of‑support in 2025.
- Android 14 and 15 together account for more than 55% of active Android devices globally.
- iOS 17 adoption reached over 70% of active iPhones within a year of release.
- Android version fragmentation remains wider than iOS, with five major versions still active at scale.
- Faster update adoption correlates with newer hardware shipments, especially in premium devices.
- OS version adoption plays a critical role in security patch coverage.
- Version consolidation trends accelerated slightly from 2024 to 2025 across all platforms.
Operating System Share by Vendor and Ecosystem
- Google’s Android + Chrome OS commands 44.44% + 1.31% ≈ 46% of the global OS market share across all devices.
- Microsoft Windows holds 27.45% worldwide OS usage, dominating desktops at 69.5%.
- Apple ecosystem (iOS + iPadOS + macOS) totals 15.94% + 5.30% ≈ 21% of global device OS share.
- Android leads mobile OS with 72.72% market share globally.
- Windows 11 captures 49.02% of Windows desktop versions, signaling strong enterprise adoption.
- Chrome OS achieves 1.83% global share, rising to 8.44% in US education markets.
- Apple iOS dominates the North American mobile market at 27.77% vs Android’s lower regional share.
- Linux grows to 3.39–4.06% globally, strong in the enterprise and developer sectors.
- Windows commands 70.21% desktop OS dominance despite mobile competition.
Security and Vulnerability Statistics by Operating System
- Windows reported 587 vulnerabilities in 2024, with 33 critical, outpacing other desktop OS due to its dominant market share.
- Linux vulnerabilities surged 967% to 3,329 in 2024, mainly affecting servers rather than desktops.
- macOS saw 508 vulnerabilities in 2024, a 95% increase year-over-year, with stable, low exploit rates.
- Android faced 1,421 vulnerabilities in 2024, leading mobile OS threats due to its 72% global market share.
- iOS had 243 vulnerabilities disclosed in 2024, with 80% of versions actively exploited sometime in 2023.
- 87% of 2025 malware detections hit Windows versus 13% on macOS, reflecting usage scale.
- Linux kernel exploits like CVE-2024-1086, rose in 2025, but desktop rates stayed low compared to servers.
- Enterprises with poor OS patching faced 7x higher ransomware risk versus top patch adopters.
- 96% rise in exploited OS vulnerabilities from 101 in 2023 to 198 in 2024.
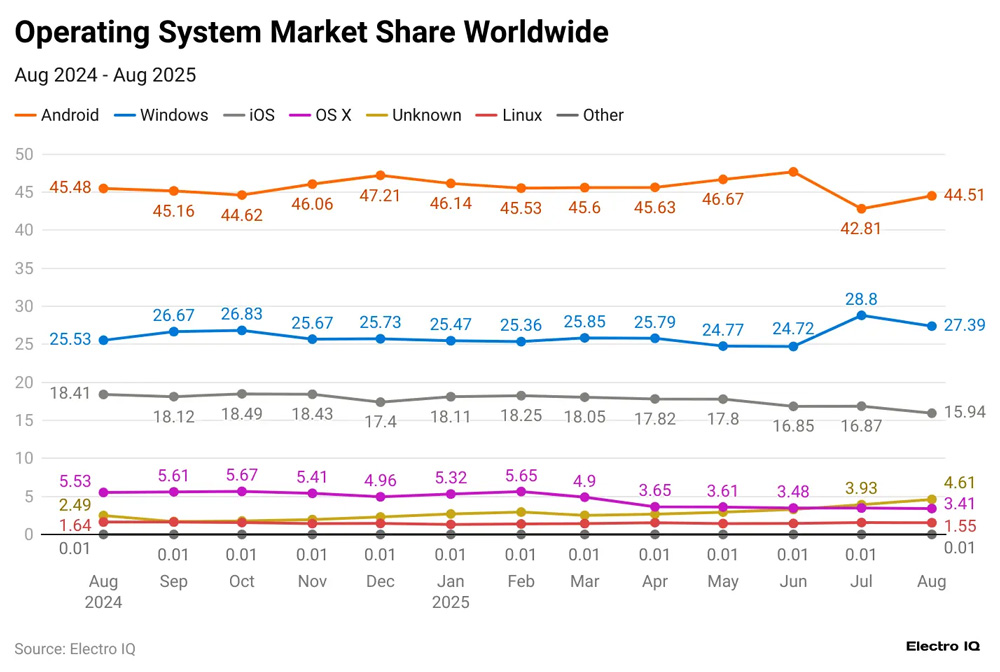
Global Operating System Market Share Trends (Aug 2024 – Aug 2025)
- Android remains the dominant OS worldwide, consistently holding the largest share throughout the period, ranging from 42.81% to a peak of 47.52%, before closing at 44.51% in Aug 2025.
- Windows strengthens its position, rising from 25.53% in Aug 2024 to 27.39% in Aug 2025, with a notable spike to 28.8% in July 2025, indicating renewed desktop adoption.
- iOS shows a gradual decline, dropping from 18.41% at the start of the period to 15.94% by Aug 2025, reflecting a softening in relative market share over the year.
- macOS (OS X) experiences a steady downward trend, falling from 5.53% to 3.41%, suggesting slower growth compared to competing platforms.
- The “Unknown” category expands significantly, increasing from 2.49% to 4.61%, pointing to growing diversity in devices or unclassified operating systems.
- Linux remains stable but niche, consistently hovering around 1.5–1.7%, reinforcing its role as a specialized rather than mainstream OS.
- Other operating systems stay negligible, maintaining a flat 0.01% share across all months.
- July 2025 stands out as a turning point, marked by Android’s sharp dip to 42.81% and Windows’ peak at 28.8%, highlighting a temporary shift in global OS usage patterns.
Operating System Usage in Enterprises, Education, and the Public Sector
- Windows powers over 80% of enterprise desktops globally in 2025.
- Chrome OS devices represent over 50% of K‑12 school laptops in the US.
- macOS adoption continues to grow in creative and remote‑first organizations.
- Government agencies favor Windows due to legacy application compatibility.
- Linux dominates server and cloud infrastructure, though outside consumer OS metrics.
- Education OS decisions prioritize device cost and manageability.
- Enterprise OS diversity increased slightly post‑2024 due to hybrid work models.
- OS choice directly affects IT staffing, security policy, and software licensing costs.
Future Outlook and Projections for Operating System Market Share
- Global OS market shares are expected to remain structurally stable through 2027.
- Android is projected to retain over 70% mobile OS share worldwide.
- Windows desktop share may decline slightly but remain above 60% globally.
- iOS growth will likely continue in the premium and enterprise mobility segments.
- Chrome OS adoption is forecast to grow modestly in education and frontline work.
- OS competition will increasingly focus on AI integration and security capabilities.
- Hardware refresh cycles will drive short‑term OS adoption spikes.
- Long‑term shifts favor ecosystem strength over standalone OS features.
Frequently Asked Questions (FAQs)
Android holds about 44.44% of the global operating system market share in 2025 across all device types.
Windows accounts for approximately 71–72% of the desktop OS market worldwide in 2025.
In 2025, Android holds about 71.94% of the mobile OS market, while iOS holds about 27.64%.
In the United States in 2025, iOS captures roughly 59% of smartphone OS share, compared to about 41-42% for Android.
Linux holds around 3–4% of the global desktop operating system market share in 2025.
Conclusion
Operating system statistics show a market defined by stability at the top and gradual change at the margins. Android and Windows continue to lead their respective domains, while iOS and macOS strengthen their positions through ecosystem loyalty and premium usage. Meanwhile, Chrome OS and Linux carve out focused roles in education, development, and infrastructure. For businesses, developers, and policymakers, understanding OS trends is less about chasing disruption and more about planning around scale, security, and long‑term support.
As the computing landscape evolves, operating systems remain the foundation shaping how people work, learn, and connect worldwide.