
The mobile gaming sector has grown into one of the most influential entertainment markets globally, transforming not only how consumers play but how companies strategize. In one example, casual gaming apps helped drive smartphone adoption in emerging markets; in another, large-scale mobile titles are now central in advertising, media, and brand partnerships.
Editor’s Choice
Here are seven key takeaways that frame what’s happening in mobile gaming right now:
- The global mobile gaming market is projected to be worth about $103 billion in 2025.
- Mobile games accounted for ≈49% of the entire video games market revenue in 2024.
- There are roughly 3.32 billion active gamers worldwide in 2025.
- Global mobile game downloads reached about 49 billion in 2024, representing a decline of 7% compared with the previous year.
- Emerging markets (e.g., Turkey, Mexico, India, Saudi Arabia) led year-on-year consumer spending increases in mobile games in 2024.
- Console & PC growth outpaced mobile in some regions in 2025, signalling a maturing mobile market.
- In the U.S., the mobile gaming market reached roughly $48.7 billion in 2025, with a 10.3% year-on-year growth rate.
Recent Developments
- In 2024, mobile games generated around $92 billion in revenue.
- The total number of mobile game downloads in 2024 was about 49 billion, down approximately 7% from 2023.
- For 2025, the overall global games market is forecast to hit $188.8 billion, with mobile at about $103 billion.
- About 49% of industry respondents believe user spending on games will rise in 2025, and another 49% expect it to remain stable.
- In 2024, download declines were particularly driven by casual game genres despite growth in in-app purchases for hybrid-casual segments.
- In 2025, projected ad spend in mobile gaming is expected to grow, indicating the increased importance of advertising revenue alongside in-game purchases.
- The mature mobile game market is showing signs of plateauing in some East Asian regions, while Western and emerging markets pick up the slack.
- More mergers and acquisitions are being reported in the mobile gaming sector as companies seek scale and global reach.
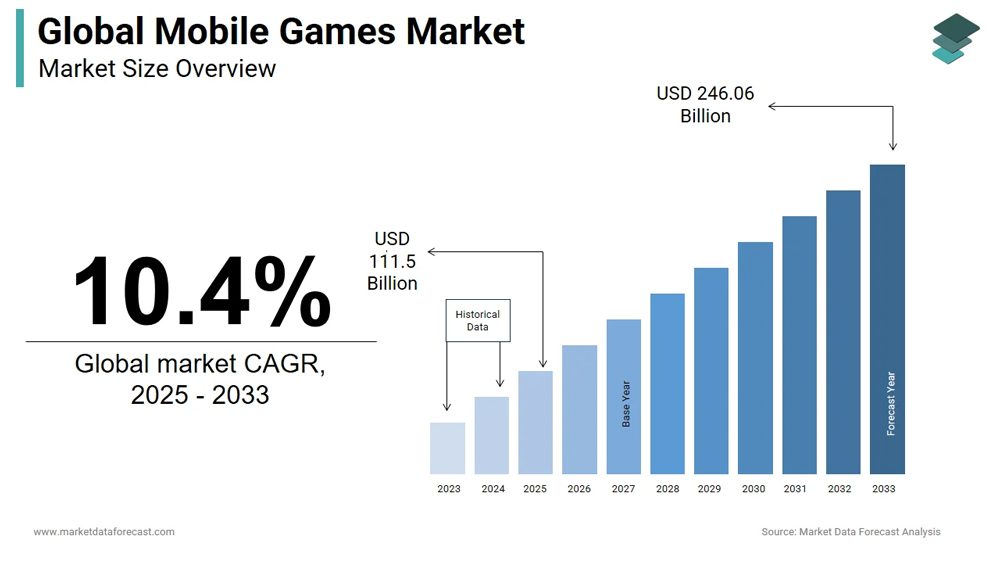
Global Mobile Games Market
- The global mobile gaming market is projected to grow at a CAGR of 10.4% from 2025 to 2033, indicating strong and sustained expansion.
- Market size is expected to rise from $111.5 billion in 2025 to a massive $246.06 billion by 2033.
- Historical data (2023–2025) shows steady year-over-year growth, forming the foundation for long-term projections.
- The market begins its major growth trajectory from the 2027 base year, accelerating in the forecast period.
- The forecast suggests nearly a doubling of market value over the eight years, reinforcing mobile gaming as one of the fastest-growing entertainment sectors.
- Growth is visually represented through a rising bar chart, showing consistent upward movement with no expected declines.
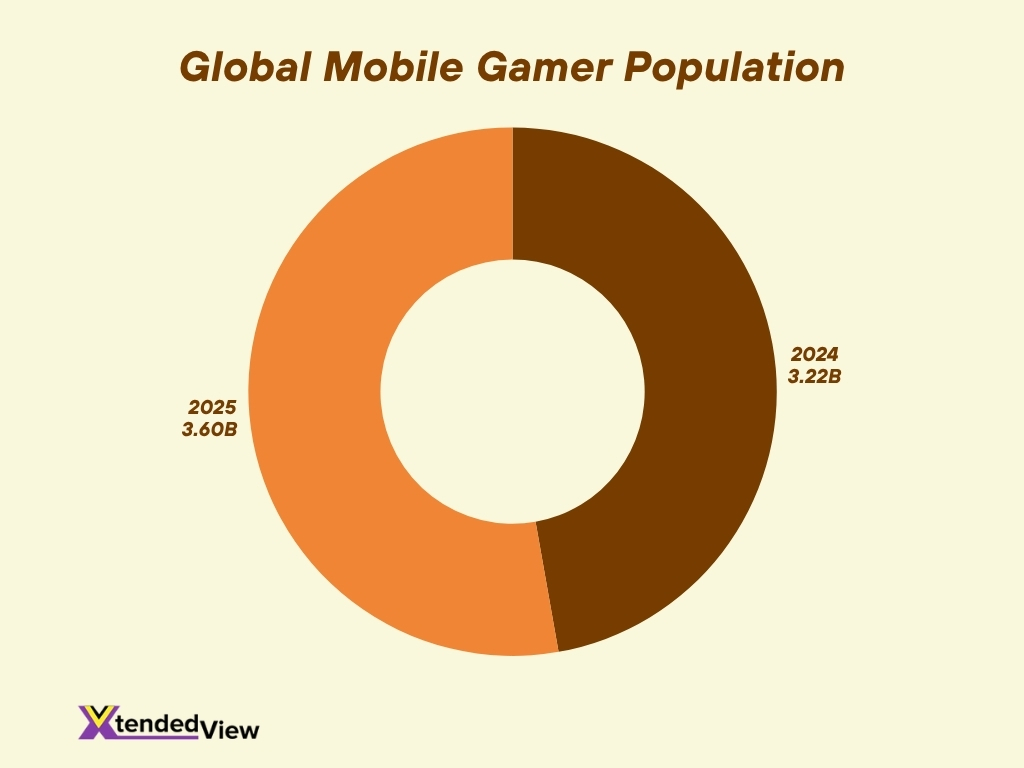
Number of Mobile Gamers Worldwide
- In 2025, there are approximately 3.32 billion active video gamers globally.
- That figure reflects an increase of 100 million from 2024, when there were 3.22 billion.
- One source projects the player base could reach 3.6 billion by 2025.
- The share of everyone who plays mobile games is a majority of the total gaming population; mobile now dominates device usage.
- The growth rate in the number of gamers has slowed compared with the double-digit jumps earlier in the decade, for example, 2023 to 2024 saw approximately +3.1%.
- Emerging markets and increased smartphone penetration continue to drive gamer growth in regions like Asia-Pacific and Latin America.
- The average age of a mobile gamer is about 36 years in some 2025 data sets.
- The mobile gaming demographic is now more evenly divided by gender in many markets, e.g., 53% male, 46.4% female.
Mobile Gaming Revenue Trends
- In 2024, mobile games generated roughly $92 billion in revenue.
- That represented almost half (≈49%) of all gaming revenue in 2024.
- The projected mobile gaming revenue for 2025 is about $103 billion.
- Some reports place the 2025 mobile market at $206 billion, though that figure may include broader associated revenues and vary by source.
- Growth in mobile-game consumer spending is stronger in emerging markets; mature markets show slower growth or plateauing.
- In-app purchases are increasing in many segments, for example, hybrid-casual games reported +37% year-on-year growth in IAP revenue.
- Download volume decline suggests that revenue growth is increasingly driven by monetization per user rather than user number.
- Mobile game advertising spend is forecast to increase, reflecting the diversification of revenue streams beyond just purchases.
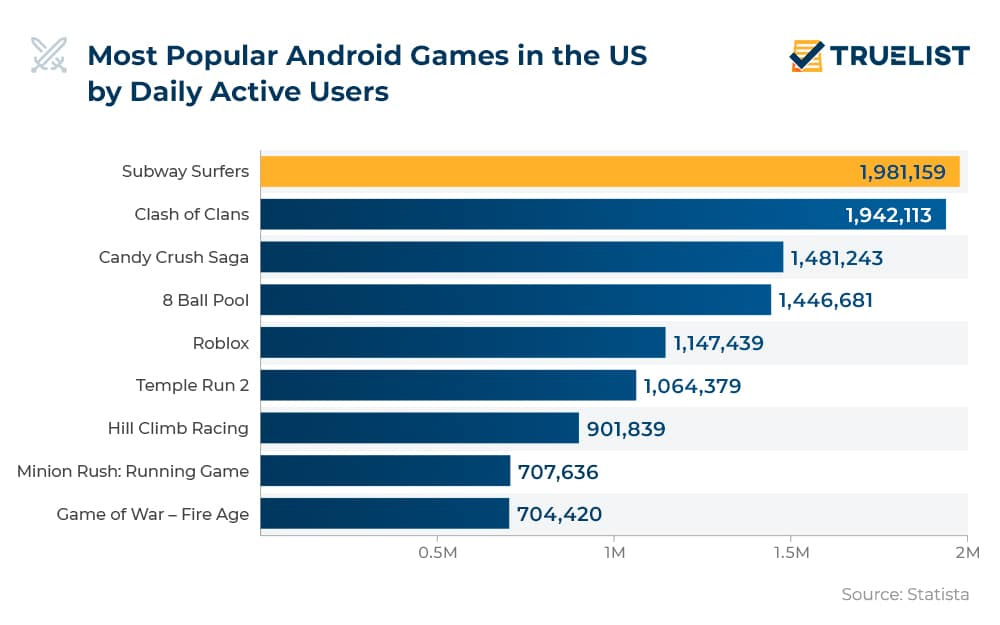
Most Popular Android Games in the US
- Subway Surfers leads the chart with 1,981,159 daily active users, making it the most-played Android game in the US.
- Clash of Clans follows closely with 1,942,113 daily users, showing its long-lasting popularity.
- Candy Crush Saga maintains strong engagement at 1,481,243 users, highlighting its enduring appeal across age groups.
- 8 Ball Pool attracts 1,446,681 daily players, securing a solid position among top mobile games.
- Roblox, a major gaming platform, records 1,147,439 daily active Android users in the US.
- Temple Run 2 continues to stay relevant with 1,064,379 users, despite being a long-running title.
- Hill Climb Racing engages 901,839 players daily, reflecting strong interest in casual racing games.
- Minion Rush: Running Game brings in 707,636 users, benefiting from its recognizable franchise.
- Game of War – Fire Age rounds out the list with 704,420 daily active users, maintaining a dedicated player base.
Highest-Grossing Mobile Games
- The game Honour of Kings is reported as the highest-grossing mobile game of all time, with revenue in the billions.
- In 2024, the top mobile games collectively generated multi-billion dollar revenues, with the leader often earning over $1 billion annually.
- Some strategy titles have broken out recently, signalling a shift away from purely casual genres.
- Emerging market spend is contributing increasingly to top-grossing game revenues.
- Monetization models have evolved; premium downloadable items, subscriptions, season passes, and in-game events now contribute significantly to high-grossing titles.
- The highest-grossing games often combine large user bases, frequent engagement, and diversified monetization funnels.
- While ranking lists vary by geography, the U.S. and China remain dominant markets for consumer spend in top-grossing games.
- Titles that sustain engagement over time often achieve higher lifetime revenues.
Top Mobile Game Genres
- In H1 2025, the strategy genre led globally in player spending with roughly $10.6 billion, including about $2.9 billion in the U.S. alone.
- During the same period, spending on RPGs declined by about 11% year‑on‑year.
- In 2024‑25 data, simulation games registered approximately 9.8 billion downloads, followed closely by puzzle games at 9.7 billion and arcade games at 9.6 billion.
- Puzzle games accounted for around 15% of mobile‑game revenue in major Asian markets.
- Match (match‑3/tile) games achieved an average D30 (day‑30 retention) of 6.6% across iOS and Android in 2025, compared to an industry average of 4.1%.
- Tabletop‑type games reached a D30 retention on Android of 5.1% and on iOS of 8.4% in 2025, highlighting strong engagement in more casual genres.
- Adventure games on Google Play grew monthly downloads by 12.9% between Nov 2024 and Oct 2025, followed by Music (+12.0%) and Strategy (+6.2%).
- Despite saturation in some markets, niche genres (e.g., idle, board‑game hybrids) posted year‑on‑year download growth above +20% in select regions.
- The leading three genres by consumer spend in 2024 were: strategy ($17.5 billion), RPG ($16.8 billion), and puzzle ($12.2 billion).
- Casual and hyper‑casual titles remain top in download volume, though they generate less spend per user compared with strategy or RPG segments.
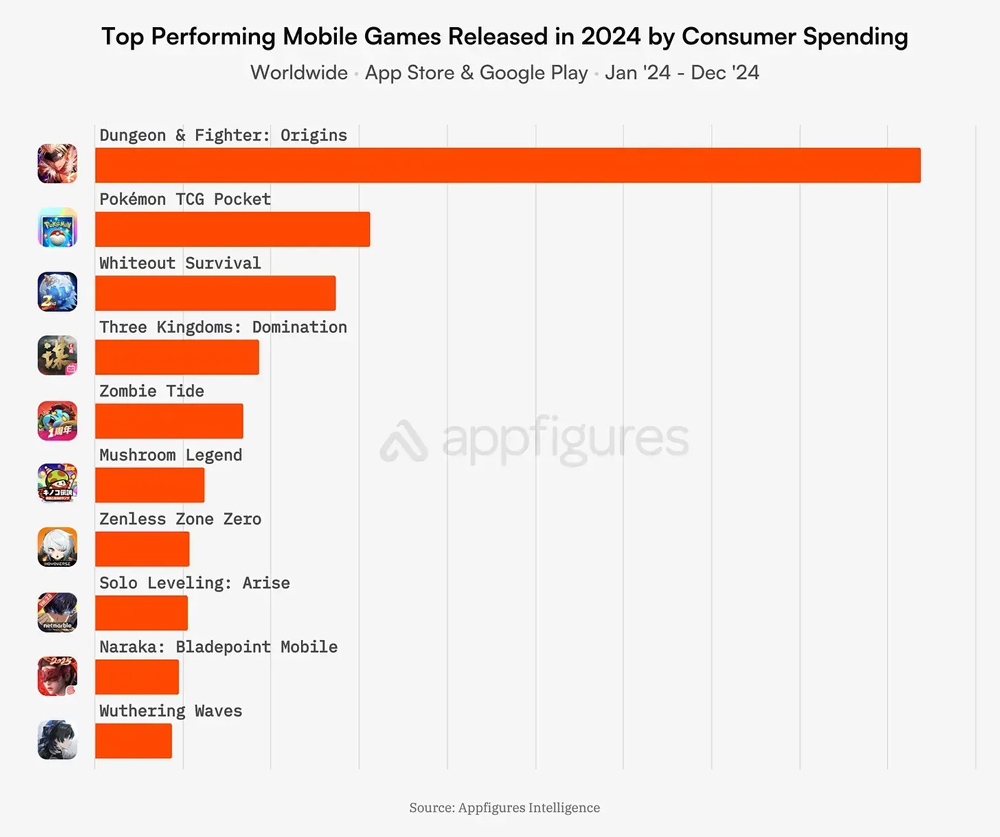
Top-Performing Mobile Games
- Dungeon & Fighter: Origins dominates the chart as the highest-grossing mobile game of 2024, far surpassing all other titles in consumer spending.
- Pokémon TCG Pocket secures the second spot, showing strong global demand for collectible and trading-card gameplay.
- Whiteout Survival ranks third, reflecting the continued popularity of survival-strategy mobile games.
- Three Kingdoms: Domination also performed strongly, leveraging the enduring appeal of historical and strategic warfare themes.
- Zombie Tide generated notable spending, demonstrating that zombie-themed action games remain a consumer favourite.
- Mushroom Legend performed well, highlighting interest in quirky, stylized RPG and fantasy adventures.
- Zenless Zone Zero, despite being a highly anticipated release, places mid-chart in consumer spending for 2024.
- Solo Leveling: Arise, based on a popular webtoon, attracted substantial spending from fans worldwide.
- Naraka: Bladepoint Mobile appears in the lower half of the rankings but still achieved meaningful global revenue.
- Wuthering Waves, another highly discussed release, rounds out the list, showing strong but comparatively lower spending in its launch year.
Demographics of Mobile Gamers
- As of 2025, about 53% of mobile gamers are male and 46% female, indicating near gender parity in many markets.
- The highest‑density age group for mobile game downloads is 18‑24 years old, yet significant populations exist in older segments (25‑34 and 35+).
- In North America, the average age of a mobile gamer is 36 years.
- In India, mobile gaming has grown strongly among users aged 16‑24, often driven by low‑cost smartphones and cheaper data plans.
- Spending habits vary: in 2025, about 77% of mobile‑game revenue globally comes from in‑app purchases (IAPs).
- Among users who spend, a small percentage (“whales”) contribute disproportionately to revenue, while the vast majority spend little or none.
- Female gamers now represent a growing share of time spent and revenue in specific genres (e.g., match‑3, puzzle).
- Emerging markets show younger average gamer age profiles compared with mature markets, partly due to mobile‑first access.
- Smartphones remain the dominant device for mobile gaming – over 90% of the mobile‑gaming audience plays on Android or iOS phones.
Regional Market Share and Growth
- In 2025, mobile gaming is expected to generate about $103 billion globally, representing roughly 55% of the overall games market ($188.8 billion).
- In 2024, mobile games earned approximately $92 billion, equating to 49% of total gaming revenue.
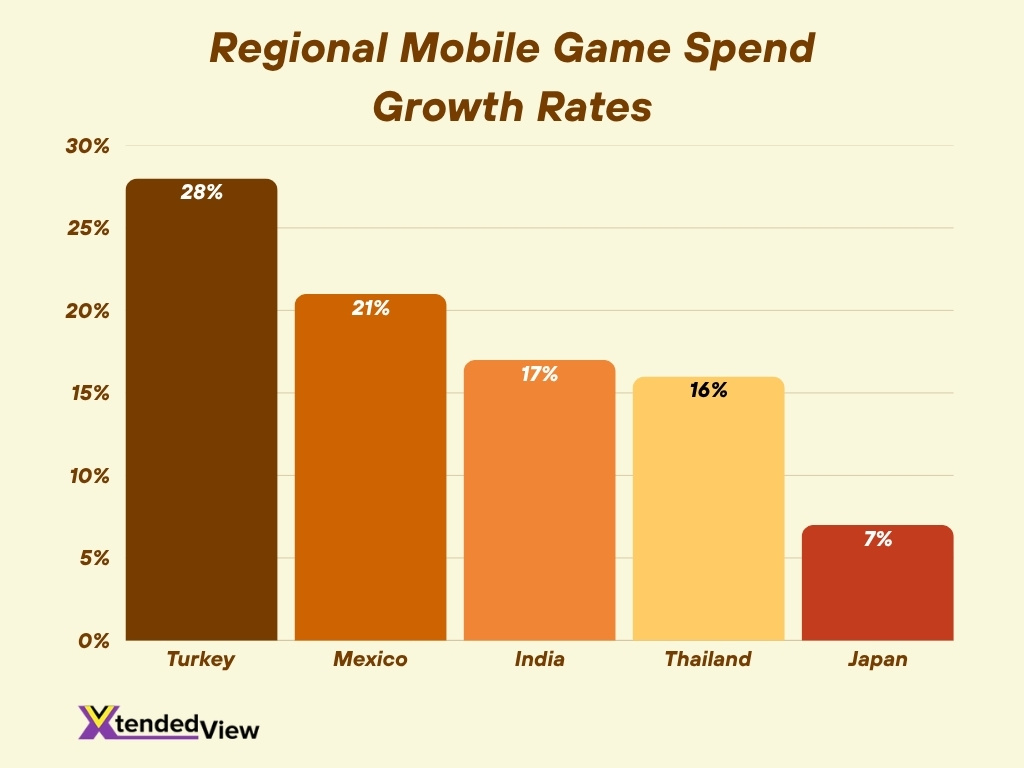
- Growth in emerging markets is strong: Turkey saw consumer spending rise by 28% in 2024, Mexico by 21%, India by 17%, and Thailand by 16%.
- Mature East Asian markets (e.g., Japan) saw declines in downloads, and Japan experienced –7% in spend year‑on‑year in 2024.
- Asia‑Pacific holds the largest regional revenue share in mobile gaming, accounting for over 52% of global mobile‑game revenue in some reports.
- The U.S. and Western Europe continue to contribute significant spend per user, though growth rates are lower than those of emerging regions.
- In Latin America and the Middle East/Africa, smartphone penetration and low‑cost data are driving higher year‑on‑year growth rates (often +15‑30%) in spend and downloads.
- Download volumes in Indonesia and Saudi Arabia increased in 2024, even though global downloads declined overall.
- Regional monetization strategies differ. In Asia, gacha/loot‑box models dominate; in the U.S., subscription and ad‑based models are gaining traction.
Mobile Game Monetization Models
- In‑App Purchases (IAPs) remain the dominant model; 77% of mobile game revenue globally in 2025 derives from IAPs.
- Advertising revenue in mobile games continues to rise, particularly in hyper‑casual and mid‑core titles, though its share is smaller than IAPs.
- Hybrid models (IAP + ads + subscriptions) are increasingly common, allowing developers to diversify revenue across segments.
- The average transaction value in an IAP is now around $7.62, with the highest spenders in the strategy and RPG categories.
- Battle passes are used in nearly 60% of the top‑grossing mobile games and contribute about 22% of total IAP revenue.
- Live events or limited‑time offers drive up to 30% more IAPs during peak promotion weeks.
- Developers face rising user acquisition (UA) costs, making retention and monetization models more critical for profitability.
- Advanced ad‑monetization techniques such as header bidding and RTB (real‑time bidding) are being adopted to increase ad yields.
- In 2025, monetization SEO and analytics are pushing for smarter lifetime value (LTV) modelling to predict high‑spend users early.
In‑App Purchases Statistics
- In 2024, global consumer spending on mobile game IAPs reached approximately $80.9 billion, a year‑on‑year increase of 4%.
- IAPs account for 77% of all mobile game revenue in 2025.
- Among genres, strategy games generated $17.5 billion in IAP revenue, RPGs $16.8 billion, and puzzles $12.2 billion in recent data.
- The average in‑app purchase value is about $7.62 globally.
- Markets experiencing the fastest IAP growth in 2024 include Turkey (+28%), Mexico (+21%), India (+17%), and Thailand (+16%).
- Live‑game features and limited‑time offers boosted IAP volume by up to 30% during promotional periods.
- The conversion rate from free user to paying user remains low (often <5%), but high‑spender cohorts (“whales”) account for disproportionate revenue share.
- In‑app purchases are increasingly being supported by subscription models in mobile games, especially in Western markets.
Mobile Game Advertising Statistics
- The in‑game advertising market in 2024 was valued at approx $9.2 billion, with forecasts projecting growth to $33 billion by 2035 at a CAGR of 12.3%.
- In 2025, the number of advertisers in the North American mobile‑game market reached 80,300, up 25.8% year‑on‑year.
- Upward‑trending game‑category downloads (e.g., Adventure +12.9%) reflect strong user‑acquisition opportunities for mobile‑game advertising.
- Studies show paid‑advertising spend drives both paid installs and organic installs. One analysis found that every $100 spent on ads yielded 37 paid plus 3 organic installs.
- Advanced ad‑monetization technology is increasing yield, and companies are pivoting toward AI‑driven ad‑tech.
- Hyper‑casual titles continue to rely heavily on rewarded‑video ads and interstitials for monetization, reflecting a cost‑efficient UA strategy.
- Creative investment in mobile‑game ads (e.g., playable ads, interactive formats) has grown sharply in 2025 as UA competition rises.
- Although ad‑revenue models are smaller than IAPs overall, they deliver steady income and wider user base reach, especially in non‑paying segments.
App Store Rankings & Insights
- In 2025, Roblox, Candy Crush Saga, and Royal Match consistently ranked in the top 5 grossing apps across both the App Store and Google Play.
- Honor of Kings held the #1 spot for global in-app revenue for much of 2024 and early 2025, driven by strong performance in Asia.
- In the U.S. App Store, Royal Match was among the most downloaded puzzle games and remained in the top 3 grossing iOS titles.
- On Google Play, hyper-casual titles like Subway Surfers and Count Masters dominated download charts, although their monetization rates remain lower.
- The average lifespan of a top-100-ranked mobile game in 2025 is shrinking, with faster turnover due to competition and live-op-driven performance spikes.
- Developers using robust ASO (App Store Optimization) techniques see 20–35% higher visibility, especially when combining metadata refresh with paid UA.
- Top-ranking titles often refresh creative assets (e.g., icon, screenshots) every 30–45 days to sustain install velocity.
- In 2025, metadata A/B testing tools provided by the App Store and Google Play were increasingly used to validate title changes pre-launch.
- Seasonal spikes in app rankings were evident during Q4 2024 and Q1 2025, especially around holidays and global sporting events.
- Games with high D1 and D7 retention rates were statistically more likely to remain in the top 50 rankings longer than games with equivalent download volumes but lower engagement.
User Engagement & Retention Metrics
- In 2024, the global mobile‑gaming in‑app‑purchase (IAP) revenue grew by 4% year‑on‑year, while time spent in mobile games rose 8%, and the number of sessions increased 12%.
- The industry average for day‑30 retention across titles sits around 4.1%, match‑3/puzzle games in some markets reached 6.6% D30.
- Developers report segmentation strategies can triple metrics such as DAU, MAU, and retention by improving user journeys and communications.
- Among top‑grossing mobile titles, live‑ops events and limited‑time content boost engagement metrics by up to 30% during promotion windows.
- Though download volumes declined (6% in 2024), engagement (sessions and time spent) increased, indicating deeper play among fewer new installs.
- In emerging markets, younger audiences (aged 18‑34) show higher average session frequency and shorter inter‑session intervals compared with mature markets.
- The shift toward hybrid monetization (ads + IAPs) has made engagement key; higher session counts correlate with increased ad‑yield and IAP conversion.
- The attrition rate (users dropping off) remains high; some studies show 70% of app‑users fade within one week unless re‑engaged via push/notification campaigns.
Daily and Monthly Active Users (DAU & MAU)
- The global mobile gamer population is projected to be 3.2 billion active users in 2025, rising to 3.5 billion by the end of the year.
- For specific titles, Roblox reportedly had 129.7 million MAU and 76 million DAU as of mid‑2025.
- Some mobile games register an average of 4+ sessions per day, especially across casual/puzzle genres.
- In Western markets, average session length for mobile games grew 8% in 2024 vs 2023, aligned with broader time‑spent increases.
- In the Indian market, mobile‑game installs in FY 2024‑25 hit 8.45 billion, pointing to large potential DAU and MAU development.
- While DAU/MAU are key metrics, developers increasingly focus on stickiness (sessions per user, retention) rather than just raw install numbers.
- Many hyper‑casual titles achieve high MAU, but lower pay‑user conversion; mid‑core titles trade somewhat lower MAU for higher monetization.
- The MAU to DAU ratio (indicative of frequency) remains a key health metric; healthy games aim for 20‑30% of MAU active daily, though specific public benchmarks vary.
Top Mobile Game Publishers
- According to 2025 data, many publishers are now crossing 2 billion cumulative downloads across portfolios, e.g., Homa hit that milestone.
- The mobile game publisher landscape remains concentrated; a handful of companies control many of the top‑grossing and top‑downloaded titles.
- Leading publishers generate billions of $in revenue annually, and some exceed $1 billion+ in yearly mobile‑game revenue.
- Publishers are increasingly leveraging hybrid‑casual and mid‑core strategies to expand beyond hyper‑casual.
- Acquisition activity is rising, scale, global reach, and live‑ops capabilities are driving consolidation in the publishing space.
- Many publishers now operate global live‑ops studios with localization teams, region‑specific content, and in‑game event calendars aligned across geos.
- The ability to manage UA (user acquisition) costs, retention funnels, and monetization performance is a differentiator among top publishers.
- Publisher performance is increasingly measured not only by downloads but by average revenue per user (ARPU), retention curves, and user‑lifetime value (LTV).
Mobile Esports and Competitive Gaming
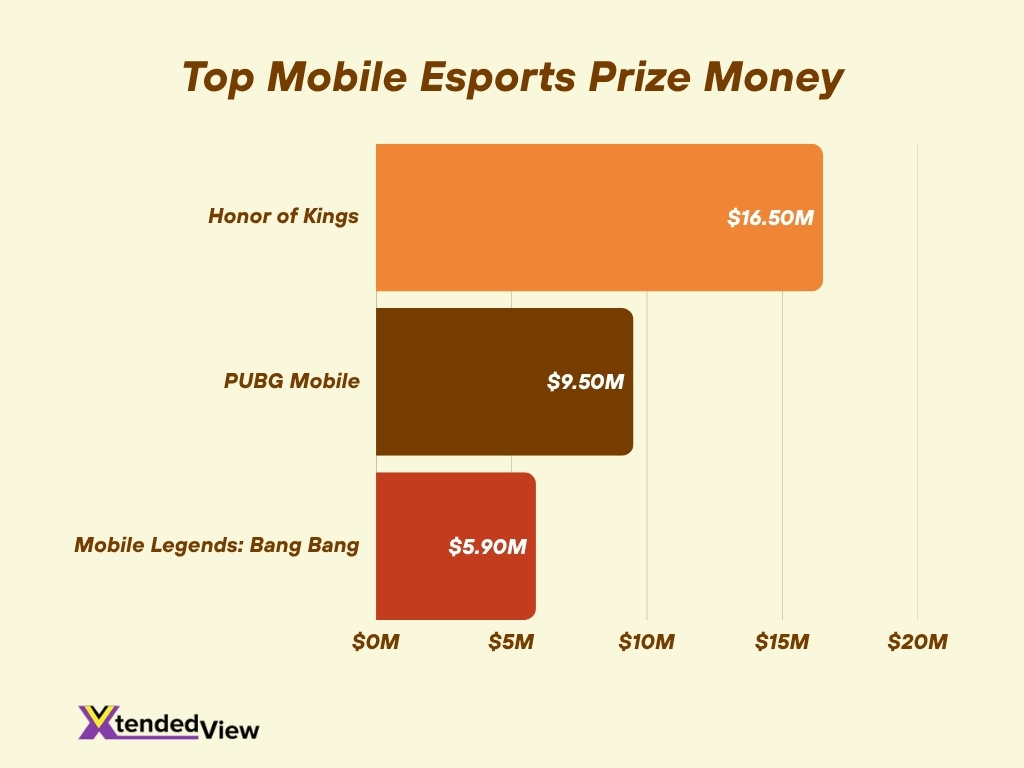
- The top mobile esports titles by prize money in 2025 include Honor of Kings ($16.5 m), PUBG Mobile ($9.5 m), and Mobile Legends: Bang Bang ($5.9 m).
- The global mobile esports ecosystem runs thousands of tournaments annually; one dataset shows 12,675 tournaments in 2025 in the mobile category.
- Viewership for mobile esports events is growing; some titles record peak live audiences in the millions.
- Brands and sponsors are increasingly targeting mobile esports, particularly in emerging markets such as Southeast Asia and Latin America, where mobile gaming is dominant.
- Esports titles on mobile often monetize via skins, event passes, and season systems, blurring lines between gaming and competitive entertainment rather than pure tournament prize structures.
- The integration of mobile games with live streaming, social sharing, and creator networks is reinforcing mobile esports as a growth area.
- Despite growth, mobile esports prize pools remain significantly smaller than PC/console equivalents, but the user‑engagement scale and accessibility of mobile provide offsetting advantages.
Future Trends in Mobile Gaming
- The mobile gaming segment appears to be entering a maturing phase, while total downloads have declined, deeper engagement and monetization are now the focus.
- Emerging markets will continue to drive growth, for example, India’s installed base and lower‑cost smartphone access point, to strong upside.
- The rise of AR/VR and metaverse‑style experiences on mobile may become more prominent, especially as hardware and 5G penetration improve.
- Platform fragmentation, cloud gaming on mobile, and cross‑play between mobile/PC/console will influence how titles are developed and monetized.
- Monetization models will evolve further, with more subscription models, season passes, and creator‑driven economies (user‑generated content) expected.
- Data‑driven personalization (using AI/ML) to tailor game offers, content, and monetization to segments will deepen.
- Ad monetization will grow more sophisticated (header bidding, playable ads, interactive formats), especially for non‑paying users and hybrid monetization.
- As retention and session metrics become more critical, developers will invest more in post‑launch live‑ops, creative updates, and community building to maximize lifetime value.
Conclusion
The mobile gaming industry remains a powerful force, with billions of users, significant revenue flows, and expanding global reach. While growth in new downloads may be slowing, the emphasis has shifted toward retention, deeper engagement, diversified monetization, and emerging‑market expansion. Strategic publishers are leveraging live‑ops, creator economies, and cross‑platform experiences to sustain momentum.
Whether you’re a developer, marketer, or industry observer, the challenge now is less about getting users in the door and more about keeping them playing, spending, and sharing. Explore the full article above to dive into the data behind these trends and understand where the mobile‑gaming market is headed.