
Microsoft Corporation finds itself at the intersection of cloud‑scale expansion and desktop‑software legacy. Its influence spans both global enterprises deploying AI‑powered cloud services and everyday consumers relying on its operating systems and productivity suites. For example, businesses adopting Microsoft Azure capabilities are gaining competitive efficiency in digital transformation, while millions of home users upgrading to Windows 11 signal the company’s persistent reach into consumer computing. Let’s explore the numbers behind Microsoft’s performance and market presence.
Editor’s Choice
- Microsoft reported $281.7 billion in annual revenue for fiscal year 2025, up 15 % from the previous year.
- The company’s net income for FY2025 rose 16 % to $101.8 billion.
- Microsoft Cloud (including Azure) surpassed $168 billion in revenue, growing 23 %.
- Worldwide desktop operating systems: Windows holds about 71.9 % share as of mid‑2025.
- As of July 2025, Windows 11 overtook Windows 10 in global desktop OS share, capturing 52 %.
- In FY2025, U.S. revenue grew 15.9 % (to $144.6 billion), and non‑U.S. revenue grew 13.9 % (to $137.2 billion).
- Microsoft’s market capitalization reached the $4 trillion milestone in mid‑2025, placing it among the world’s largest companies.
Recent Developments
- In its Q4 report ending June 30, 2025, Microsoft generated $76.4 billion in revenue, an 18 % increase year‑over‑year.
- The Intelligent Cloud segment’s operating income rose 17 % in FY2025 compared to FY2024.
- Microsoft intensified its AI and cloud infrastructure investment, citing “scale unlike anything we’ve seen” during the FY2025 investor call.
- The upcoming end‑of‑support date for Windows 10 (October 2025) accelerated users shifting toward Windows 11.
- Global PC shipments under Windows‑only devices are forecast to grow 6.4 % in 2025, even as U.S. consumer shipments may decline 2.5 %.
- Microsoft’s revenue from regions outside the U.S. increased by $16.8 billion year‑over‑year in FY2025.
- The company’s brand value in 2023 reached $713 billion, up 42 % from 2022.
- Research and development spending reached $29 billion in 2024, placing Microsoft among the highest R&D spenders globally.
Overview of Microsoft Corporation
- Founded in 1975, Microsoft today operates across three major segments: Productivity & Business Processes, Intelligent Cloud, and More Personal Computing.
- As of FY2025, Microsoft employed approximately 228,000 full‑time staff globally.
- Microsoft is headquartered in Redmond, Washington, and serves customers in more than 190 countries.
- The company’s product portfolio extends from OS software (Windows), productivity suites (Office/365), cloud infrastructure (Azure), developer tools (GitHub), to gaming (Xbox).
- In FY2025, the company’s total assets and investments in data centers and AI infrastructure surged, reflecting a strategic shift toward cloud and AI.
- Microsoft’s market cap crossed $4 trillion in 2025, underscoring investor confidence in its long‑term growth trajectory.
- The company’s global footprint means that U.S. revenue still accounts for a slight majority, but international growth is increasingly significant.
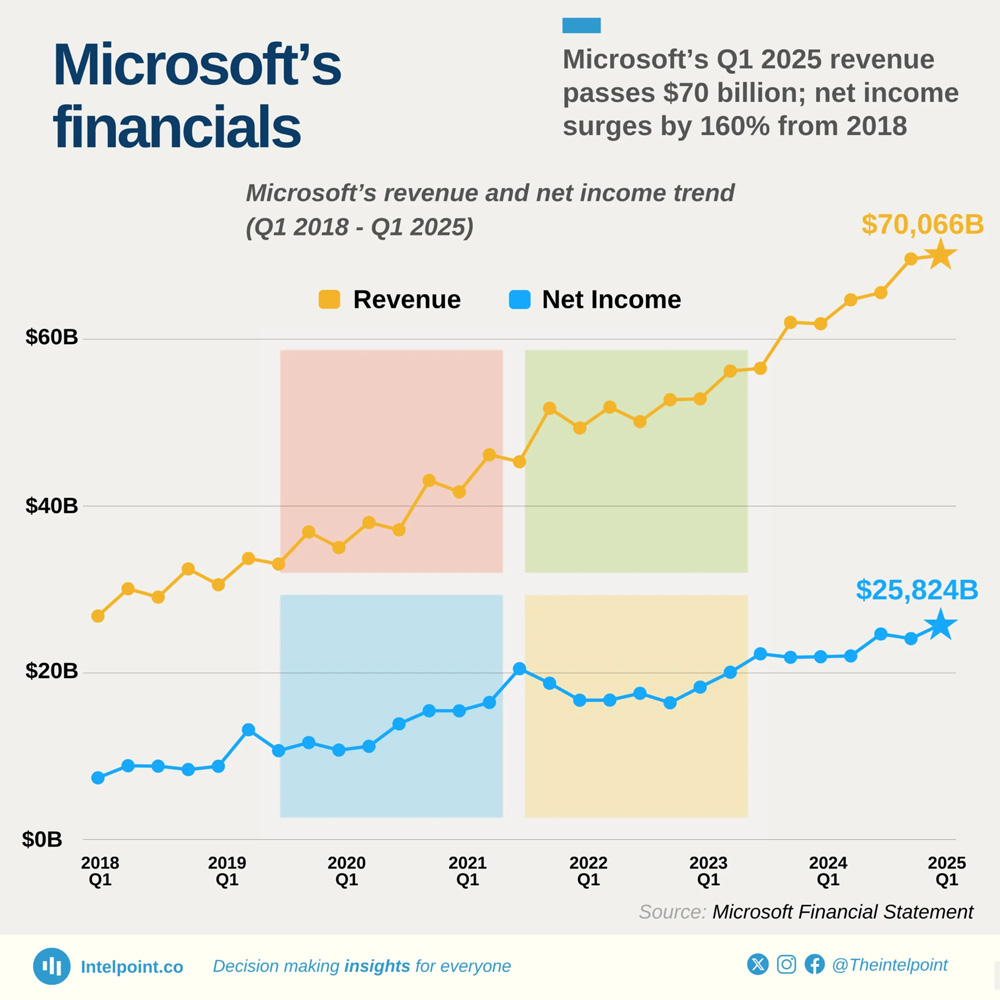
Microsoft Revenue and Financial Highlights
- Revenue shows a strong upward trajectory, rising from around $26–28B in early 2018 to a record $70.066B in Q1 2025.
- Microsoft’s Q1 2025 revenue surpasses $70B, marking an all-time high.
- Net income also demonstrates significant long-term growth, increasing from roughly $7–9B in 2018 to $25.824B in Q1 2025.
- This represents a 160% surge in net income since 2018, showcasing improved profitability.
- Revenue growth remains steady over time, with noticeable acceleration starting around 2023, pushing into 2024–2025.
- Net income is more variable year-to-year but shows consistent upward movement with a major peak around 2021, followed by stabilization and renewed growth.
- The chart highlights four key periods with different trend shifts (2018–2019, 2020–2021, 2021–2023, 2023–2025), each showing rising overall performance.
- Microsoft’s financial trajectory underscores strong market positioning and sustained business expansion.
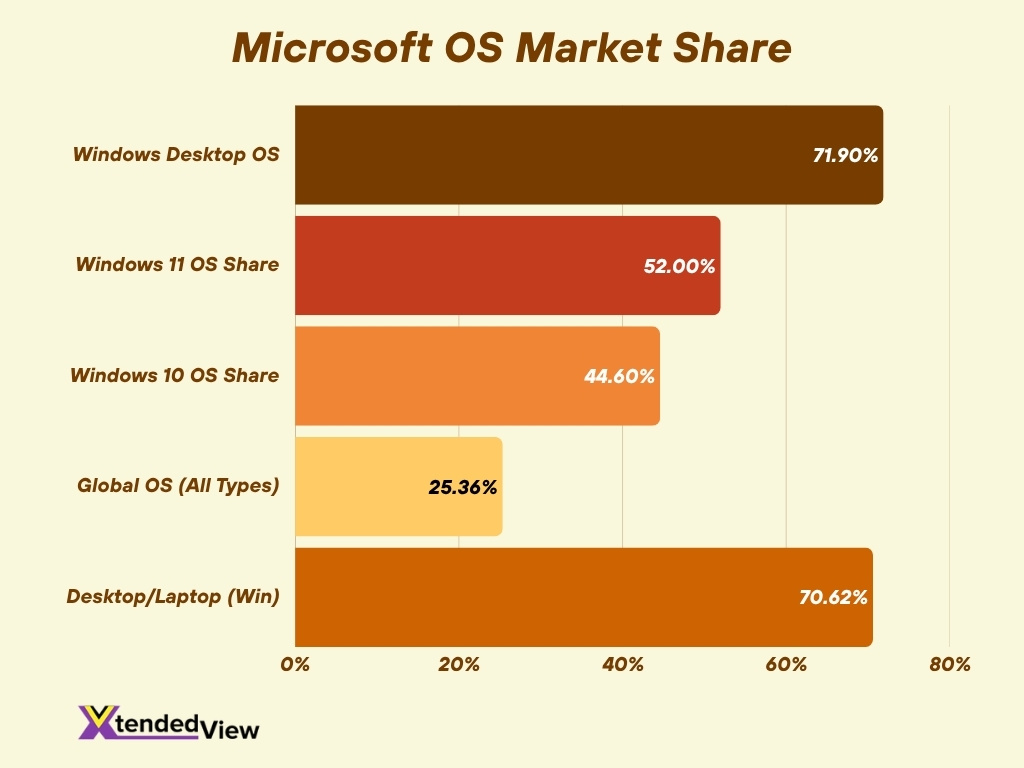
Market Share of Microsoft Products
- Worldwide desktop OS market share for Windows is 71.9 % (mid‑2025) in the desktop segment.
- As of July 2025, Windows 11 has overtaken Windows 10, capturing 52 % of the Windows desktop OS share.
- Windows 10, once dominant, dropped to 44.6 % of the Windows desktop OS market by July 2025.
- In February 2025 global OS market (all device types), Windows held 25.36 %.
- Microsoft’s desktop OS share (desktops/laptops only) is estimated at 70.62 % for 2025.
- Microsoft’s server‑and‑desktop OS product data shows a relatively small reported execution share in the 6sense dataset (1.21 % in a particular “server‑and‑desktop OS” category), but this appears to conflict with broader market‑share estimates.
- Market share gains of Windows 11 reflect the hardware‑upgrade cycle and end‑of‑support for Windows 10 in October 2025.
- Worldwide PC device shipment forecasts for Windows‑only devices show 6.4 % growth globally in 2025, supporting continued share for Microsoft‑branded OS.
Windows Operating System Statistics
- As of July 2025, Windows 11 captured 52 % of the global Windows desktop OS share, surpassing Windows 10 (44.6 %).
- In June 2025, Windows 11 jumped from 43.22 % to 47.98 % (+4.76 points) among Windows OS versions.
- As of January 2025, Windows 10 held 60.37 % and Windows 11 36.6 % of the Windows desktop OS market.
- Global desktop OS share for Windows (all versions) remains around 70.62 % per recent data.
- Windows 10 support ends October 14, 2025, driving installations of Windows 11.
- Some analysts expected negative growth in consumer Windows shipments in 2025 in the U.S. (‑2.5 %) but growth in commercial (+8.1 %) shipments.
- The transition to Windows 11 is accelerated by Microsoft’s hardware requirement prompts and upgrade offers.
- Windows still controls over 70 % of desktop OS usage, reinforcing Microsoft’s sustained dominance on PCs.
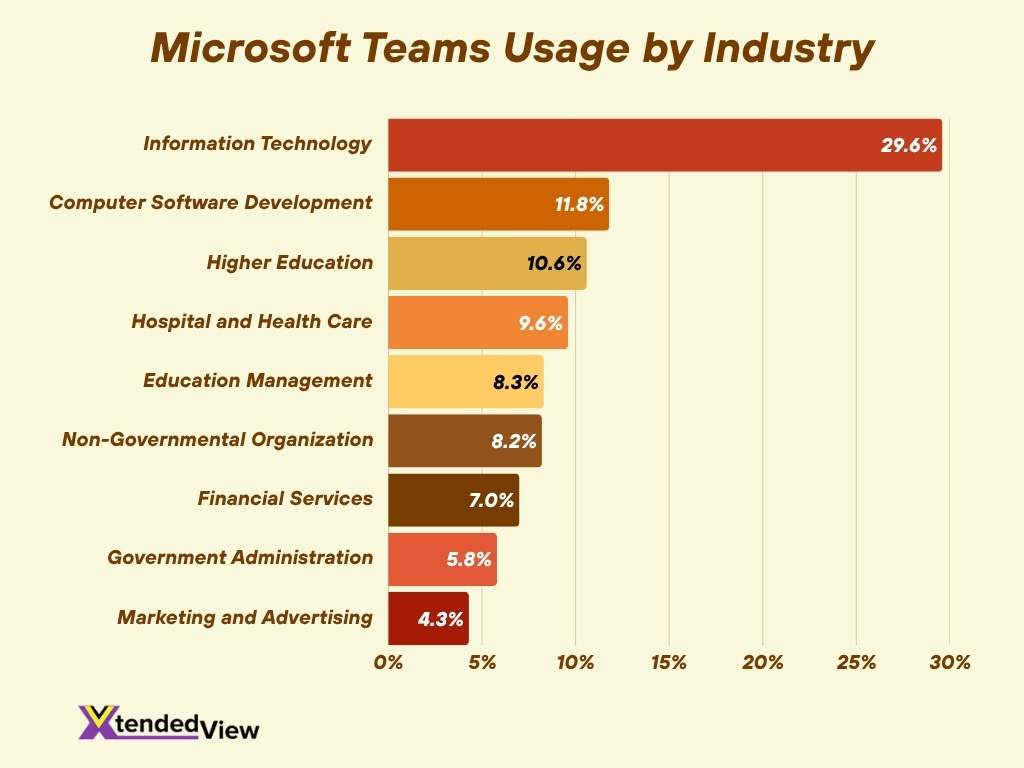
Microsoft Teams Usage by Industry
- Information Technology leads with 29.6%, making it the dominant sector using Microsoft Teams.
- Computer Software Development follows at 11.8%, showing strong adoption within tech-driven organizations.
- Higher Education accounts for 10.6%, reflecting widespread use in universities and academic institutions.
- Hospital and Health Care represents 9.6%, highlighting the platform’s role in clinical coordination and patient-facing communication.
- Education Management and Non-Governmental Organizations (NGOs) contribute 8.3% and 8.2%, respectively, demonstrating broad usage in service-oriented sectors.
- Financial Services makes up 7%, indicating steady uptake in a highly regulated industry.
- Government Administration stands at 5.8%, showing continued adoption within public-sector operations.
- Marketing and advertising have the lowest representation at 4.3%, though still notable among creative industries.
Microsoft Azure and Cloud Services Stats
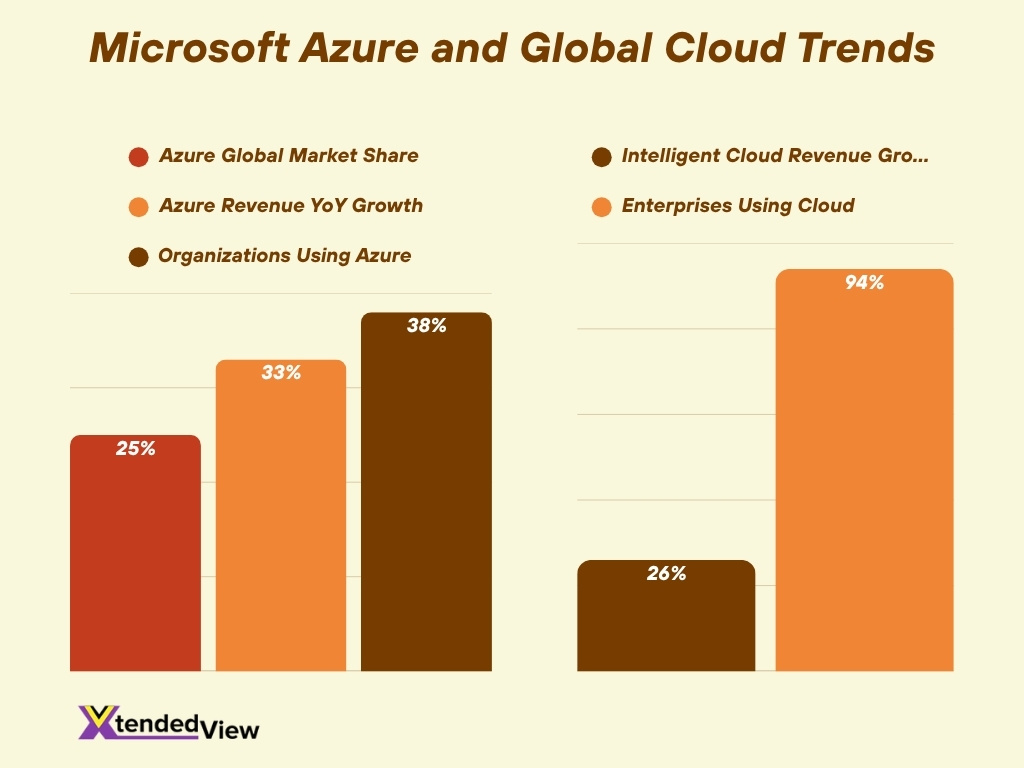
- In Q2 2025, Microsoft Azure held an estimated 20 % share of the global cloud infrastructure services market.
- In Q1 2025, Azure revenue grew approximately 33% YoY, with its share approaching 25% of the global cloud market.
- Microsoft’s broader “Intelligent Cloud” division saw revenue growth of 26 % in recent quarters.
- Around 38% of organizations worldwide reportedly use Azure.
- The global public cloud infrastructure services market hit $99 billion in Q2 2025, up over $20 billion from the prior year.
- Over 94% of enterprises use cloud services in some form.
- Analysts expect annual growth for cloud‑infrastructure services to remain above 20% over the next five years.
- Azure’s consulting services market is forecast to grow at a CAGR of 18.5% from 2024‑2030.
- Microsoft has added large‑scale data‑centre capacity (e.g., 2 GW in one announcement) to support Azure’s growth.
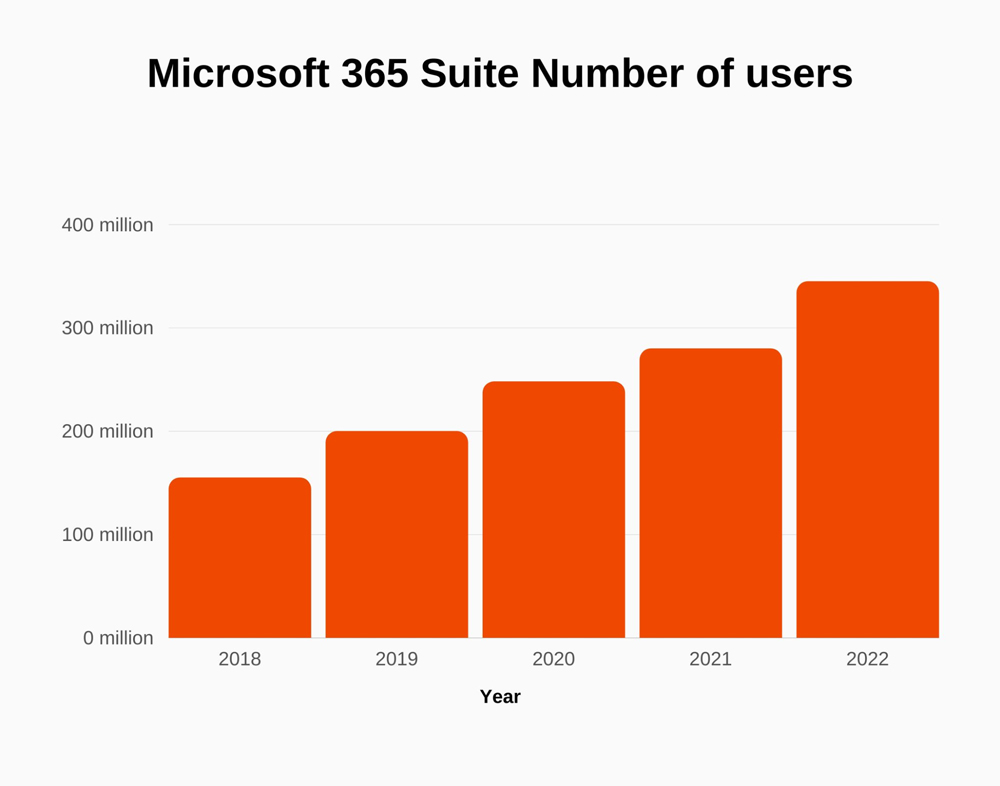
Microsoft 365 Suite User Growth
- Steady year-over-year growth from 2018 to 2022, showing strong and increasing adoption of Microsoft 365.
- In 2018, the user base was around 150 million.
- By 2019, usage grew to approximately 200 million, marking a significant increase of 50 million users.
- In 2020, the number climbed to about 250 million, reflecting the rising demand during remote-work expansion.
- 2021 continued the trend with roughly 280 million users, showing sustained momentum.
- 2022 reached the highest point at around 345 million users, demonstrating robust long-term adoption and expanding market reach.
Microsoft Teams & Productivity Statistics
- Microsoft Teams reported over 320 million users worldwide in 2024.
- As of May 2025, Teams Phone had 80 million users globally, with over 20 million PSTN users.
- Teams commands approximately 32.3% of the global video‑conferencing market.
- About 93% of Fortune 100 companies rely on Teams.
- Admin usage reports allow organizations to track active users, channels, and meeting usage.
- Interruptions via Teams notifications highlight the need for focus‑work tools.
- Uptake of premium features like Teams Premium is growing.
- The retirement of Skype in May 2025 reinforces Teams as the central collaboration hub.
Gaming and Xbox Statistics
- The Xbox ecosystem reported 500 million active users in 2025, more than double the 200 million recorded in 2024.
- In FY 25 Q4, Xbox gaming revenue rose 10% year‑over‑year, with content and services up 13% in the quarter.
- Subscription revenue from Game Pass crossed “nearly $5 billion” in annual revenue for the first time.
- Hardware revenue for Xbox saw a decline of 22% in the same quarter.
- Xbox Cloud Gaming is available on over 100 million devices, including smart TVs, streaming sticks, and VR headsets.
- Globally, the gaming console market revenue is projected to reach $26.7 billion by 2029, with Xbox capturing 23% share of the console hardware market.
- Digital and subscription‑based gaming content now contributes a rising share of gaming revenue, while physical software remains flat or declining.
- Xbox’s strategy emphasises “play‑on‑any‑screen,” including console, PC, and cloud – a shift from hardware‑only models.
- Despite strong service growth, Microsoft has announced layoffs in its Xbox/division and is shifting resources toward content and cross‑platform services.
Device Shipments (PC, Tablets, etc.)
- Global PC shipments (desktops, notebooks, workstations) grew 7.4% in Q2 2025 to 67.6 million units.
- Notebook shipments in Q2 2025 were 53.9 million units (+7% yr/yr), desktops 13.7 million units (+9%).
- The overall Personal Computing Device (PC + tablet) market posted 9.3% growth in Q2 2025, with PC shipments of 107.1 million units.
- Tablet shipments grew 13.1% in the same period to 38.3 million units.
- In the U.S., however, PC shipments dipped 1.4% in Q2 2025 to 18.6 million units.
- Industry‑wide, tablets are forecast to grow from $108.3 billion in 2024 to $114.7 billion in 2025 (5.9% CAGR).
- The upcoming end‑of‑support for Windows 10 (October 2025) is expected to drive enterprise PC upgrade cycles and affect shipment dynamics.
- Microsoft’s own device segment (e.g., Surface) notes that “growth in Devices is dependent on total PC shipments, the ability to attract new customers, and expanding into new categories.
- Emerging markets show stronger growth in device shipments compared to mature markets, offering potential upside.
Geographic Distribution of Microsoft Users
- For fiscal year 2025, Microsoft’s income before income taxes: U.S. $$69.2 billion, foreign $$54.4 billion, showing significant global demand.
- Microsoft reports customers in more than 190 countries, spanning individual consumers, small & medium organisations, large global enterprises, and the public sector.
- The geographic mix shift is influencing Microsoft’s tax rate and operating‑model disclosures, with a foreign income proportion rising.
- The company’s global infrastructure now supports in‑country data processing for customers in multiple regions, enhancing regional governance and local adoption.
- In‑country data processing for Microsoft 365 Copilot is available or being rolled out in 15 countries by the end of 2025, expanding local trust and adoption.
- Microsoft notes that Latin America, Asia‑Pacific, and EMEA regions represent a growing share of its commercial cloud and productivity business.
- Emerging‑market users increasingly drive growth in productivity, cloud, and device segments, while mature markets still contribute the majority of revenue.
- Data‑centre expansion across more regions supports local performance and regulatory compliance, reinforcing Microsoft’s global user distribution.
Microsoft in the Enterprise & Business Sector
- Microsoft supports over 1.5 million security customers worldwide.
- 85% of enterprise organisations plan to increase investments in Microsoft cloud and AI solutions in 2025.
- Deal size is growing year‑over‑year with more enterprise upselling.
- Traditional on‑premises customers are transitioning to SaaS offerings.
- Microsoft was named a Leader in The Forrester Wave for CRM in Q1 2025.
- Enterprise subscription prices rose 5 % as of April 1, 2025.
- Microsoft is now seen as an end‑to‑end enterprise platform provider.
- Growth in the enterprise sector is a core pillar of Microsoft’s expansion.
Security and Privacy Statistics
- More than 1.5 million security customers globally.
- 53% of leaders say productivity must increase, and 80% of employees feel they lack time or energy.
- ESG disclosures show transparency via Microsoft Sustainability Manager.
- Integrated security is embedded across Azure, Microsoft 365, and Windows.
- Large enterprise deals increasingly include advanced security and compliance modules.
- Security is a sticky selling point and part of Microsoft’s trust framework.
- Emphasis on risk management, identity protection, and asset resilience is central to the company’s offerings.
Research & Innovation Metrics
- Over $29 billion spent on research & development.
- Microsoft’s “Frontier Firm” concept supports human-AI collaboration.
- Internal employee-feedback platforms support product innovation.
- Every Azure region is now AI‑first.
- Copilot seats now surpass 100 million monthly active users.
- Partner ecosystem shows cross-product innovation success.
- Microsoft leads in CRM and business applications.
- Investments in AI infrastructure and custom hardware show long‑term commitment.
Environmental, Social & Governance (ESG) Data
- Contracted 21.9 million metric tons of carbon removals in FY24.
- Achieved 88.1% waste‑diversion for operational waste.
- Aims to be carbon negative, water positive, and zero waste by 2030.
- ESG rating of “MSCI AA” and 1.4 °C climate alignment.
- Global workforce of 228,000 employees.
- Microsoft Sustainability Manager supports ESG data tracking.
- 90.9% of servers and hardware components were reused.
- ESG performance supports enterprise partnerships.
Microsoft Employee and Workforce Stats
- 228,000 employees globally as of June 30, 2025.
- 125,000 in the U.S., 103,000 internationally.
- The workforce grew by 3.17% from 2023 to 2024.
- Microsoft laid off 9,000 employees in July 2025.
- Women represent 31.6% of the workforce, 27.2% in technical roles.
- Revenue per employee is $1.29 million.
- Machine-learning feedback from employees helps shape internal programs.
- Microsoft emphasizes stability and scale in workforce strategy.
Global Competitive Position
- Microsoft executes well across productivity, cloud, and business applications.
- Azure grew 39% YoY in Q4 FY25.
- Microsoft’s integrated enterprise stack gives it a competitive edge.
- High ESG ratings support customer trust.
- Converged services across security, cloud, and AI expand its moat.
- Competition remains strong, but Microsoft has a global advantage.
- Operations in over 190 countries and multi-regional datacenters ensure scale.
- 5% subscription price increase reflects demand confidence.
Frequently Asked Questions (FAQs)
Microsoft generated $281.72 billion in revenue for fiscal year 2025.
Microsoft Cloud revenue in Q4 rose by 27% year‑over‑year.
The United States accounted for 51.31% of Microsoft’s total revenue in fiscal 2025.
Microsoft’s net income was $101.8 billion, up 16% compared to the prior year.
According to their 2025 Work Trend Index, 53% of business leaders say productivity must increase, while 80% of the global workforce says they lack enough time or energy.
Conclusion
Microsoft stands at a pivotal moment; its breadth across cloud infrastructure, productivity suites, enterprise applications, and security services has converged into a unified platform offering. The statistics show that Microsoft is not just growing, it is deepening its enterprise engagements, scaling research and innovation, and embedding ESG commitments into its operations.
Enterprise customers increasingly view Microsoft as a strategic partner, and Microsoft’s workforce and global footprint support that ambition. As cloud, AI, and sustainability become non‑negotiable for businesses, Microsoft’s competitive positioning looks robust, though innovation and execution will remain key.