
The competition between the iPhone and Android ecosystems remains a defining theme in the mobile‑device market. From how many users each platform has to where those users are located and how they engage with apps, the data paints a vivid picture of where mobile‑technology trends are headed. Industries such as mobile‑app development and digital advertising rely on these insights to decide platform priorities and monetisation strategies. Likewise, smartphone hardware makers weigh this data when planning device line‑ups and regional launches.
Editor’s Choice
- Globally, Android holds around 72.13% of the mobile OS market in 2025, while iOS covers about 27.48%.
- In the U.S., iOS leads with approximately 57.97% of the smartphone market in 2025.
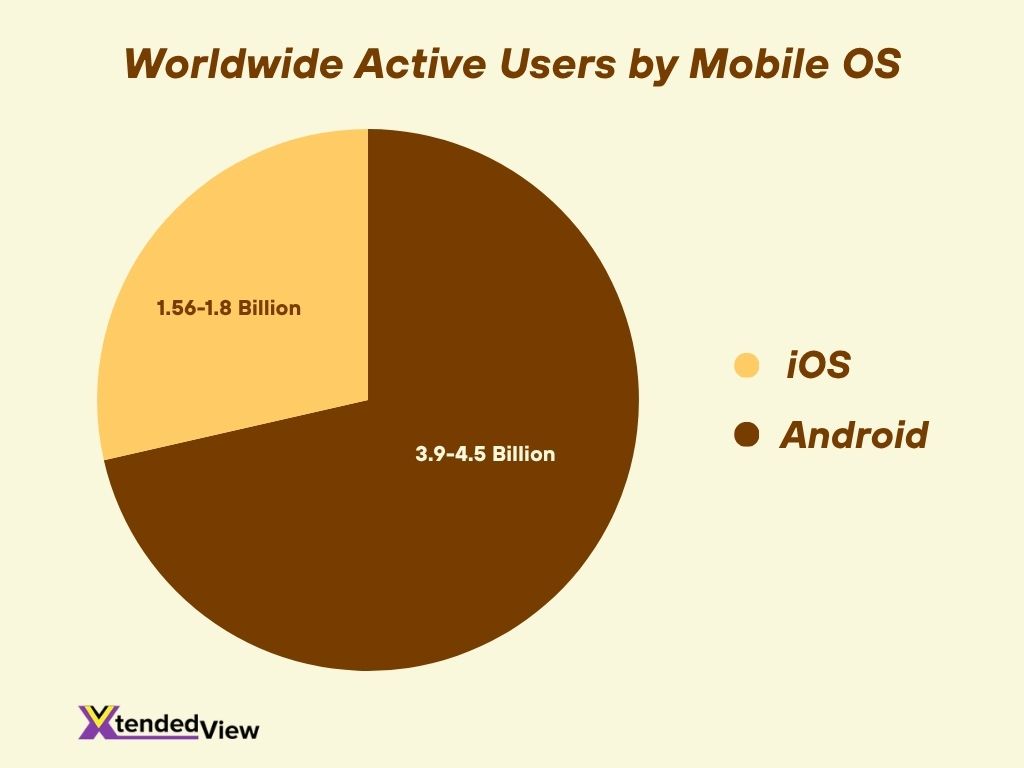
- Android powers an estimated 3.9 to 4.5 billion active users worldwide in 2025, and iOS holds about 1.56 to 1.8 billion.
- Together, iOS and Android represent more than 97% of global smartphone OS share.
- In major populous nations, in India, iPhone’s share is only 4%, Android sits at over 95%.
- The combined number of smartphone users worldwide rose to around 4.88 billion by 2024, up 115% since 2019.
- In the Google Play Store vs Apple’s App Store: as of mid‑2025, Google Play hosts 2.03 million apps, Apple’s App Store hosts 1.9 million.
Recent Developments
- The global smartphone market grew only 1.0% year‑over‑year in Q2 2025, reaching 295.2 million units shipped.
- In many regions, Android’s dominance is consolidating while iOS maintains strong footholds in premium markets.
- Emerging markets (e.g., India, Africa) remain strongholds for Android due to device affordability and brand variety.
- iOS continues to lead in high‑income countries and urban centres where brand and ecosystem matter more.
- The duopoly of iOS and Android remains intact; other OSs have a negligible share.
- Developers and advertisers increasingly segment strategies: iOS for premium spenders, Android for scale.
- Device innovation (foldables, AI features) and OS updates are becoming key differentiators in platform adoption.
- In mid‑2025, iOS version rollout showed 58% of users on iOS 18 by the end of October.
Global Market Share: iPhone vs Android
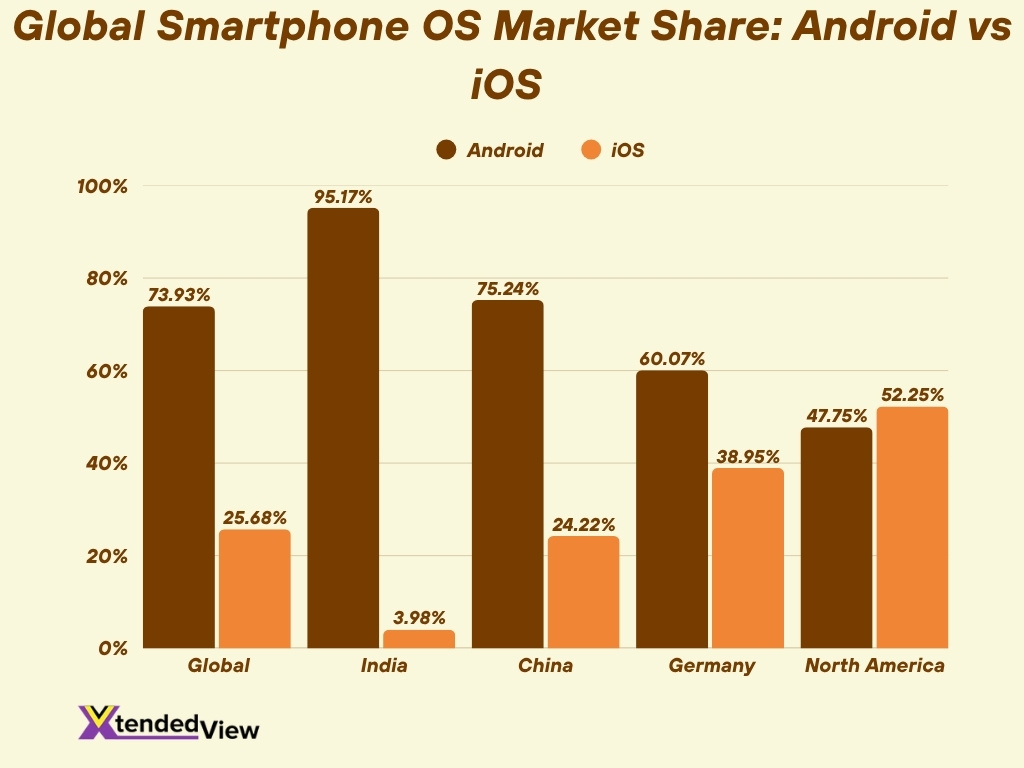
- As of August 2025, Android holds 73.93% of the mobile‑OS market worldwide, iOS 25.68%.
- Other sources record Android at 72.46% and iOS at 27.13% globally in 2025.
- In 2024, Android’s share hovered around 70.93%, iOS around 29.07%.
- In countries like India, iOS shares 3.98% while Android shares 95.17%.
- In China, iPhone share 24.22%, Android 75.24%.
- In Germany, iOS 38.95%, Android 60.07%.
- iOS holds a stronger share in North America (52.25%) while Android leads elsewhere.
- iOS and Android together constitute >97% of the OS market globally.
U.S. Market Share Comparison
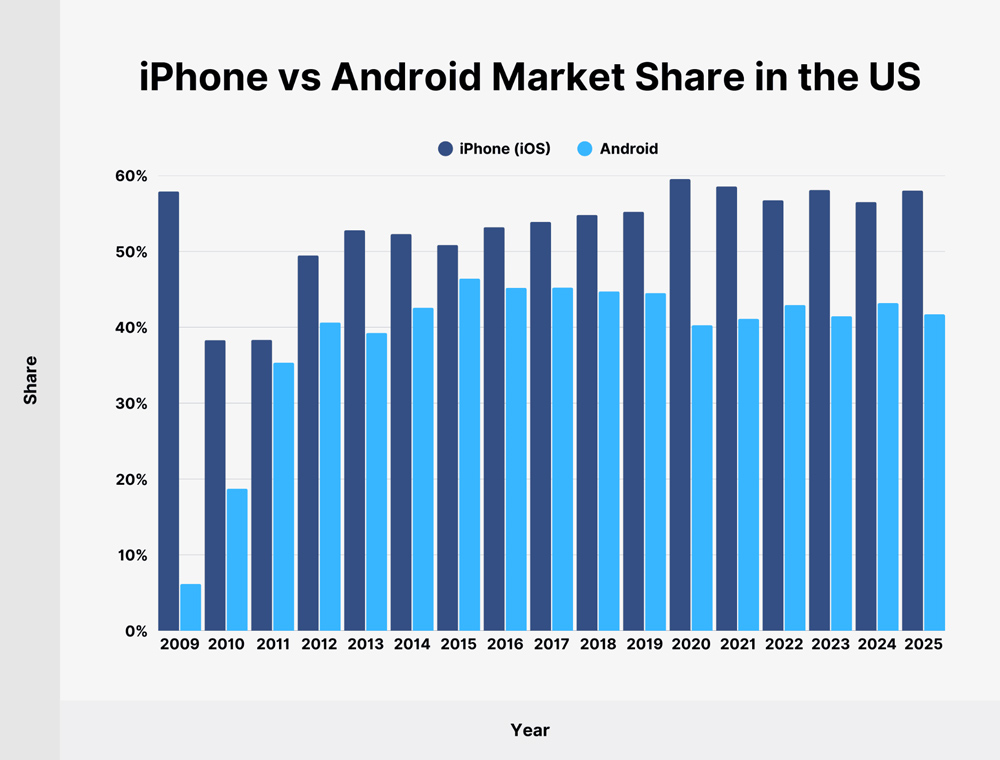
- iPhone (iOS) has maintained a consistent lead over Android in the US market for most years since 2012.
- In 2009, iPhone’s share was around 58%, while Android was still emerging at below 10%.
- Android’s market share grew rapidly between 2010 and 2014, rising from 18% to over 40%, signalling its initial expansion period.
- From 2015 onward, both platforms reached a period of stabilisation, with iPhone holding around 53–59% and Android staying between 40–45%.
- The highest iPhone share appears around 2020, reaching close to 59%, coinciding with the rise of 5G-enabled iPhones.
- Android’s share has shown slight fluctuations but remained relatively steady over the past decade.
- By 2025, iPhone continues to dominate with a market share near 58%, while Android trails with around 42%.
- The data suggests a mature and stable smartphone market in the US, with limited room for large shifts in platform preference.
- Overall, Apple maintains its premium brand strength, while Android sustains a solid presence, ensuring continued duopoly in the market.
Regional Market Share Trends
- Asia‑Pacific markets show extreme Android dominance, e.g., India 95%, China 75%.
- The United Kingdom shows a near-balanced split: iOS 49.92%, Android 49.67% as of May 2025.
- In emerging African and Latin American markets, Android often surpasses 80% share owing to device affordability.
- Established Western markets (Canada, Australia) tend toward a higher iOS share (e.g., Australia 59.63%).
- Within Europe, iOS averages 30–40% share while Android accounts for 60–70%.
- Premium‑price smartphone segments (Nordics, Japan) skew further toward iOS.
- Regional shifts are gradual; major movement often comes via device pricing, carrier subsidies, and local brand competition.
- Regional fragmentation remains important; global averages mask large local variances in platform share.
Active Users Worldwide
- Estimates show Android has 3.9 to 4.5 billion active users globally in 2025.
- iOS has about 1.56 to 1.8 billion active users in 2025.
- One source puts Android at 3.3 billion users in 2025, with a 71.85% global share.
- Together, the smartphone‑user base globally reached around 4.88 billion by 2024.
- With the global population nearing 8 billion, smartphone penetration is 60%+.
- Growth in active users is slower in saturated markets (e.g., U.S., Western Europe) and faster in emerging ones (e.g., Africa, India).
- Platform‑active‑user counts inform app‑market sizing, advertising reach, and ecosystem monetisation.
- The differential between active installs and device shipments underscores upgrade‑cycle effects and device longevity.
Annual Smartphone Sales and Shipment Data
- The global smartphone market recorded 296.9 million unit shipments in Q1 2025, representing only a 0.2% year‑over‑year (YoY) gain.
- Shipments in Q2 2025 reached 295.2 million units, a 1.0% increase compared to Q2 2024.
- Full‑year 2025 shipping is only 1.24 billion units, representing growth of just 0.6%.
- Higher price‑point devices (premium phones) are driving value, even though unit growth remains flat.
- Shipments of smartphones featuring generative AI are forecasted at 370 million units in 2025, nearly 30% of the global market.
- Some regions (e.g., India, MEA) still show growth as replacement cycles resume.
- Slower growth is linked to extended device upgrade cycles, and consumers are holding onto smartphones longer.
- The segment mix shows fewer ultra‑budget devices and more mid‑to‑premium devices, shifting the shipment value per unit upward.
Revenue and App Store Spending
- In 2024, global consumer spending on apps reached $150 billion, up 13% YoY.
- Forecasts project app‑store consumer spending will reach $270 billion annually by 2025, up from $111 billion in 2020.
- The Apple App Store is expected to generate $185 billion in 2025, and the Google Play Store $85 billion.
- For U.S. consumers by 2025, spending on apps is estimated at $74 billion.
- The App Store ecosystem in the U.S. facilitated $406 billion in developer billings and sales in 2024.
- $277 billion came from physical goods & services, $75 billion from in‑app advertising, and $53 billion from digital goods & services.
- By 2025, non‑game apps are projected to reach $107 billion in spending vs. $78 billion for games.
- Weekly subscription plans in iOS apps grew 9.5% in early 2025, versus one‑time purchases, which grew 6.3%.
Average User Spending and Transaction Value
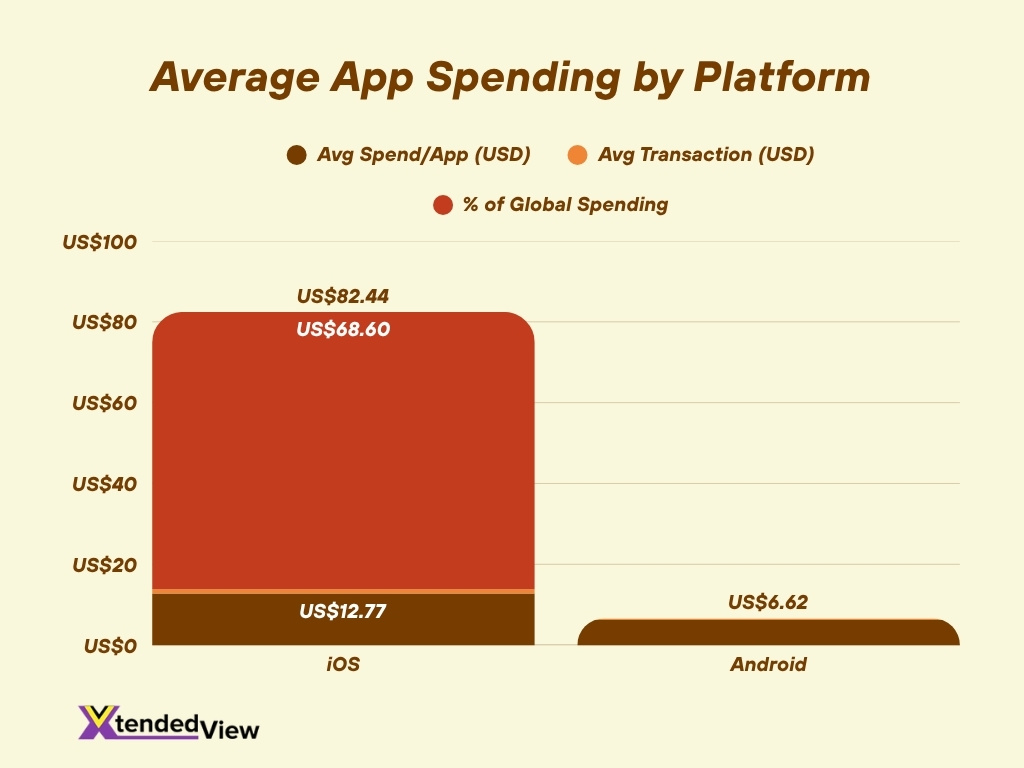
- An iOS user spends $12.77 per app, while an Android user spends $6.19 per app.
- Average transaction per purchase: iOS users $1.07 vs Android users $0.43.
- iPhone users accounted for 68.6% of all consumer spending on mobile apps in 2025.
- In the U.S., average monthly tech expenditure by iPhone users is $101 vs half for Android users.
- App subscriptions generated $45.6 billion globally, with 41% annual and 20% monthly subscription retention.
- Developers prioritise iOS for early monetisation due to higher average spend.
- The rise in weekly subscription plans suggests a shift toward shorter‑term, recurring revenue models.
- Despite lower per‑transaction spend, Android’s large install base still offers scale.
Number of Available Apps: App Store vs Google Play
- The Apple App Store had 1,916,393 apps available in 2025.
- On Google Play as of September 2025, there were approximately 1.58 million active apps.
- Some sources estimate that Google Play had over 2.09 million apps in 2025.
- On Google Play, 97% of apps are free, and 3% are paid.
- Google Play sees 48,000 new apps added per month.
- App‑store ecosystems continue expanding, but quality control measures are increasing.
- Google Play offers a broader reach, whereas the App Store offers higher monetisation potential per user.
App Download and Engagement Trends
- Consumer app downloads are projected to reach 230 billion installs globally by 2025.
- In the U.S., first‑time downloads are forecasted at 10.6 billion for the App Store and 6.3 billion for Google Play.
- Total time spent and in‑app engagement remain strong in mature markets.
- Android apps retain only 2.1% of users by Day 30 vs 3.7% for iOS apps.
- Free‑to‑download models continue dominating.
- “Quality over downloads” is emphasised for high‑engagement users.
- Growth of social commerce, live‑stream shopping, and influencer activity is shaping app engagement.
- Emerging markets show faster growth in app installs and engagement, but monetisation lags.
User Demographics: Age, Gender, and Income
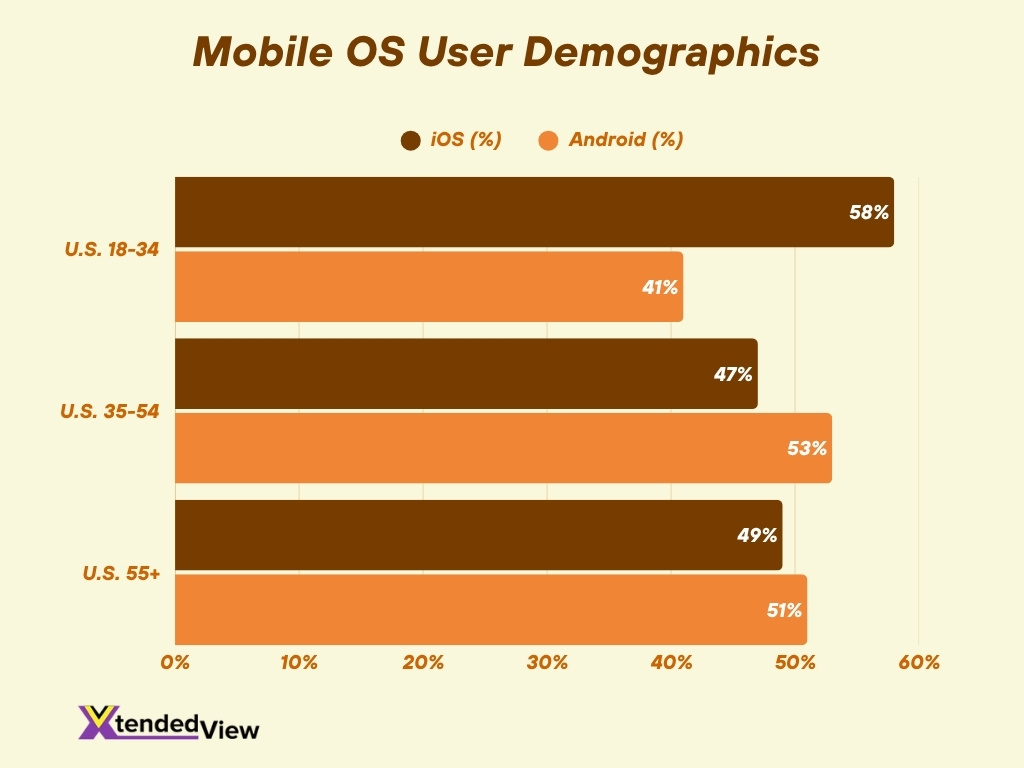
- Among U.S. smartphone users aged 18‑34, 58% opted for iPhones, whereas 41% used Android devices.
- In the 35‑54 age group, 47% used iPhones while 53% used Android.
- For adults aged 55 and older, Android had a slight lead (51%) compared with iPhones (49%).
- Worldwide, women were somewhat more likely to own an iPhone (31%) than men (28%).
- Android users are skewed more male globally, with approximately 10% higher male incidence than iPhone users.
- The average annual income of iPhone users was estimated at $85,000, about 40% higher than the $61,000 average for Android users.
- In a U.S. survey, iPhone users reported an average income of $53,251 compared to $37,040 for Android users.
- Younger generations (Gen Z and Millennials) are more likely to use iPhones, while Gen X and older tend to lean toward Android.
- Female users show a slight preference for iPhones, while Android holds stronger representation in male‑dominant user segments.
- Higher‑income brackets and premium device segments strongly favour iPhones; more affordable Android options dominate lower‑ and middle‑income tiers.
User Loyalty and Retention Rates
- Retention rate for Android OS users in 2025 is approximately 89‑91%, for iOS users it ranges around 85‑88%.
- Apple maintained a retention rate of about 92% among iPhone users.
- Around 84% of iPhone owners plan to buy another Apple device.
- About 74.6% of iPhone users stayed within Apple’s ecosystem.
- Around 80% of iOS users have never switched from their first iPhone.
- Only 11% of Android users switched from Apple, whereas 18% of iPhone users had previously been Android users.
- Brand‑loyalty strength influences app monetisation, platform investment, and marketing focus.
- Slight edge in retention for Android may reflect its broader hardware base.
Switching Trends: Migration Between Platforms
- 17% of new iPhone buyers in the U.S. were switching from Android.
- 27% of U.S. iPhone users in 2025 reported being open to switching to Android.
- User experience was cited by 47% of former Android users as the reason for moving to iPhone.
- 29% said they moved from iPhone to Android because of affordability.
- Migration remains modest due to high switching ‘friction’.
- Regulatory pressure for easier data migration between platforms is growing.
- Net incoming switchers represent strategic opportunities.
- Migration trends vary significantly by region, device tier, and carrier promotions.
Device Longevity and Upgrade Cycles
- The average smartphone replacement cycle globally is 2.4 years, with U.S. users upgrading more frequently (2.1 years).
- Consumers expected a lifespan of 5.2 years for their mobile phones, but actual use averaged 2.7 years.
- The practical lifespan of a smartphone is 2‑3 years; high‑end devices may last 4‑5 years.
- Used‑smartphone shipments are projected to grow 3.2% year‑on‑year, outpacing new‑device shipments.
- Battery degradation concerns and a shift toward mid‑price replacements drive longer cycles.
- Premium devices promise longer software‑support commitments (5‑7 years).
- Longer device cycles imply slower refresh demand but longer user lifetime value.
- Trade‑in and refurbishment markets are gaining importance.
Technical Differences and OS Updates
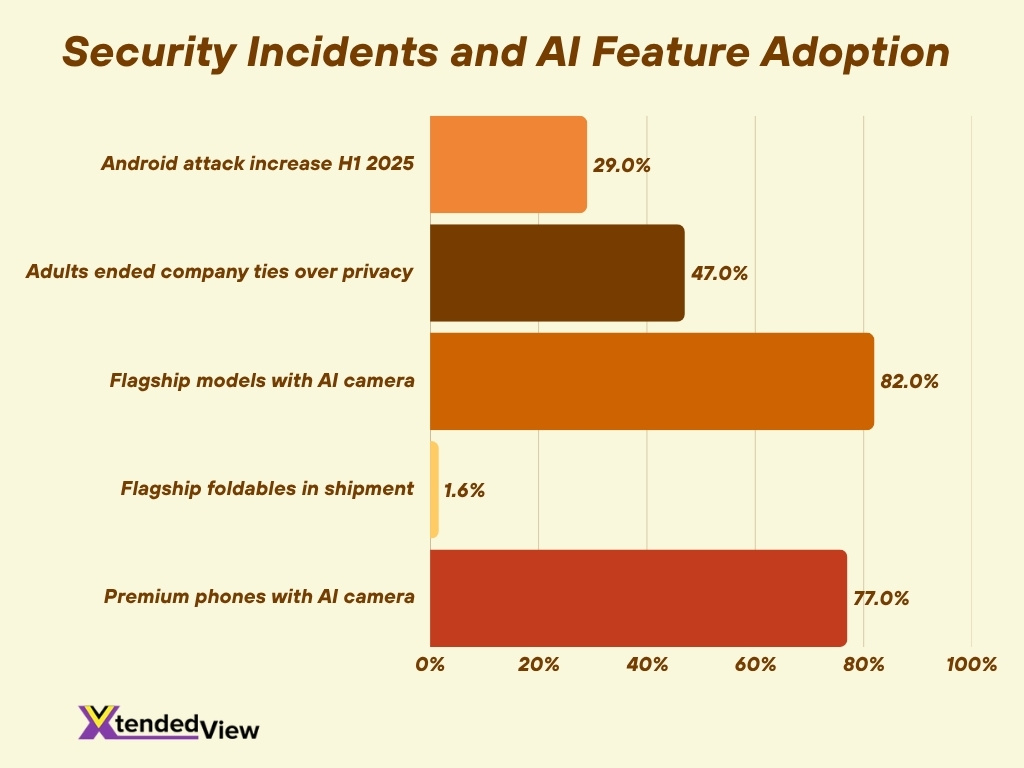
- Flagship smartphones integrate features like foldables (1.6% of shipments) and enhanced display/hardware upgrades.
- Pixel 9 series offers 7 years of updates, aligning with premium‑device expectations.
- 82% of flagship models released in 2025 feature AI‑camera enhancements.
- Device performance or OS support often triggers upgrades.
- Android’s broader hardware variations mean wider OS version fragmentation.
- iOS’s faster update rollout supports consistent user experiences.
- Longer OS update cycles reduce developer fragmentation.
- Hardware capability and software integration drive user choice and longevity.
Security and Privacy Statistics
- Attacks on Android smartphones increased by 29% in the first half of 2025 vs the same period in 2024.
- 47% of adults reported discontinuing relationships with companies over data privacy concerns.
- Longer update‑commitment correlates with fewer unpatched vulnerabilities.
- Users highly value frequent updates and strong privacy policies.
- Android manufacturers now include scam‑ and fraud‑detection features.
- Privacy regulations are pushing for more openness and data portability.
- Platform security and update‑commitment influence enterprise device recommendations.
- Security modules and patch response remain key differentiators.
AI Feature Adoption and Usage
- About 60% of consumers consider AI features important when choosing a smartphone.
- 77% of premium smartphones released in 2025 feature AI‑powered camera enhancements.
- AI smartphone market is forecasted to grow from USD $90.8 billion in 2025 to over USD $850 billion by 2034.
- Devices branded as “AI phones” are used to differentiate premium models.
- On‑device AI improves privacy, responsiveness, and battery life.
- AI features include predictive text, live translation, and intelligent power management.
- Developers face new segmentation and API‑integration opportunities.
- Premium adoption of AI features often skews toward iOS and flagships.
Frequently Asked Questions (FAQs)
Android holds approximately 72.46% of the global smartphone OS market in 2025, while iOS accounts for about 27.13%.
In the U.S., iPhones hold roughly 58.03% of the smartphone market in 2025.
In 2024, iOS was responsible for about 68% of global app‑consumer spending.
As of June 2025, Google Play hosted around 2.03 million apps, while the Apple App Store had about 1.9 million apps.
By 2025, global consumer spending on mobile apps is forecasted at about $270 billion annually, with iOS projected at $185 billion and Android (Google Play) at $85 billion.
Conclusion
The data underscores a clear dual dynamic in the mobile‑platform landscape: scale and breadth continue to favour Android, while premium value, user loyalty and monetisation favour iOS. High retention rates, low switch‑rates, and strong spending behaviour suggest that both platforms have matured into entrenched ecosystems. At the same time, technical differences (update‑commitment, AI‑feature adoption, security/privacy) and shortening upgrade‑cycles shape how users choose and stick with devices.
For app developers, hardware‑makers, and marketers alike, understanding these nuanced distinctions is critical: Android offers massive reach, iOS offers premium yield. Retracing platform‑migration patterns, upgrade‑behaviour, and feature‑triggers helps shape smarter device‑strategies.