
Google Business Profile, formerly known as Google My Business, remains one of the most influential local marketing tools for businesses that want to attract nearby customers. It helps companies appear in Google Search and Google Maps, making it easier for consumers to discover products, compare reviews, and contact businesses in just a few clicks.
Today, retailers use Google Business Profile to increase in-store visits, while restaurants, healthcare providers, and home service companies rely on it to drive phone calls, bookings, and direction requests. As local search behavior continues to evolve, understanding the latest statistics can help businesses improve visibility and make smarter marketing decisions. Explore the latest Google Business Profile statistics below to see how consumer behavior, business adoption, and local search trends are shaping the future.
Editor’s Choice
- More than 5 billion searches are performed on Google every day, and a significant share carries local intent, making Google Business Profile a critical customer acquisition channel.
- Businesses with a complete Google Business Profile are significantly more likely to earn customer trust and interactions than incomplete listings.
- Around 72% of consumers use Google when looking for local business information.
- Google Business Profile management ranked as the most valuable local SEO activity, selected by 76% of marketers in recent industry research.
- Local search experts continue to rank Google Business Profile signals among the strongest influences on Local Pack visibility heading into 2026.
- Consumer behavior research published during 2025 shows that online reviews remain one of the biggest factors influencing local purchasing decisions.
- Industry research released for 2026 highlights continued investment in AI-powered local search experiences and Google Business Profile optimization as leading priorities for businesses.
Recent Developments
- During 2025, Google continued expanding AI-powered search experiences that increasingly surface information from Google Business Profiles in local results.
- Local SEO research released for 2026 added AI visibility as a new area of evaluation alongside traditional local ranking factors.
- Google continues encouraging businesses to maintain accurate hours, services, categories, and attributes, as these directly improve local search relevance.
- Review quality and consistent customer engagement became even more important in 2025 and 2026, according to updated local search guidance.
- Local marketing platforms increasingly introduced bulk profile management and AI-assisted optimization tools during 2026 to simplify multi-location management.
- Industry experts reported greater emphasis on business authenticity and profile completeness as Google continued refining spam detection.
- Businesses increasingly relied on Google Business Profile Insights to measure calls, website visits, and direction requests generated from local search.
- Recent local search reports identified stronger integration between Google Maps, AI search features, and business profiles throughout 2025.
Google My Business Statistics Overview
- Google renamed Google My Business to Google Business Profile, while keeping the platform free for eligible businesses.
- Google Business Profile listings appear across Google Search and Google Maps, giving businesses visibility where consumers actively search for nearby products and services.
- Google’s local ranking system primarily evaluates relevance, distance, and prominence when displaying local businesses.
- Industry experts continue to identify Google Business Profile optimization as one of the highest-return local SEO activities for businesses.
- Updated 2026 ranking research shows Google Business Profile optimization remains one of the strongest contributors to Local Pack performance.
- Consumer-generated content, including ratings, reviews, and photos, continues to influence both customer decisions and local visibility.
- Businesses that keep profile information accurate improve both customer experience and local search performance.
- Google Business Profile remains one of the few major digital marketing channels that businesses can access without paying listing fees, making it especially valuable for small businesses.
Google Business Profile Statistics
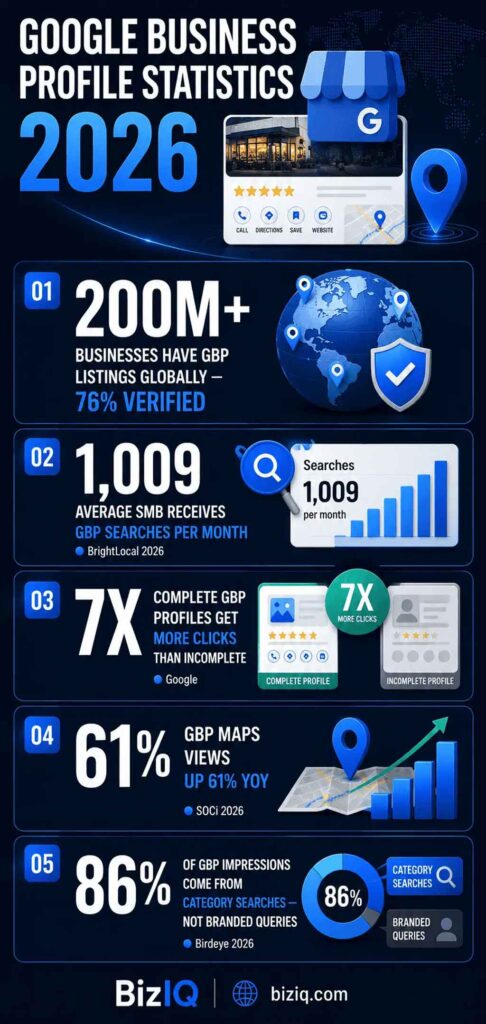
- 200M+ businesses have Google Business Profile listings globally, showing its massive reach for local visibility.
- 76% of GBP listings are verified, making verification a major trust signal for businesses.
- The average SMB receives 1,009 GBP searches per month, proving how often customers use Google to find local businesses.
- Complete Google Business Profiles get 7X more clicks than incomplete profiles, highlighting the value of full optimization.
- GBP Maps views are up 61% YoY, showing strong growth in map-based local discovery.
- 86% of GBP impressions come from category searches, meaning most users search by service or business type.
- Branded queries make up a smaller share, so businesses should optimize for category keywords and local intent.
- A complete GBP listing can improve customer actions such as calls, directions, saves, and website visits.
- The data shows that profile completeness, verification, and category relevance are key drivers of GBP performance.
- Google Business Profile remains a powerful tool for SMBs aiming to increase local traffic, clicks, and customer trust.
Google Business Profile Growth Statistics
- The average small business receives 1,009 Google Business Profile searches every single month.
- Fully optimized profiles generate 7x more clicks compared to incomplete or unverified listings.
- Businesses maintaining 100% complete profiles experience 70% more in-store foot traffic.
- An estimated 46% of all Google queries are strictly driven by local search intent.
- Profiles featuring professional photos capture 35% more user clicks than those without images.
- Over 200 million businesses have active listings globally, with roughly 76% officially verified.
- Active feature management drives 67% more profile views and 43% higher website traffic.
- Google Maps views for well-optimized business profiles have grown by 61% year-over-year.
- Profiles with comprehensive business descriptions generate 2.5x more search impressions.
- Profile signals are considered the top local ranking factor by 32% of search experts.
Google Business Profile Adoption Statistics
- Over 200 million businesses globally have an active Google Business Profile, with 76% of these listings being fully verified.
- Approximately 28,000 new business profiles are created on the platform every single day.
- Businesses with 100% complete profiles earn 7x more clicks and 70% more in-store visits than incomplete ones.
- The average small business receives around 1,009 monthly searches directly through its Google listing.
- More than 46% of all Google searches are initiated by users actively seeking local business information.
- A massive 93% of local searches successfully trigger a Google Map Pack result for the searcher.
- Customers are 2.7 times more likely to trust a brand that maintains a complete and verified profile.
- Around 75% of top-ranking pages in local search results feature fully completed profile descriptions.
- Overall, Google Business Profile listings continue to experience a steady growth of 6% to 7% each year.
Google Business Profile Verification Rate by Industry
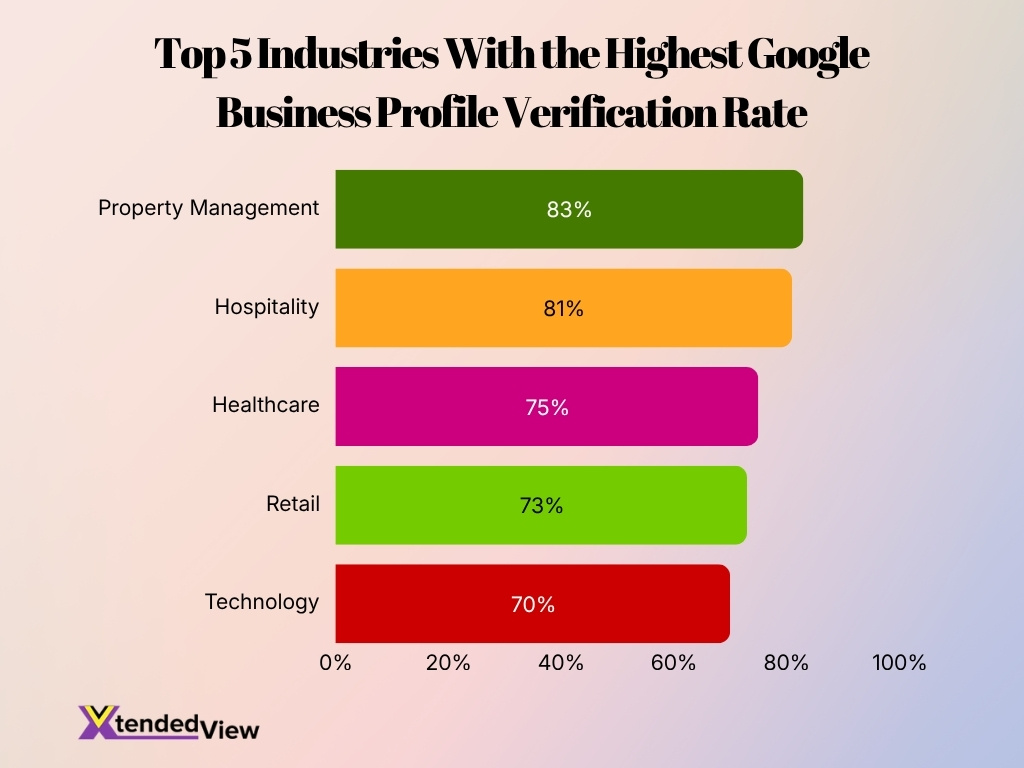
- Property Management leads with the highest Google Business Profile verification rate at 83%.
- Hospitality ranks second, with 81% of businesses having verified Google Business Profiles.
- Healthcare shows a strong verification rate of 75%, reflecting high trust and visibility needs.
- Retail businesses have a verification rate of 73%, supporting local discovery and customer visits.
- Technology completes the top five with 70% verified Google Business Profiles.
- The top two industries, Property Management and Hospitality, both exceed 80% verification.
- All five leading industries have verification rates of 70% or higher.
- The gap between the highest and lowest industries is 13 percentage points.
- Service-based and customer-facing sectors dominate the top verified Google Business Profile rankings.
Google Business Profile Search Statistics
- Around 46% of all Google searches have local intent, making local search one of the largest traffic sources for businesses with physical locations.
- 86% of consumers use Google Maps to look up a business location before visiting or contacting a company.
- Approximately 88% of consumers who perform a local search on a smartphone visit or call a business within 24 hours.
- Category-based searches account for 86% of Google Business Profile impressions, showing that users search for services rather than business names.
- About 42% of local searches generate clicks on businesses listed in the Google Local Pack.
- Verified Google Business Profiles receive an average of around 200 customer interactions per month, including calls, website visits, and direction requests.
- In 2026, roughly 40.16% of local business queries trigger Google’s AI Overviews, changing how businesses compete for visibility.
- Local searches continue to generate billions of queries every day because Google processes billions of searches daily worldwide.
Google Business Profile Visibility Statistics
- A 100% complete Google Business Profile earns 7 times more clicks than an incomplete listing.
- Customers are 2.7 times more likely to consider a business reputable if its profile is fully updated.
- Complete Google Business Profiles generate 70% more in-store visits compared to incomplete or abandoned listings.
- Profiles demonstrating active review growth achieve 21% more local search appearances than static ones.
- An astounding 93% of all local searches directly trigger a Google Map Pack result on the search page.
- Google Business Profile signals account for 32% of the total ranking factors for local search visibility.
- About 75% of businesses ranking in the top three local positions have thoroughly completed profile descriptions.
- Increasing a business’s average star rating by one full star improves overall profile conversions by 44%.
Core Engagement Actions on Google Business Profiles
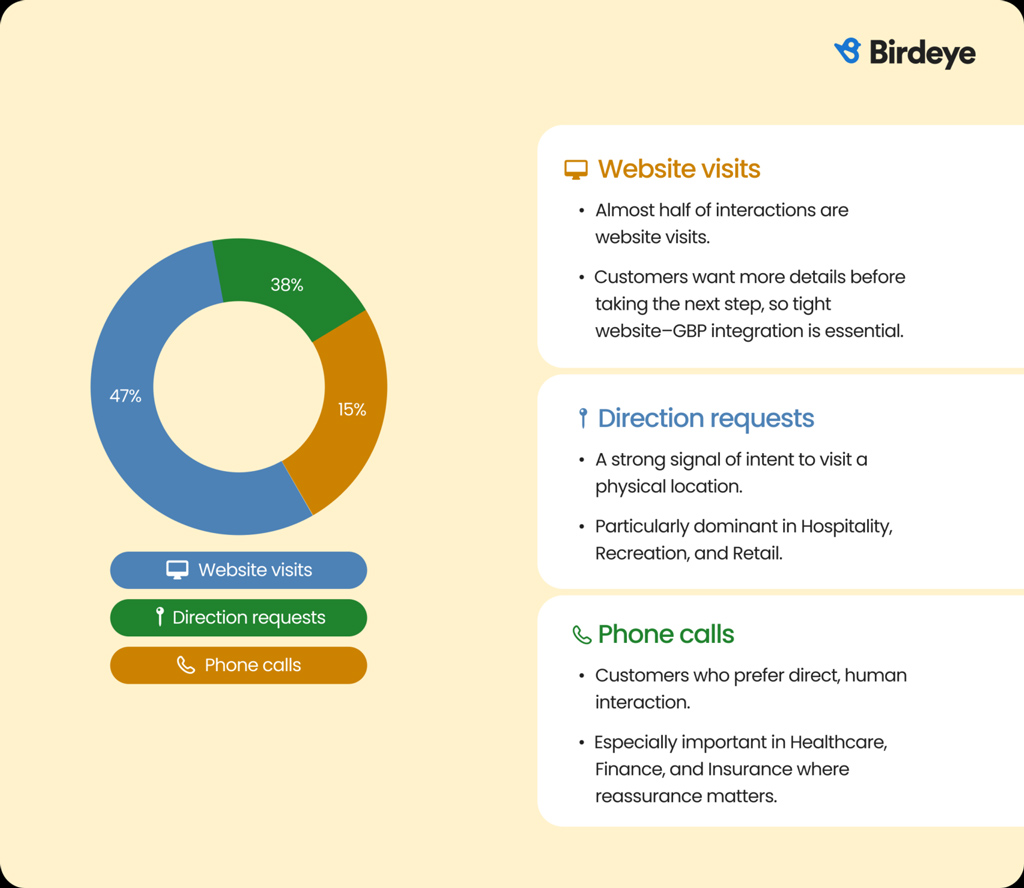
- Website visits lead customer actions at 47%, showing that nearly half of users want more details before deciding.
- Direction requests account for 38%, proving that many customers use Google Business Profiles to visit physical locations.
- Phone calls make up 15%, showing that direct communication still matters for high-consideration decisions.
- Website visits and direction requests together represent 85% of total engagement actions.
- Phone calls are the smallest share at 15%, but they reflect stronger purchase intent and direct customer interest.
- Businesses should optimize website links, location details, and phone numbers to capture all three engagement actions.
Google Business Profile Ranking Statistics
- 32% of local search experts identify Google Business Profile signals as the most critical local pack ranking factor.
- Businesses ranking in the top three positions typically have more than 200 reviews on their listings.
- Fully completing your Google Business Profile can generate up to 2.3× more search visibility.
- Profiles frequently updated with fresh photos experience roughly 27% more discovery impressions.
- Maintaining a rating of 4.5 stars or higher earns local businesses approximately 28% more clicks.
- 75% of the businesses ranking in the top three positions have fully completed their profile descriptions.
- Profiles that accumulate over 50 reviews achieve roughly 30% stronger local visibility.
- Publishing regular posts on your listing can drive about 12% more branded search impressions.
Google Maps Statistics
- Google Maps currently serves over 2 billion monthly active users globally.
- The platform features active listings for over 250 million places and businesses worldwide.
- Approximately 46% of all Google searches are driven by local intent.
- Users rely on the application to navigate over 1 billion kilometers every single day.
- The mapping service provides official coverage for 249 countries and territories across the globe.
- A community of over 120 million Local Guides regularly contributes updates across 24,000 cities.
- The platform successfully processes more than 5 billion location searches on a daily basis.
- Users submit more than 20 million daily contributions, which include reviews, ratings, and new photos.
- 76% of consumers who conduct a nearby search visit a related local business within one day.
- The navigation application has surpassed 10 billion total downloads on the Google Play Store.
Local Search Statistics
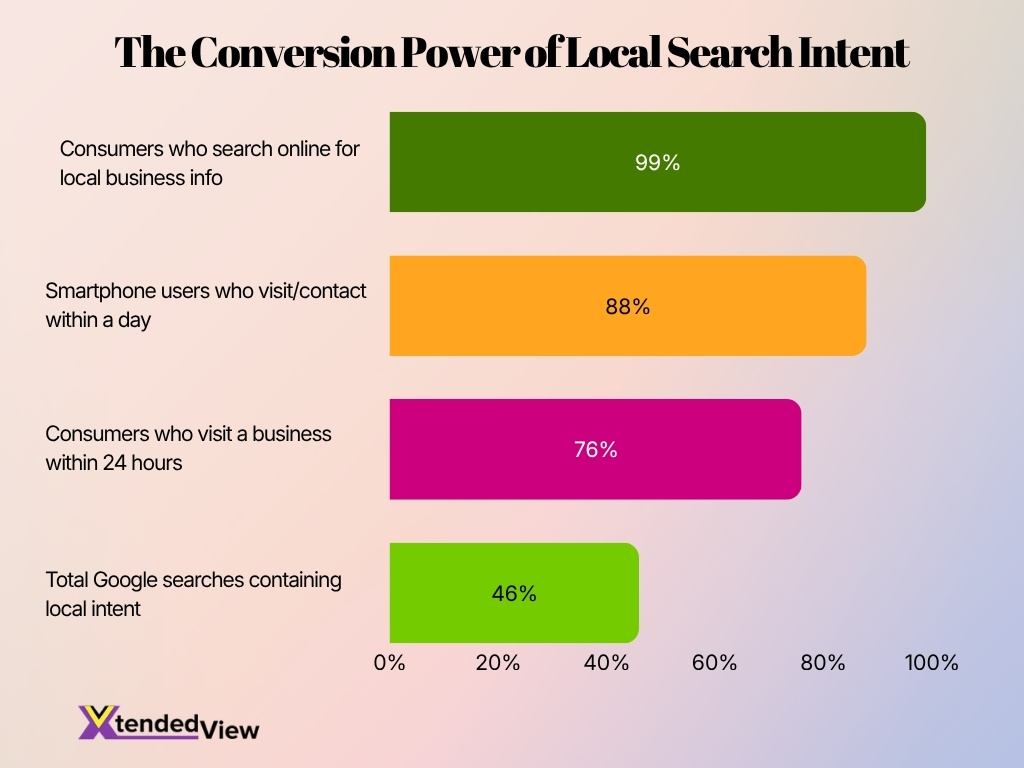
- 46% of Google searches include local intent.
- 99% of consumers have searched online for information about a local business.
- Around 88% of smartphone users who perform a local search visit or contact a business within one day.
- 76% of consumers visit a business within 24 hours after conducting a local search.
- Local search remains one of the highest-converting digital marketing channels because users often search with immediate purchase intent.
- Businesses appearing in the Google Local Pack capture a substantial share of local clicks compared with standard organic listings.
- “Near me” searches continue growing as consumers increasingly rely on mobile devices for local discovery.
- AI-powered search features are reshaping local search behavior while increasing the importance of accurate business data.
Local SEO Statistics
- 97% of consumers research a local business online before visiting or making a purchase.
- 46% of all Google searches are driven by local search intent.
- 76% of users who conduct a local search on mobile visit a store within 24 hours.
- Ranking in the top three Google Local Pack positions generates 126% more traffic.
- 68% of consumers will only consider using local businesses with a rating of 4 or more stars.
- Showcasing customer reviews on your website can boost conversion rates by up to 270%.
- Over 74% of local SEO agencies now use AI tools daily to optimize client campaigns.
- Nearly 75% of Google Business Profile views come directly from organic search results.
- Search queries containing “near me” have grown by over 900% in the past two years.
Google Business Profile Optimization Statistics
- Complete Google Business Profiles generate 7 times more clicks and 70% more in-store visits than incomplete listings.
- Consumers are 2.7 times more likely to trust a business that maintains a fully completed profile.
- Approximately 86% of profile views originate from category-based searches rather than direct brand name queries.
- Businesses with a 750-character description receive 2.5 times more impressions compared to those without one.
- Profiles featuring 100 or more photos generate 520% more customer calls than listings with fewer visual assets.
- 75% of businesses ranking in the top three local search positions have comprehensively filled out their profile descriptions.
- Profiles displaying accurately updated operating hours receive twice as many customer visits as those with missing hours.
- Verified businesses uploading at least 15 high-quality photos experience significantly higher website clicks and direction requests.
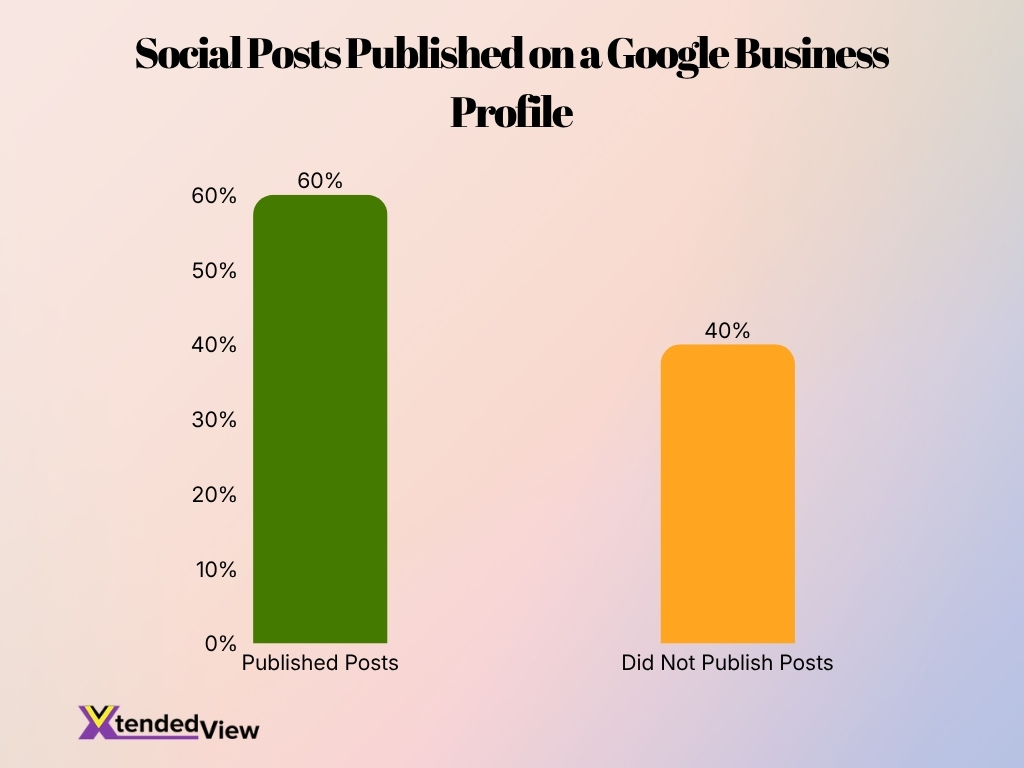
Google Business Profiles With Social Posts Published
- 60% of Google Business Profiles had published posts, showing strong use of profile updates for engagement.
- 40% of profiles did not publish posts, indicating many businesses still miss this visibility opportunity.
- Businesses that publish posts can keep customers informed about offers, updates, events, and announcements.
- The data shows that social post publishing is a common but not universal Google Business Profile activity.
- A 20 percentage point gap separates businesses that publish posts from those that do not.
Google Business Profile Photo Statistics
- Businesses with photos get 42% more requests for directions.
- Profiles with images receive 35% more clicks to their websites.
- The top three local search positions average over 250 photos.
- Listings ranked between 11 and 20 average about 170 photos.
- Profiles with 100+ images generate 520% more customer phone calls.
- Businesses featuring more than 100 photos see 2,717% more direction requests.
- Listings boasting over 100 photos experience 1,065% more website clicks.
- Profiles including 15 or more photos attract noticeably higher customer engagement.
- Nearly 60% of consumers say good images capture their attention in local searches.
- Customers are twice as likely to trust a business with a photo-rich complete profile.
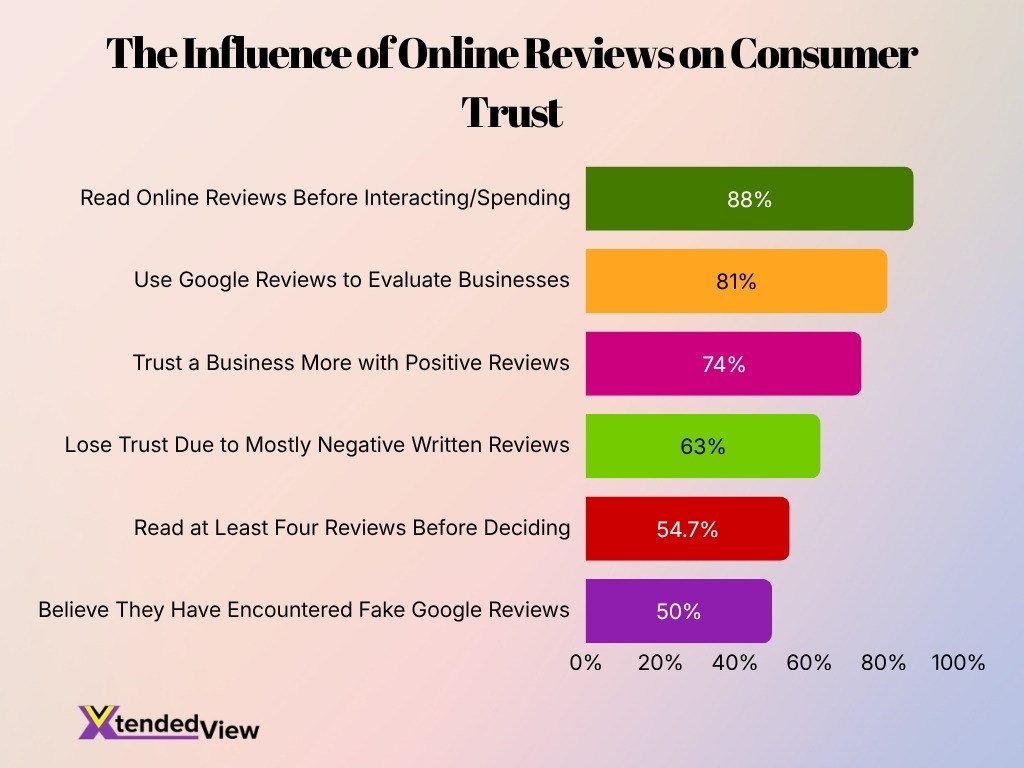
Google Business Profile Review Statistics
- 81% of consumers use Google reviews to evaluate local businesses before making a purchase or booking decision.
- Around 88% of consumers read online reviews before interacting with a local business, making review management a core part of local marketing.
- 74% of consumers say they trust businesses more when they have positive Google reviews.
- Approximately 54.7% of consumers read at least four reviews before deciding whether to buy from a business.
- Nearly 87% of customers read online reviews for local businesses before spending money.
- Around 63% of consumers lose trust in a business after seeing mostly negative written reviews.
- About 50% of consumers believe they have encountered fake Google reviews, highlighting the importance of review authenticity.
- Google recommends businesses actively encourage genuine customer reviews because reviews improve visibility and help customers make informed decisions.
Future Trends in Google Business Profile
- Complete Google Business Profiles are 70% more likely to appear in AI-generated local recommendations.
- Local businesses with 50+ recent reviews are 3x more likely to appear in AI recommendations.
- Over 35% of consumers have already used an AI tool to discover a local business or service.
- An estimated 23% of all Google searches now display an AI Overview above traditional local results.
- Mobile searches with local intent trigger an AI Overview in over 30% of specific query types.
- Website visits remain a vital metric, accounting for 48% of all interactions on Google Business Profiles.
- Businesses with a fully completed profile earn 7x more clicks and 70% more in-store visits.
- A staggering 86% of profile impressions come from category-based searches rather than direct branded queries.
- Approximately 75% of top-ranking pages for local searches feature detailed Google Business Profile descriptions.
- Pages utilizing structured data are 4x more likely to be cited directly in AI Overviews.
Frequently Asked Questions (FAQs)
Approximately 46% of all Google searches have local intent, making local search one of Google’s largest search categories.
Around 97% of consumers read reviews for local businesses, while 71% specifically use Google to read those reviews.
Businesses with a complete Google Business Profile are 2.7 times more likely to be considered reputable by potential customers.
About 86% of Google Business Profile impressions come from category-based searches rather than branded searches.
Approximately 88% of mobile local searches result in a visit or contact with a local business within 24 hours.
Conclusion
Google Business Profile continues to play a central role in local search, customer discovery, and business growth. The latest data shows that consumers increasingly depend on Google Search, Google Maps, online reviews, photos, and verified business information before making purchasing decisions. At the same time, AI-powered search experiences are raising the importance of maintaining complete, accurate, and regularly updated profiles.
Businesses that invest in review management, high-quality visual content, profile verification, and ongoing optimization are better positioned to improve local visibility, generate customer actions, and compete in increasingly AI-driven search results. As local SEO continues to evolve, Google Business Profile will remain one of the most valuable digital assets for organizations targeting customers in both local and regional markets.