


Facebook remains the world’s largest social network and still plays a major role in digital advertising, community building, and e-commerce. Small businesses use Facebook Pages and Marketplace to attract local customers, while global brands rely on the platform’s ad tools to reach billions of consumers. Despite rising competition from short-form video apps, Facebook continues to grow its user base and advertising ecosystem. The latest statistics reveal how people use the platform, where growth comes from, and why Facebook still matters.
Editor’s Choice
- Facebook has approximately 3.07 billion monthly active users (MAUs) worldwide as of early 2026, making it the largest social platform globally.
- Around 2.11 billion people use Facebook every day, representing nearly 69% of its monthly audience.
- More than 98% of Facebook users access the platform on mobile devices.
- Facebook’s advertising business helped Meta generate $200.97 billion in revenue in 2025, the highest annual revenue in company history.
- India remains Facebook’s largest market, with more than 380 million active users, while the United States ranks second.
- More than 54% of global internet users access Facebook every month.
- Facebook’s parent company reported approximately 3.58 billion daily active people across its family of apps, including Instagram, WhatsApp, and Messenger.
- Roughly 37.7% of the world’s population uses Facebook each month.
Recent Developments
- Meta reported a 22% year-over-year increase in revenue during 2025, driven largely by advertising demand and AI-powered recommendations.
- Facebook continues to integrate more AI features into feeds, recommendations, and business messaging experiences.
- Meta AI surpassed 1 billion monthly active users across Meta’s apps during 2025.
- Facebook and WhatsApp each crossed the 3 billion monthly user milestone, strengthening Meta’s dominance in social networking.
- The company expanded AI-driven ad tools that automatically generate creative assets and improve campaign targeting for businesses.
- Facebook Reels continue to gain traction, with engagement rates reportedly 22% higher than standard video posts in several studies.
- Meta reported nearly 4 billion monthly active people across its family of apps in early 2025, highlighting the scale of its ecosystem.
- In early 2026, Meta disclosed a temporary decline of around 20 million daily active users across its family of apps, showing that competition and user behavior continue to evolve.
Key Facebook User Statistics 2026
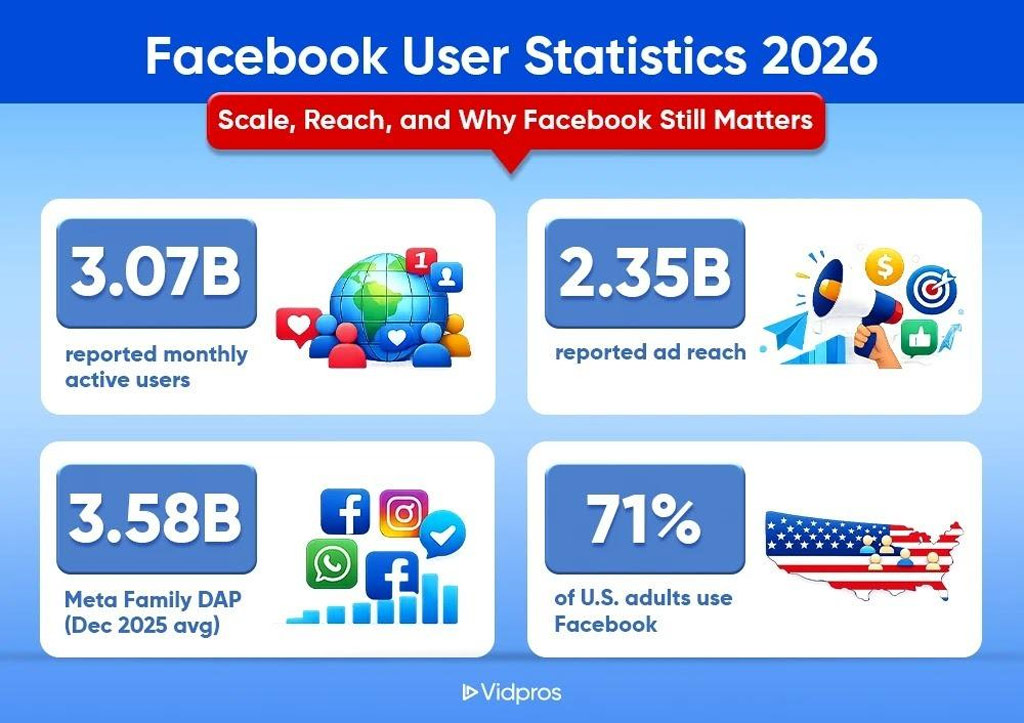
- Facebook reached 3.07 billion monthly active users, making it one of the largest social media platforms globally.
- Facebook Ads can reach 2.35 billion users, highlighting its massive advertising audience.
- Meta’s Family of Apps recorded 3.58 billion daily active people on average in December 2025.
- 71% of U.S. adults use Facebook, demonstrating the platform’s strong penetration in the United States.
- Facebook’s advertising reach equals nearly 77% of its monthly active user base, reflecting its extensive marketing potential.
- Meta’s ecosystem attracts 3.58 billion daily active users, showing high engagement across Facebook, Instagram, WhatsApp, and Messenger.
- Over 3 billion people use Facebook every month, reinforcing its position as a leading global social network.
- Facebook continues to combine massive user scale with strong ad reach, making it a top platform for businesses and marketers.
Monthly Active Users of Facebook
- Facebook reached approximately 3.07 billion monthly active users in 2025 and maintained its position as the world’s largest social network.
- The platform added roughly 130 million monthly users compared with two years earlier.
- Facebook’s monthly audience represents almost 60% of all social media users worldwide.
- More than 54% of active internet users log in to Facebook at least once per month.
- Facebook’s MAU figure exceeds the combined populations of Europe, North America, and South America.
- The platform has grown by more than 120% over the past decade, rising from around 1.39 billion users in 2014.
- Asia-Pacific remains Facebook’s largest regional market and accounts for more than one-third of all monthly users.
- Industry projections suggest Facebook could approach 3.15 billion monthly users by the end of 2026 if current growth trends continue.
- Facebook remains the only standalone social platform besides YouTube to consistently maintain an audience above 3 billion users.
Daily Active Users on Facebook
- Facebook records around 2.11 billion daily active users (DAUs) globally.
- Nearly 69% of monthly users return every day, highlighting strong user retention.
- Facebook’s daily audience equals more than one-quarter of the global population.
- Daily active users increased by roughly 5.5% year over year in the latest reporting period.
- More than 37% of global internet users access Facebook every day.
- The platform recovered quickly after its first-ever decline in late 2021 and has since added over 200 million daily users.
- Daily engagement remains heavily mobile-driven, with almost all users accessing Facebook through smartphones.
- Facebook’s DAU-to-MAU ratio remains among the strongest across major social media platforms, reflecting habitual use.
Demographics of Facebook Users by Age Group
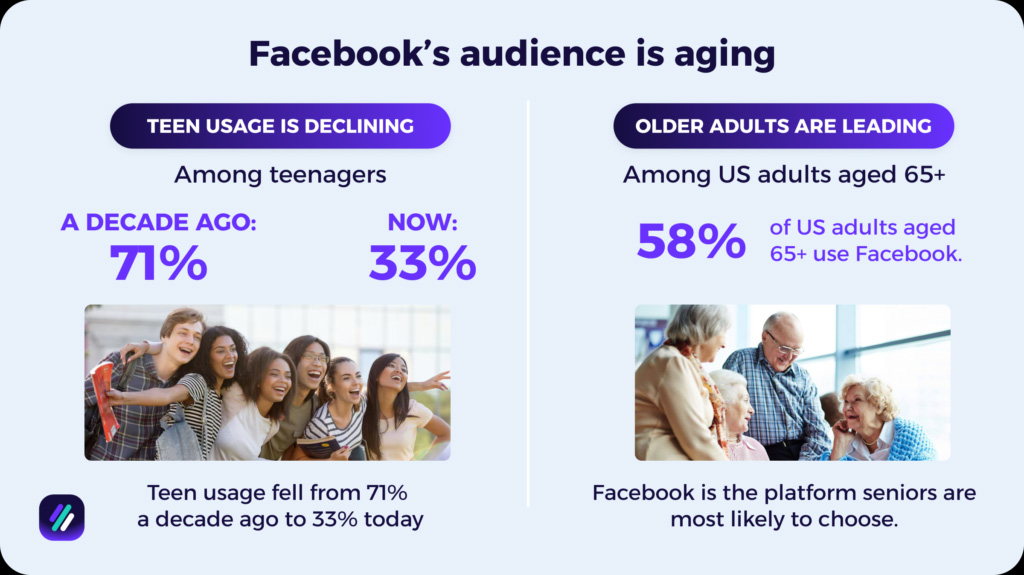
- Facebook’s teenage user base has dropped from 71% a decade ago to 33% today, highlighting a major shift in younger audience adoption.
- 58% of U.S. adults aged 65+ use Facebook, making it the most preferred social platform among seniors.
- Men account for 56.8% of Facebook’s global audience, while women represent 43.2%.
- In the United States, 54.7% of Facebook users are female, making women the majority audience.
- The 25 to 34 age group is Facebook’s largest demographic, accounting for 25% to 31% of all users.
- Users aged 35 to 44 make up 18.7% of Facebook’s global audience.
- Millennials (25–44 years) collectively represent over 43% of Facebook’s worldwide user base.
- Around 67% of U.S. adults aged 18 to 29 actively use Facebook.
- Only 33% of teenagers now use Facebook, compared to 71% a decade ago, reflecting a 38 percentage point decline.
- About 50% of Baby Boomers are most likely to engage with influencers on Facebook compared to any other social platform.
Demographics of Facebook Users by Gender
- Men account for approximately 56.8% of Facebook’s global audience, while women represent about 43.2% of users.
- More than 1.74 billion male users actively use Facebook every month worldwide.
- Female users number approximately 1.33 billion globally, making Facebook one of the few social platforms with a relatively balanced gender split.
- Men aged 25 to 34 represent the largest demographic segment on Facebook, accounting for nearly 18.4% of total users.
- Women aged 25 to 34 make up around 12.6% of Facebook’s audience, making this the platform’s second-largest demographic segment.
- In the United States, women are slightly more likely than men to use Facebook, despite the platform’s male-heavy global audience.
- Female users tend to engage more frequently with community groups and local business pages than male users.
- Men are more likely to follow sports, technology, and gaming-related content, contributing to higher engagement in those categories.
- Facebook’s gender distribution has remained relatively stable over the past three years, with shifts of less than one percentage point annually.
Facebook Usage Trends by Education and Income
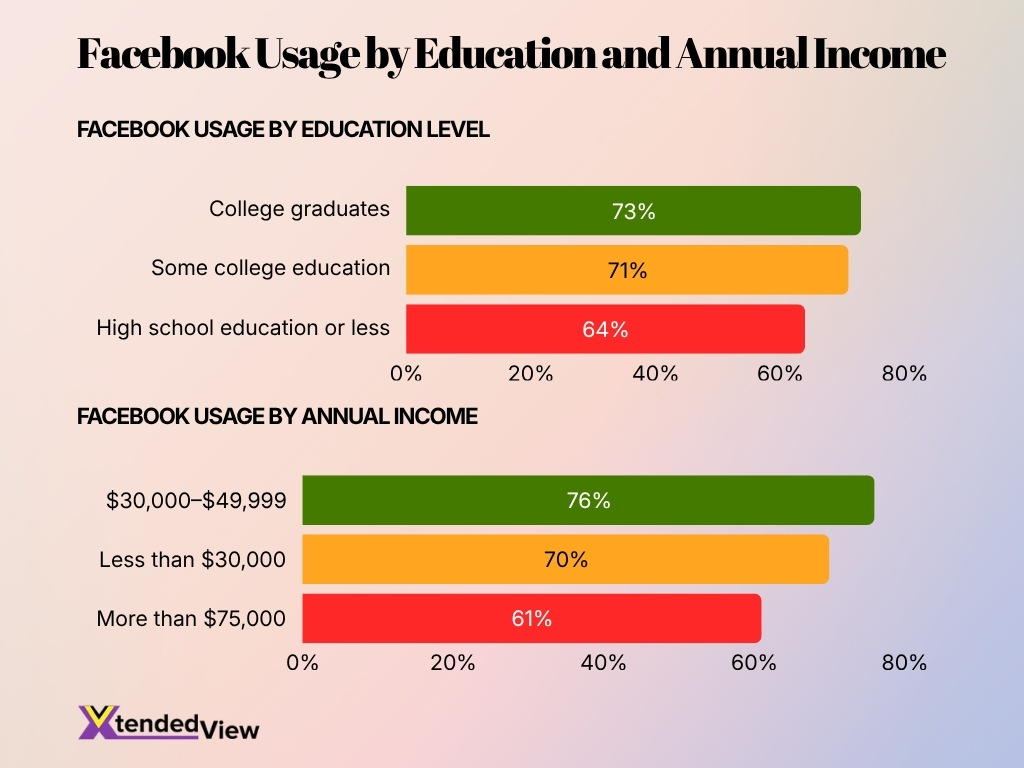
- 73% of college graduates use Facebook, making them the largest education group on the platform.
- People with some college education have a 71% Facebook usage rate, only slightly below college graduates.
- 64% of users with a high school education or less are active on Facebook.
- Facebook usage is highest among individuals earning $30,000 to $49,999 annually, with 76% using the platform.
- 70% of people earning less than $30,000 per year are Facebook users.
- Among individuals earning more than $75,000 annually, 61% use Facebook.
- Higher education levels are associated with greater Facebook adoption overall.
- Facebook maintains strong engagement across all income groups, with usage exceeding 60% in every category.
- The gap between the highest and lowest education groups is 9 percentage points (73% vs. 64%).
- The difference between the highest and lowest income groups is 15 percentage points (76% vs. 61%).
Mobile vs Desktop Usage on Facebook
- Approximately 98.5% of Facebook users access the platform via mobile devices at least once per month.
- Only around 1.5% of users access Facebook exclusively through desktop devices.
- Smartphones account for nearly 81% of all time spent on Facebook, while desktop usage continues to decline.
- More than 1.9 billion users access Facebook exclusively on mobile devices, without ever using desktop.
- Facebook’s mobile app remains one of the world’s most downloaded social networking applications.
- Mobile advertising contributes more than 94% of Meta’s advertising revenue, reflecting the dominance of smartphone usage.
- Desktop traffic remains important for workplace communication, business management, and advertising administration tools.
- Facebook users in emerging economies are significantly more likely to access the platform exclusively through mobile devices because smartphones often serve as their primary internet connection.
- The average mobile Facebook session lasts longer than desktop sessions, particularly for video consumption and Reels viewing.
Demographics of Facebook Users by Country and Region
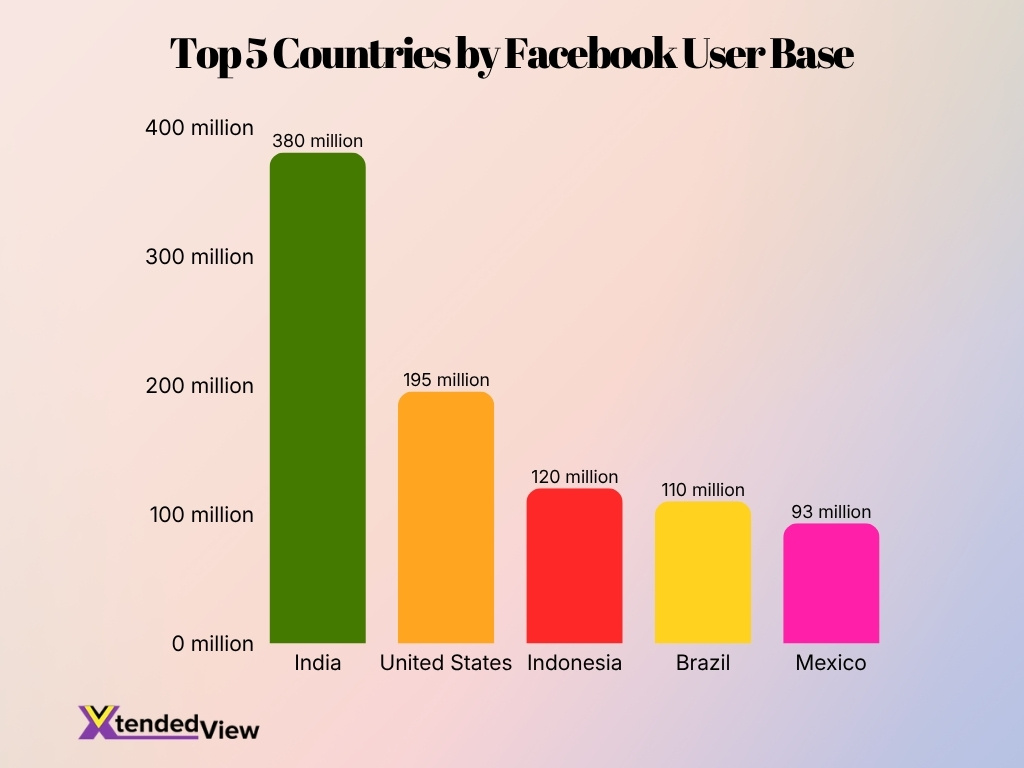
- India remains Facebook’s largest market with more than 380 million users, accounting for over 12% of the platform’s total audience.
- The United States ranks second with approximately 195 million Facebook users.
- Indonesia has more than 120 million active users, making it the third-largest Facebook market globally.
- Brazil’s Facebook audience exceeds 110 million users, driven by high mobile and social media adoption.
- Mexico has approximately 93 million users, making Facebook one of the country’s most influential digital platforms.
- The Asia-Pacific region accounts for nearly 40% of Facebook’s total user base, making it the company’s most important growth market.
- North America contributes a smaller share of users but generates the highest average revenue per user for Meta.
- Africa remains one of Facebook’s fastest-growing regions because of expanding internet access and smartphone penetration.
- More than 70% of Facebook users live outside North America and Europe, highlighting the platform’s global reach.
Average Time Spent by Facebook Users
- Users spend an average of 30 to 33 minutes per day on Facebook globally.
- Facebook ranks among the top five social platforms worldwide in average daily engagement time.
- American adults spend approximately 31 minutes per day using Facebook.
- Video content accounts for an increasing share of time spent on the platform, particularly through Reels and short-form clips.
- Users aged 18 to 24 spend more time on Facebook than older demographics, often exceeding 35 minutes daily.
- The average user opens Facebook several times per day, contributing to its strong daily active user numbers.
- Time spent on Facebook has stabilized after declining slightly during the rapid growth of short-video competitors.
- Group participation and Marketplace browsing have increased session lengths for many users.
- Facebook remains one of the few social networks where users frequently engage in both passive browsing and active interactions such as commenting and messaging.
Pages with the Highest Engagement Rates on Facebook
- Facebook pages with fewer than 10,000 followers capture the highest engagement, averaging over 0.25% per post.
- The median engagement rate across all Facebook pages sits at approximately 0.06% per post.
- Photo posts yield 0.15% engagement, significantly outperforming link posts which average just 0.05%.
- Facebook Reels deliver engagement rates up to 22% higher than traditional video formats on the platform.
- Sports organizations secure the highest industry engagement rate at 0.29% due to passionate fan communities.
- Media companies maintain strong engagement by publishing an average of 7.5 daily posts for breaking news.
- Local businesses achieve up to 3x higher engagement than large brands through localized community connections.
- Status updates containing questions receive up to 20% more interactions compared to standard promotional content.
- Facebook pages posting 4.7 times per week observe better engagement than those posting multiple times daily.
Most-Followed Pages on Facebook
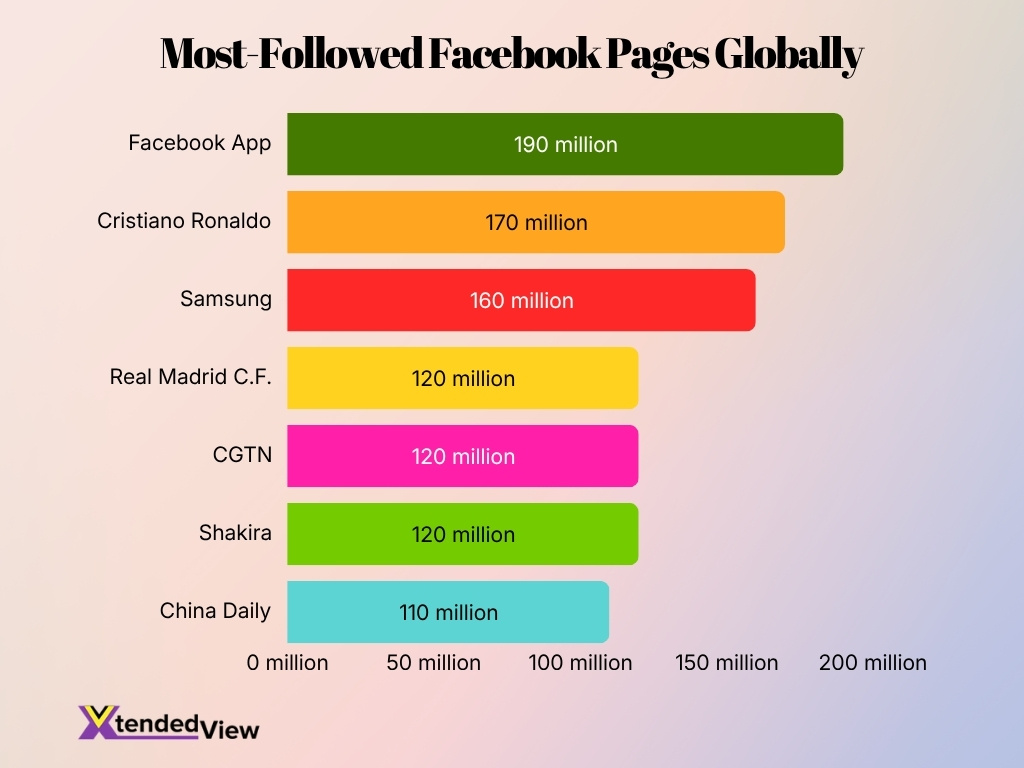
- The official Facebook App page remains the most-followed page on the platform with more than 190 million followers.
- Football star Cristiano Ronaldo has accumulated over 170 million followers, making him one of the most-followed individuals on Facebook.
- Samsung continues to rank among the largest brand pages with more than 160 million followers.
- Real Madrid C.F. has attracted over 120 million followers, highlighting the popularity of global sports brands.
- CGTN remains one of the largest news publishers on Facebook with more than 120 million followers.
- Shakira continues to rank among the most-followed musicians, with over 120 million followers on the platform.
- China Daily has built an audience exceeding 110 million followers.
- Entertainment, sports, and news organizations dominate Facebook’s most-followed pages, with relatively few traditional consumer brands appearing in the top rankings.
- Pages with more than 100 million followers tend to benefit from strong international audiences rather than relying on a single country or region.
Video Consumption and Viewing Statistics on Facebook
- Over 1.25 billion people visit Facebook to watch videos every month.
- Users spend more than 60% of their app time watching videos.
- Video posts achieve a 135% higher organic reach than photo posts.
- An astonishing 85% of videos on the platform are watched without sound.
- Facebook Reels generate over 200 billion daily plays across the platform.
- Vertical video ads with sound deliver a 12% higher conversion rate.
- Facebook Live videos generate 3 times more engagement than pre-recorded ones.
- Around 62% of users are more likely to purchase after viewing a video.
- Videos shorter than two minutes are 50% more effective for viewer retention.
- Mobile devices account for roughly 60% of all video views on Facebook.
Usage Statistics of Facebook Stories
- More than 1 billion Stories are shared every day across Meta’s family of apps, including Facebook, Instagram, and Messenger.
- Facebook Stories continue to attract hundreds of millions of daily users, making the feature one of the platform’s most-used content formats.
- Approximately 58% of users say they visit a brand’s website after seeing a product or service in Stories.
- Around 50% of people have visited a website to buy a product after discovering it through Stories.
- Over 62% of users report becoming more interested in a brand or product after seeing it in Stories.
- Vertical video Stories generate significantly higher completion rates than static image Stories.
- Younger users, particularly those aged 18 to 34, account for the largest share of Facebook Stories engagement.
- Brands that use Stories alongside Feed posts generally achieve higher reach and better campaign performance than brands relying on one format alone.
- Story ads have become an important revenue stream because they provide a full-screen, mobile-first advertising experience.
Facebook Revenue Statistics
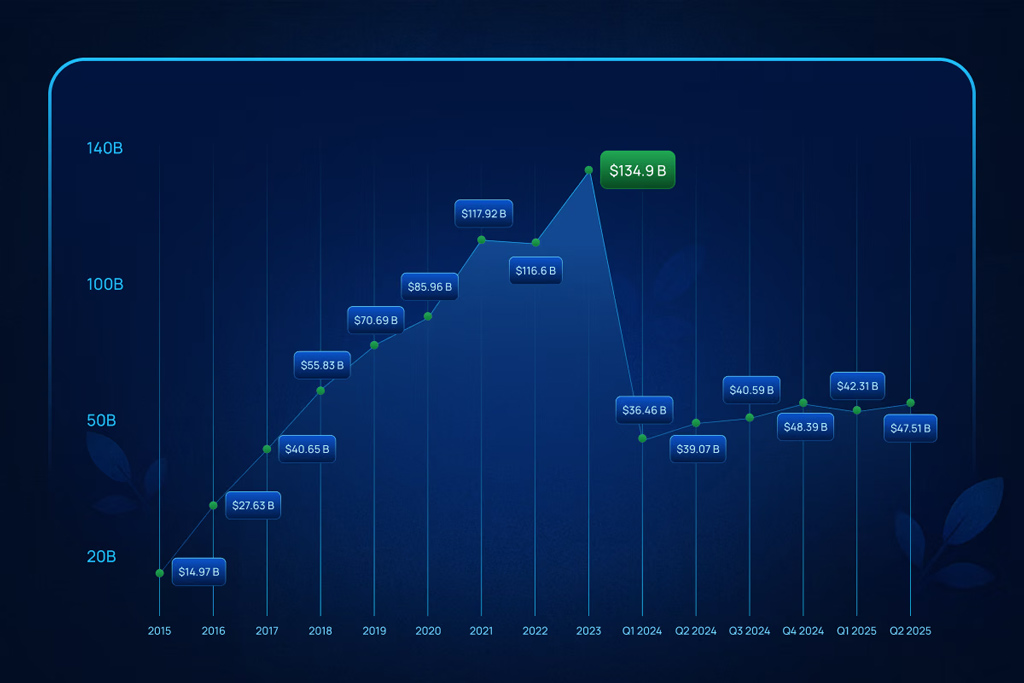
- Facebook’s annual revenue increased from $14.97 billion in 2015 to a record $134.9 billion in 2023.
- Revenue nearly doubled from $55.83 billion in 2018 to $117.92 billion in 2021.
- 2021 marked the first year Facebook generated more than $100 billion in annual revenue.
- After reaching $117.92 billion in 2021, annual revenue slightly declined to $116.6 billion in 2022.
- 2023 became Facebook’s highest revenue year, reaching $134.9 billion.
- Q1 2024 revenue stood at $36.46 billion, the lowest quarterly figure shown in the chart.
- Revenue increased from $36.46 billion in Q1 2024 to $48.39 billion in Q4 2024, showing steady quarterly growth.
- Q4 2024 recorded the highest quarterly revenue in the dataset at $48.39 billion.
- Q1 2025 revenue measured $42.31 billion, lower than the previous quarter but higher than Q1 2024.
- Q2 2025 revenue climbed to $47.51 billion, indicating continued year-over-year growth.
Advertising Revenue and CPM Trends on Facebook
- Meta generated approximately $200.97 billion in revenue in 2025, with advertising accounting for more than 97% of total revenue.
- Advertising revenue increased by roughly 22% year over year in 2025, driven by stronger ad demand and improved targeting technologies.
- The United States and Canada remain Meta’s most profitable advertising markets despite representing a relatively small share of users.
- Average Facebook CPM rates in the United States typically range between $8 and $15, depending on audience targeting and industry.
- Finance, legal, and technology advertisers generally pay some of the highest CPM rates on Facebook.
- Facebook still commands one of the largest digital advertising audiences in the world, reaching over 3 billion monthly users.
- More than 10 million advertisers actively use Meta’s advertising tools worldwide.
- Mobile devices generate more than 94% of Meta’s advertising revenue, reflecting user behavior on smartphones.
- AI-powered ad tools have improved campaign efficiency by helping advertisers automate creative production and audience targeting.
Reactions and Comment Statistics on Facebook
- Facebook’s algorithm prioritizes interactive posts, driving up to 3x broader organic reach across the platform.
- Photo posts secure a 0.08% average engagement rate, which is more than double the 0.03% earned by link posts.
- Question-based content can elevate comment activity by up to 100% when compared to standard promotional updates.
- With 3.07 billion monthly users, Facebook sees billions of reactions daily as its primary engagement signal.
- Positive emotional posts frequently generate up to 33% more reactions and shares than neutral content.
- Video posts maintain a 0.06% engagement rate, yielding significantly higher comment volumes than basic text updates.
- Facebook Groups experience 30% to 50% higher comment rates than public Pages due to concentrated community interactions.
- Publishing during peak audience hours routinely delivers 18% higher reaction rates than posting during off-peak times.
- Local businesses observe nearly 2x higher comment rates as users actively inquire about specific products and services.
Why People Use Facebook
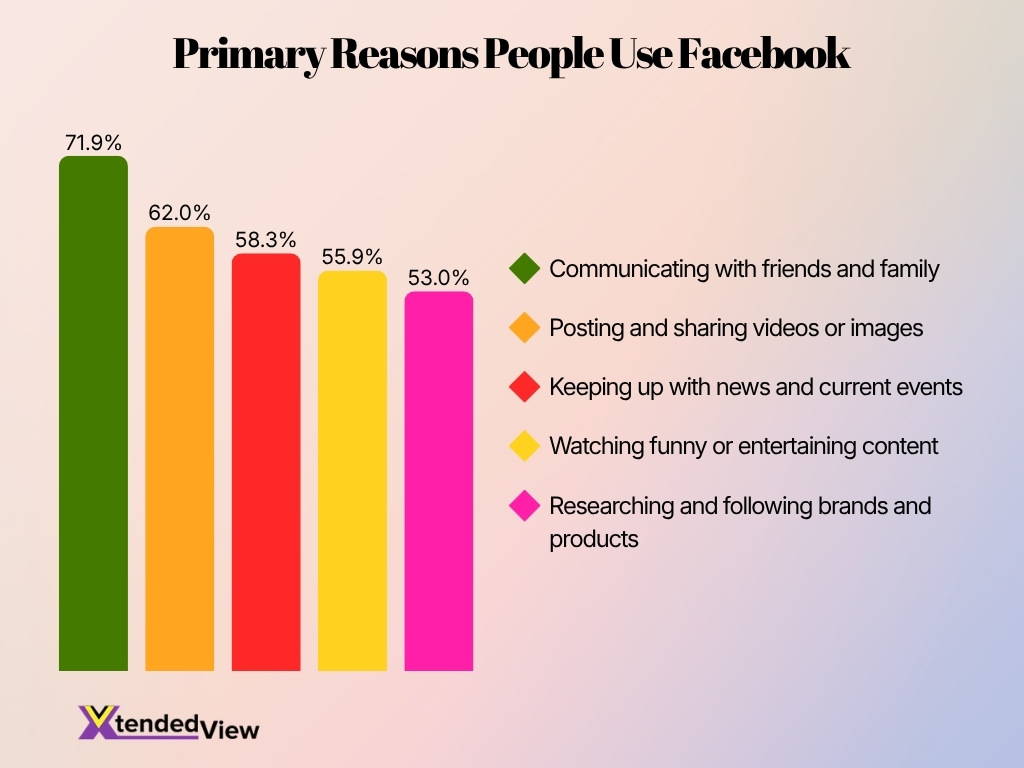
- 71.9% of Facebook users primarily use the platform for communicating with friends and family, making it the top activity.
- 62.0% of users use Facebook for posting and sharing videos or images, highlighting its strong role in social content sharing.
- 58.3% of users rely on Facebook for keeping up with news and current events, showing its importance as a news discovery platform.
- 55.9% of users visit Facebook to watch funny or entertaining content, reflecting the platform’s popularity for digital entertainment.
- 53.0% of users use Facebook to research and follow brands and products, demonstrating its value for brand engagement and product discovery.
- More than 7 in 10 users use Facebook to stay connected with people they know, reinforcing its core purpose as a social networking platform.
- Over 6 in 10 users actively share visual content, indicating that photos and videos remain a major driver of user engagement.
- More than half of Facebook users use the platform for news, entertainment, and brand research, making it a versatile destination beyond social interaction.
Messenger and Chat Usage Statistics on Facebook
- More than 1 billion people use Messenger every month worldwide.
- Messenger remains one of the most popular messaging apps in the United States by monthly active users.
- Over 140 billion messages are exchanged daily across Meta’s messaging services, including Messenger, WhatsApp, and Instagram Direct.
- Approximately 20 billion messages are exchanged between businesses and consumers every month on Messenger.
- More than 40 million businesses actively use Messenger to communicate with customers.
- Messenger supports over 100 languages, helping businesses reach global audiences.
- Click-to-message advertising has become one of Meta’s fastest-growing advertising categories.
- Consumers increasingly use Messenger to request customer support, product information, and appointment bookings.
- AI-powered chat tools and automated responses are becoming more common across business messaging experiences on Messenger.
Marketplace Usage Statistics
- Over 1.2 billion monthly active users globally utilize the marketplace to browse, buy, or sell products.
- The platform currently hosts more than 250 million sellers who actively list various products worldwide.
- Over 300 million individuals in the United States alone utilize the marketplace to make their purchases.
- Approximately 33% of young adults aged 18 to 34 report frequently buying or selling furniture on the platform.
- Roughly 16% of the active monthly user base logs into the main application solely to browse the marketplace.
- Almost 70% of all transactions take place between buyers and sellers located within 100 kilometers of each other.
- More than 33% of small businesses in the United States leverage the platform as a primary sales channel.
- Approximately 54.2% of users who interact with marketplace advertisements eventually proceed to complete a purchase.
- The secondhand furniture market driven by the platform is projected to reach a valuation of $25.20 billion by 2025.
Frequently Asked Questions (FAQs)
Facebook has approximately 3.07 billion monthly active users worldwide in 2026, making it the world’s largest social networking platform.
Facebook records around 2.11 billion daily active users, meaning nearly 68.7% of monthly users log in every day.
About 54.33% of the world’s active internet users use Facebook every month.
India ranks first with approximately 375 million to 581.6 million Facebook users, depending on the measurement methodology and reporting period, followed by the United States with around 194 million to 254 million users.
Approximately 37.7% of the global population uses Facebook every month, while about 25.8% of the world’s population uses it daily.
Conclusion
Facebook enters the year as the world’s largest social networking platform, with more than 3 billion monthly active users and over 2 billion daily users. Despite growing competition from short-form video apps, the platform continues to expand through AI-driven recommendations, mobile-first experiences, and powerful advertising tools.
The numbers also show that Facebook has evolved far beyond a social networking site. Businesses use Facebook Ads and Messenger to acquire customers, local communities rely on Marketplace for commerce, and creators increasingly depend on video and Stories to reach audiences. With billions of users spread across every major region, Facebook remains one of the most influential digital platforms for communication, advertising, and online commerce.
