



Online shopping continues to reshape how consumers discover, compare, and buy products across the United States and worldwide. Retailers now rely on e-commerce data to optimize pricing, inventory, and customer experiences, while brands use shopper insights to improve marketing campaigns and omnichannel strategies. As AI-powered recommendations, mobile commerce, and digital payments become more common, understanding the latest online shopper statistics helps businesses and consumers make informed decisions. Explore the data below to see how online shopping continues to evolve.
Editor’s Choice
- The global e-commerce market is projected to generate $3.88 trillion in revenue in 2026, up from $3.66 trillion in 2025.
- The United States is expected to remain the largest e-commerce market, generating approximately $1.22 trillion in online retail revenue during 2026.
- Global e-commerce revenue is forecast to grow at a 6.84% CAGR between 2026 and 2030, reaching around $5.05 trillion by 2030.
- Worldwide internet penetration reached 73.8% in 2026, providing a larger base of potential online shoppers than in previous years.
- Online marketplaces continue to dominate digital retail, while smartphones account for nearly 80% of global retail website visits in 2025.
- Business e-commerce sales across 45 economies reached $28 trillion in 2024, highlighting continued growth across digital commerce ecosystems.
- Global online shopping continues to benefit from expanding internet access, AI-driven personalization, and stronger mobile commerce adoption across both developed and emerging markets.
Recent Developments
- Google introduced Universal Cart in 2026, allowing shoppers to manage purchases across multiple merchants through AI-assisted shopping experiences.
- U.S. e-commerce represented 16.9% of total retail sales during Q1 2026, while online sales increased 9.8% year over year, significantly outpacing overall retail growth.
- AI-powered shopping referrals generated nearly 50% higher conversion rates than traditional organic search traffic for many online merchants during early 2026.
- AI-referred orders grew by approximately 13 times year over year during Q1 2026, reflecting rapid adoption of conversational shopping tools.
- More than half of AI-driven shopping sessions now begin directly on product pages, reducing the number of browsing steps before purchase.
- China’s live-commerce market approached $900 billion during 2025, making it one of the world’s largest digital shopping ecosystems.
- Global online marketplaces continue expanding cross-border capabilities through faster logistics, localized payment methods, and AI-powered product discovery.
- Digital wallet usage continues to increase worldwide, strengthening checkout speed and mobile shopping adoption across major retail markets.
Number of Online Shoppers Worldwide
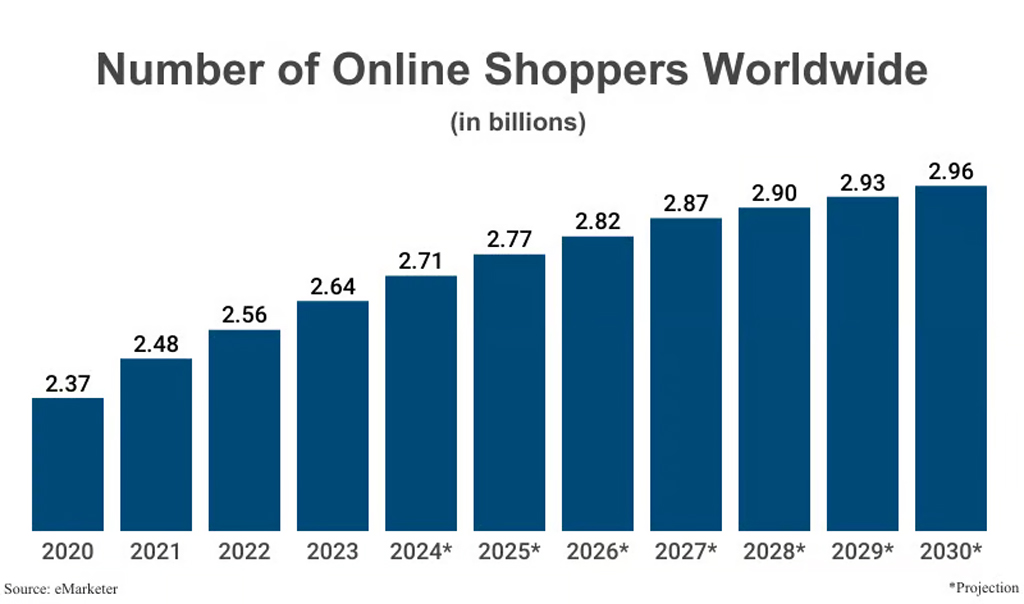
- The number of online shoppers worldwide increased from 2.37 billion in 2020 to a projected 2.96 billion by 2030, highlighting the continued expansion of global e-commerce.
- Between 2020 and 2023, the online shopping population grew by 270 million people, rising from 2.37 billion to 2.64 billion.
- In 2024, the global online shopper base is projected to reach 2.71 billion, reflecting steady year-over-year growth.
- The number of digital shoppers is expected to climb to 2.82 billion in 2026, adding approximately 110 million new online shoppers compared to 2024.
- By 2027, worldwide online shoppers are forecast to total 2.87 billion, demonstrating sustained consumer adoption of online retail.
- The global online shopping audience is projected to surpass 2.90 billion in 2028, marking another milestone for the e-commerce industry.
- In 2029, the number of online shoppers is expected to reach 2.93 billion, indicating that growth remains positive even as the market matures.
- By 2030, nearly 3 billion people (2.96 billion) are projected to shop online, underscoring the widespread adoption of digital commerce worldwide.
- Over the entire 2020 to 2030 period, the global online shopper base is expected to grow by approximately 590 million people, reflecting strong long-term market expansion.
- The projections suggest that online shopping will continue attracting tens of millions of new consumers each year, driven by increasing internet access, smartphone usage, and digital payment adoption.
Online Shopping Market Size
- Worldwide e-commerce revenue is expected to reach $3.88 trillion during 2026.
- Global online retail revenue totaled approximately $3.66 trillion during 2025 before rising further in 2026.
- The United States accounts for the largest national e-commerce market with projected revenue of $1.22 trillion in 2026.
- Average revenue per online shopper is expected to reach approximately $1,100 globally during 2026.
- Global e-commerce revenue is forecast to surpass $5 trillion by 2030 if current growth continues.
- Business e-commerce sales across reporting economies reached $28 trillion in 2024, reflecting both B2B and B2C digital commerce expansion.
- Developing economies continue to record faster average growth in business e-commerce than many mature markets.
- Digital commerce remains one of the fastest-growing retail channels worldwide because of wider internet availability and improved digital payment infrastructure.
Online Shopping Penetration
- Global online shopping penetration is projected to reach 54.3% during 2026.
- Market penetration is expected to increase further to approximately 58.1% by 2030.
- Global internet penetration increased from 73.7% in 2025 to 73.8% in 2026, supporting continued e-commerce adoption.
- Internet usage has expanded dramatically from 42.8% in 2016 to nearly 74% in 2026.
- Northern Europe continues to report the world’s highest internet penetration, supporting strong online shopping activity.
- Mobile-first markets continue recording faster increases in online shopping participation than desktop-centric markets.
- Improved digital payment infrastructure continues increasing consumer confidence in online purchases across developing economies.
- Retailers increasingly focus on omnichannel experiences as more consumers move seamlessly between physical stores and online platforms.
Online Shopping Frequency Statistics
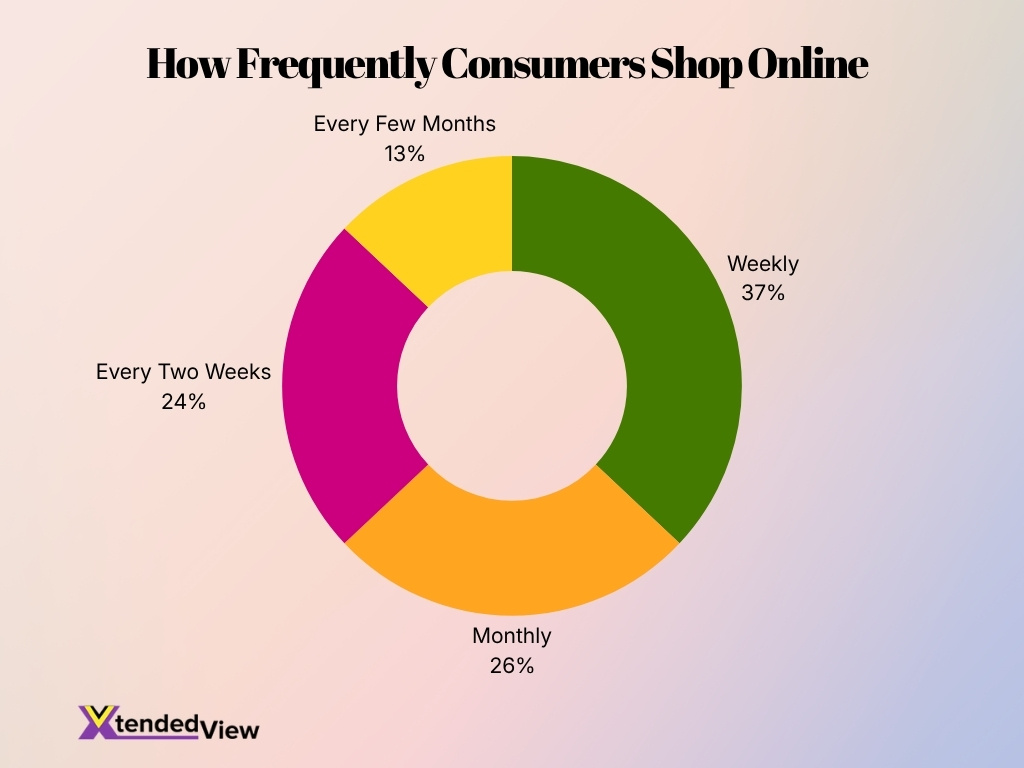
- Weekly shopping is the most common habit, with 37% of consumers making online purchases every week, highlighting the growing role of e-commerce in everyday life.
- Around 26% of shoppers buy products once a month, showing that monthly purchasing remains a major shopping pattern for many consumers.
- Nearly 24% of online shoppers make purchases every two weeks, indicating that biweekly shopping is also a popular routine across digital marketplaces.
- Only 13% of consumers shop online every few months, making it the least common shopping frequency among the surveyed groups.
- Combined, 61% of consumers shop online at least every two weeks, demonstrating that a majority of shoppers engage with e-commerce platforms on a regular basis.
- The data suggests that frequent online shopping has become the norm, with most consumers returning to online stores multiple times throughout the month.
- Retailers can benefit by targeting weekly and biweekly shoppers through loyalty programs, personalized recommendations, and recurring promotions to encourage repeat purchases.
Global Online Shopping Growth
- Global e-commerce revenue is expected to increase from $3.66 trillion in 2025 to $3.88 trillion in 2026.
- The market is projected to grow at a 6.84% annual rate through 2030.
- Business e-commerce sales in reporting economies grew 4.4% in 2024 despite moderating from pandemic-era growth rates.
- Online commerce continues expanding faster in many developing economies than in mature markets because of improving digital infrastructure.
- Smartphones now generate nearly four out of every five retail website visits, reinforcing mobile commerce growth.
- AI-assisted shopping experiences are accelerating product discovery, personalization, and conversion rates across online stores.
- Cross-device shopping journeys continue increasing as consumers begin purchases on mobile devices and complete them across multiple channels.
- Continued investment in AI, logistics, digital payments, and international fulfillment is expected to sustain strong online shopping growth throughout the remainder of the decade.
E-commerce Revenue Trends
- Global e-commerce revenue is projected to reach $3.88 trillion in 2026, up from $3.66 trillion in 2025.
- The global e-commerce market is forecast to grow at a 6.8% CAGR, exceeding $5 trillion by 2030.
- The United States remains the largest market, accounting for over $1.2 trillion in annual online retail sales.
- Mobile transactions currently account for 67% of all global cross-border purchases.
- AI-powered personalization can boost overall online revenue by up to 40%.
- Conversational AI chat tools have been shown to increase conversion rates by 4x, reaching up to 12.3%.
- The global cross-border e-commerce market is expected to reach a valuation of $1.74 trillion in 2026.
- Mobile devices are now responsible for driving between 65% and 75% of all online shopping traffic.
- Global e-commerce sales will represent 21.8% of total retail purchases worldwide in 2026.
- B2C online transactions currently dominate the international market with a 56% overall participation rate.
Online Shopper Demographics
- Around 2.8 billion people worldwide are projected to make at least one online purchase in 2026.
- Gen Z will represent 17% of global retail spending by 2030.
- Approximately 60% of Millennials shop online at least once a week.
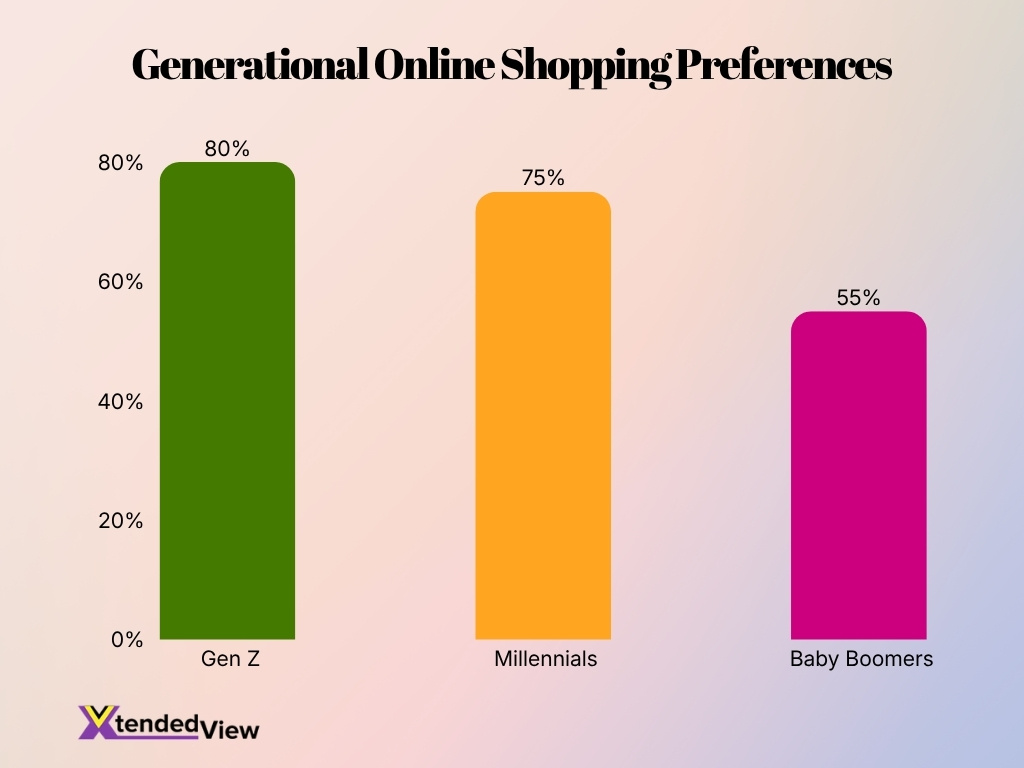
- Over 50% of Gen Z consumers prefer to shop online.
- Almost 80% of Gen Z’s shopping occurs online.
- 75% of Millennials prefer online shopping.
- 44% of Gen Z have used Buy Now, Pay Later in the past 12 months.
- 45% of Gen Z consumers discover new products through social media.
- 60% of Gen Z consumers are influenced by influencer recommendations when making purchasing decisions.
- 55% of Baby Boomers shop online, though this segment is growing rapidly.
Mobile vs Desktop Shopping
- Mobile devices generate approximately 78% of global e-commerce traffic, making smartphones the primary shopping discovery channel.
- Mobile commerce is projected to reach $2.4 trillion in 2026, supported by continued smartphone adoption and improved checkout experiences.
- According to analysis of more than 65 million orders, 72% of online orders now originate from mobile devices.
- Despite mobile’s higher order volume, desktop shoppers spend approximately 2.3 times more per order than mobile users.
- Average mobile e-commerce conversion reached 2.41% in early 2026, exceeding the desktop average of 2.05%.
- Mobile cart abandonment remains higher than desktop because shoppers often browse on phones before completing purchases later.
- Retailers continue investing in one-click checkout, digital wallets, and mobile app optimization to improve smartphone conversion rates.
- Cross-device shopping journeys remain common, with consumers researching products on mobile before completing purchases on desktop or tablet.
Average Order Value
- Desktop shoppers spend an average of $112 per order compared to just $89 for mobile users.
- Implementing free shipping thresholds increases the average order value by up to 30%.
- Customers using Buy Now, Pay Later (BNPL) services have an average order value that is 41% higher.
- Personalized product recommendations can drive a 26% increase in a customer’s average basket size.
- Returning customers consistently maintain an average order value that is 3x higher than first-time buyers.
- E-commerce sites using product bundling report a 15% to 20% boost in their average order value.
- The global average order value across all retail e-commerce platforms stands at approximately $105.
- Orders originating from social media referrals typically have a 22% lower average order value than direct traffic.
Product Categories Bought Online
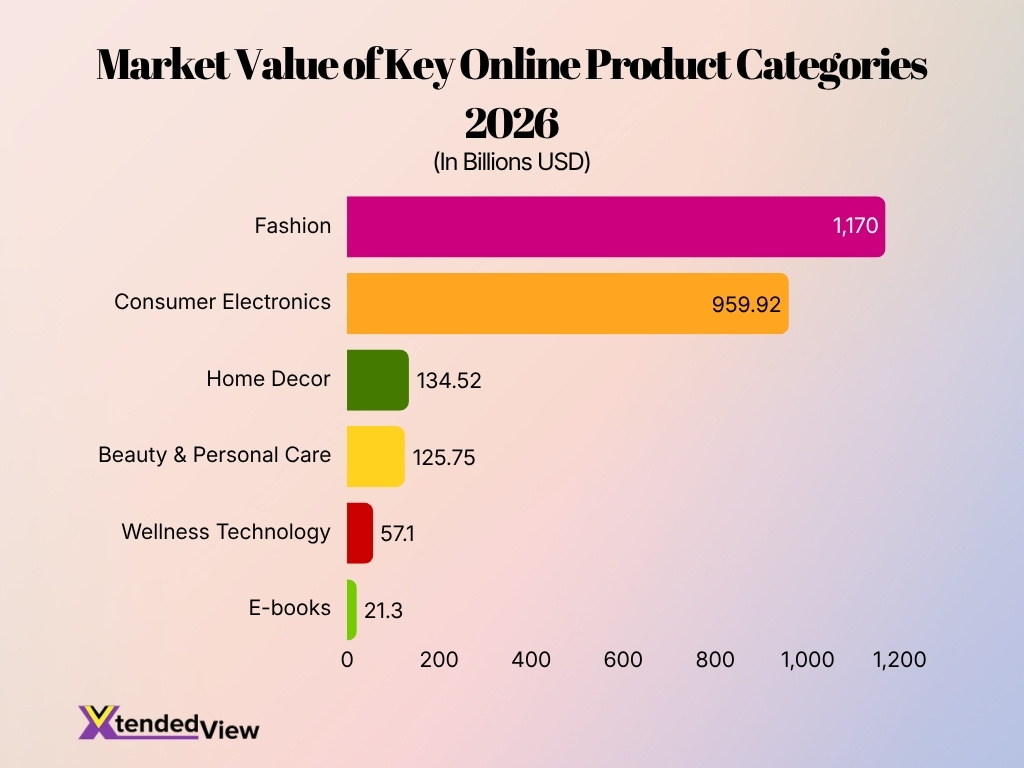
- The global fashion e-commerce market is expected to reach $1.17 trillion by the end of 2026.
- The global consumer electronics e-commerce market is projected to reach $959.92 billion by the end of 2026.
- The online beauty and personal care market is projected to be valued at $125.75 billion globally in 2026.
- Online home decor sales are estimated to reach $134.52 billion globally in 2026, growing steadily as retailers improve their policies.
- Fresh food categories contributed to 44% of digital grocery demand globally.
- Wellness technology alone is valued at $57.1 billion, expanding rapidly through digital health tracking apps.
- Global e-book revenue is projected to hit $21.3 billion in 2026, driven by high subscription revenues.
- 64% of consumers purchase products online across multiple retail categories, indicating a strong preference for diverse online shopping rather than limiting purchases.
Cart Abandonment Rate
- The global average online shopping cart abandonment rate remains around 70%, meaning roughly seven out of ten carts never convert into purchases.
- Mobile devices experience an abandonment rate of approximately 85.6%, considerably higher than desktop shopping.
- Unexpected shipping costs remain the leading reason shoppers leave checkout before completing purchases.
- According to a global survey, 67% of shoppers have abandoned a cart because of unsatisfactory delivery options.
- Only about one-quarter of shoppers report that they never abandon shopping carts during checkout.
- Simplified checkout experiences, guest checkout, and digital wallets continue reducing abandonment rates.
- Cart abandonment costs the global e-commerce industry hundreds of billions of dollars in lost revenue every year.
- Email cart recovery campaigns continue recovering a measurable share of abandoned purchases, although recovery rates remain below 10% on average.
Online Payment Methods
- Digital wallets accounted for approximately 31% of global e-commerce payments in 2025 and remain the fastest-growing online payment method heading into 2026.
- Credit and debit cards continue to play a major role, with 34% of global e-commerce transactions completed using payment cards.
- Global Buy Now, Pay Later (BNPL) transaction volume reached approximately $334 billion in 2025 as flexible financing became more popular.
- PayPal reported approximately 435 million active consumer and merchant accounts worldwide by the end of 2025.
- PayPal processed roughly $1.53 trillion in total payment volume during 2025, representing continued growth in digital commerce.
- Digital wallet usage increased 18% year over year during 2025 and is expected to continue expanding through 2026.
- Around 73% of card payments across Europe are now contactless, reflecting consumers’ preference for faster checkout experiences.
- Digital wallets represented approximately 50% of global e-commerce payment value during 2025, making them the largest online payment category worldwide.
Why Consumers Prefer Shopping Online
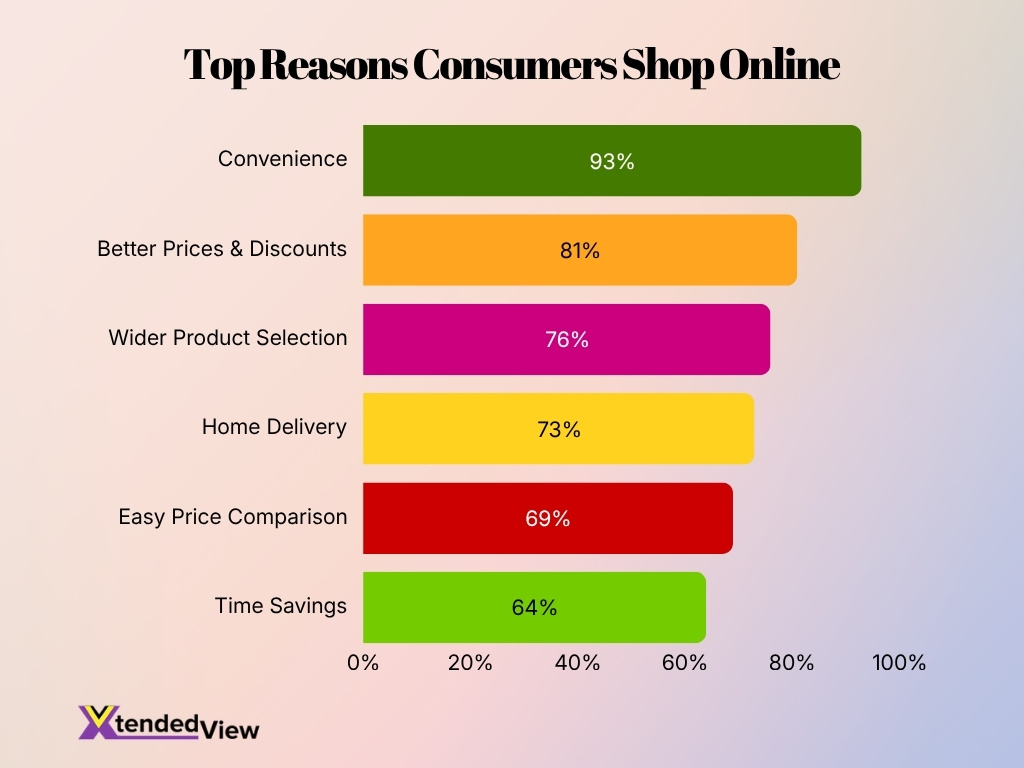
- Convenience is the leading reason, with 93% of shoppers choosing online shopping because it allows them to purchase products easily from almost anywhere.
- Better prices and discounts attract 81% of consumers, showing that promotional offers and competitive pricing strongly influence online buying decisions.
- Around 76% of shoppers value wider product selection, as online stores often provide more brands, sizes, styles, and product options than physical stores.
- Home delivery is important to 73% of consumers, reducing the need to travel and making purchases more accessible and comfortable.
- Nearly 69% of shoppers prefer easy price comparison, which helps them evaluate multiple sellers and find better deals before completing a purchase.
- Time savings influence 64% of online shoppers, highlighting how digital shopping helps consumers avoid queues, store visits, and lengthy product searches.
Cross-Border Online Shopping
- International e-commerce continues to expand as consumers increasingly purchase products from overseas retailers to access broader product selections and competitive pricing.
- According to international transaction data, 61% of cross-border online orders are still paid using credit or debit cards.
- Digital wallets account for approximately 26% of international online purchases, highlighting their growing role in cross-border commerce.
- BNPL represents approximately 6% of international online orders, with adoption continuing to grow among younger shoppers.
- In Germany, PayPal accounts for approximately 53% of cross-border online orders, demonstrating strong local payment preferences.
- In the United States, payment cards remain dominant, representing approximately 63% of international e-commerce transactions.
- 69% of U.S. small and medium-sized businesses expect to use traditional banks for cross-border payments during 2026, while fintech providers continue gaining market share.
- Payment providers continue investing in interoperable digital wallets and localized checkout options to simplify international online shopping.
AI in Online Shopping
- AI-assisted shopping referrals generated nearly 50% higher conversion rates than traditional organic traffic for many online retailers during early 2026.
- AI-generated shopping orders increased by approximately 13 times year over year during the first quarter of 2026.
- More than half of AI-powered shopping sessions now begin directly on product pages instead of traditional search result pages.
- AI-powered recommendation engines continue increasing average order values through personalized product suggestions and cross-selling.
- 74% of consumers surveyed across Asia-Pacific reported already using AI to help discover or shop for products online.
- Security and transparency remain the leading concerns preventing some consumers from allowing AI to complete purchases automatically.
- Payment companies are integrating AI into fraud detection, identity verification, and checkout optimization to improve both security and shopping experiences.
- Agentic commerce is emerging rapidly, with businesses preparing for AI systems that can research, compare, and complete purchases on behalf of consumers.
Holiday Shopping Channel Preferences Statistics
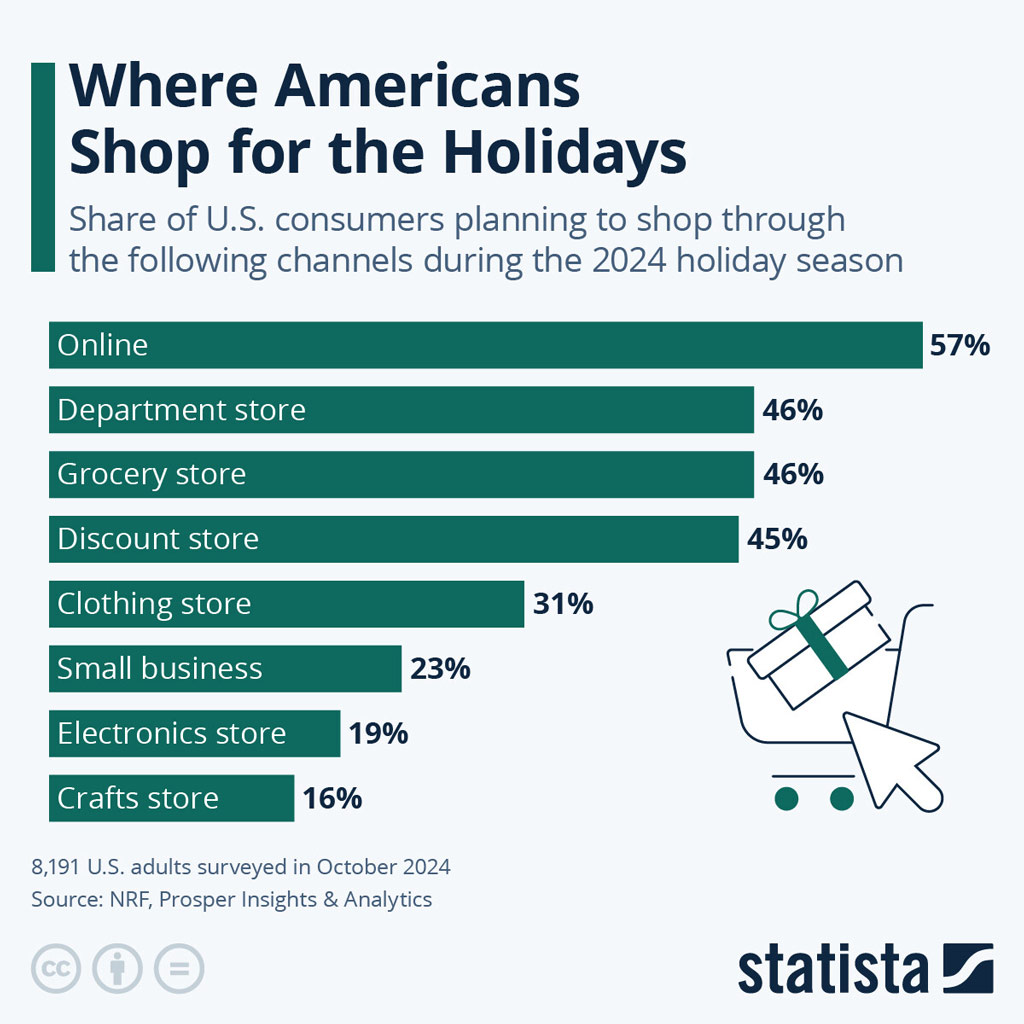
- Online shopping is the most popular holiday shopping channel, with 57% of U.S. consumers planning to make purchases online during the 2024 holiday season.
- Department stores remain a major shopping destination, as 46% of shoppers intend to visit them for their holiday purchases.
- Grocery stores are equally popular, with 46% of consumers planning to buy holiday-related items while shopping for groceries.
- Discount stores closely follow, attracting 45% of holiday shoppers looking for value and savings.
- Clothing stores are expected to be visited by 31% of consumers, making apparel one of the leading specialty shopping categories.
- Small businesses will receive support from 23% of shoppers, highlighting continued interest in shopping locally during the holiday season.
- Electronics stores are on the shopping list for 19% of consumers, reflecting demand for tech products and gadgets as holiday gifts.
- Crafts stores rank last among the listed channels, with 16% of shoppers planning to purchase holiday supplies or gifts from these retailers.
- The survey findings are based on responses from 8,191 U.S. adults, providing a broad view of consumer holiday shopping intentions.
- Overall, the data shows that online shopping (57%) continues to lead holiday retail preferences, while traditional brick-and-mortar stores such as department, grocery, and discount stores (45%–46%) remain highly relevant.
Social Commerce Shopping Statistics
- China’s live-commerce market reached approximately $900 billion in 2025, rivaling the entire United States e-commerce sector.
- Gen Z and Millennial social media users are expected to account for 62% of global social commerce spending.
- AI-powered recommendation tools in social commerce platforms have driven conversion rate improvements of 25% to 40%.
- Mobile devices remain the primary channel, with over 95% of social media usage occurring on smartphones.
- Livestream shopping delivers up to 3x higher conversion rates compared to traditional e-commerce experiences.
- 62% of shoppers report that customer reviews are the biggest factor influencing their social media-driven purchases.
- Retailers integrating seamless direct checkout features capitalize on a market projected to reach $12.6 billion globally by 2034.
Consumer Trust and Security in Online Shopping
- Over 17% of online shoppers abandon their carts because they don’t trust the site with their credit card information.
- Nearly 83% of consumers will stop shopping at a business altogether following a confirmed data breach.
- Approximately 70% of online buyers specifically look for trust badges and security seals before completing a checkout.
- Implementing AI-powered fraud detection can reduce false transaction declines by up to 70%.
- The use of tokenized payments is proven to reduce e-commerce fraud rates by 26% globally.
- Nearly 60% of digital shoppers prefer using biometric authentication for faster and safer payment processing.
- Over 42% of users cite robust buyer protection policies as their top reason for choosing specific digital wallets.
- Displaying clear return policies and transparent pricing can increase overall checkout conversion rates by 20%.
Frequently Asked Questions (FAQs)
Approximately 2.7 billion people are expected to shop online worldwide in 2026.
E-commerce is projected to account for 20.5% of worldwide retail sales in 2025 and is expected to reach 22.5% by 2028.
The average global e-commerce conversion rate is approximately 2.8% in 2026.
Mobile devices generate approximately 63% of global e-commerce traffic.
Global e-commerce sales are forecast to reach approximately US$6.4 trillion in 2026.
Conclusion
Online shopping continues to grow as consumers embrace mobile commerce, AI-powered shopping experiences, digital wallets, and flexible payment options. Meanwhile, retailers are investing in personalization, secure checkout, cross-border fulfillment, and omnichannel experiences to meet changing customer expectations.
Looking ahead, AI-assisted purchasing, social commerce, stronger fraud prevention, and seamless digital payment experiences will continue shaping the future of e-commerce. Businesses that monitor these online shopper statistics can better understand consumer behavior, improve conversion strategies, and make more informed decisions in an increasingly competitive digital marketplace.
