
Instagram remains one of the most‑used social platforms globally, influencing everything from personal social habits to brand marketing campaigns. For example, retail brands now launch product drops directly via Instagram Stories, and media companies use Instagram Reels to reach younger college‑aged audiences. As the platform evolves, marketers, creators, and analysts alike need to understand the latest statistical trends. Explore the full article for the most up‑to‑date data and insights.
Editor’s Choice
Here are seven standout statistics you should know up front:
- Instagram had over 2 billion monthly active users in early 2025.
- Instagram ranks as the third most popular social media network worldwide in 2025.
- Users aged 18‑34 make up over 60 % of Instagram’s global audience.
- In the first half of 2025, the average engagement rate on Instagram was 0.45%, down about 24% year‑on‑year.
- More than 500 million Instagram Stories are used daily on the platform.
- In 2025, approximately 29% of Instagram users report having purchased on the platform.
- India is the country with the largest number of Instagram users, topping 390 million as of 2024.
Recent Developments
- Instagram introduced a major upgrade to its reposting feature; users can now repost public Reels and grid posts and view them in a dedicated “Reposted” tab.
- In 2025, Instagram published guidance discouraging “watermarks, engagement bait, reels over 90 seconds, non‑recommendable content, and posts you didn’t make” to improve organic reach outcomes.
- Platform algorithms now prioritise high‑interaction posts (saves, shares, comments) more than ever in feed, Stories, and Reels.
- Social‑media monitoring shows that Instagram’s engagement rate dropped by roughly 24.1% in early 2025 compared with the same period prior.
- Brands and creators are increasingly using mixed‑format content (Reels + Stories + carousels) to adapt to Instagram’s shift toward video‑first experiences.
- Instagram is responding to global scrutiny of youth safety with new moderation and content‑filtering initiatives (see teens‑focused restrictions).
- The wider social‑media landscape shows Instagram facing increased competition from platforms like TikTok, especially in growth markets outside the U.S.
- In the U.S., Instagram is now being used by a high share of social‑media users (around 79% in one source), indicating domestic maturity of the platform.
Global Instagram User Numbers
- As of early 2025, Instagram has over 2 billion monthly active users globally.
- A February 2025 report puts the number at “nearly 2 billion” monthly active users.
- Some sources estimate 2.11 billion monthly active users in 2025.
- One dataset estimates 1.74 billion users in January 2025 based on ad‑planning reporting.
- From 2019 to 2023, Instagram experienced over 127% growth in monthly active users.
- Some reporting suggests a drop in user numbers from 2.4 billion in 2023 to about 2.0 billion in 2024 (note: estimates vary).
- For marketers, the takeaway is that the user base remains enormous, but the growth pace may be moderating compared to earlier years.
Instagram Growth Trends
- Year‑on‑year engagement rate decline, average engagement was 0.45% in H1 2025, down 24.1%.
- Reels usage grew by more than 20% year‑over‑year as of 2025.
- Instagram’s global market share among social platforms is about 9.78% in 2025, according to one source.
- Users aged under 34 constitute 70% of the Instagram audience in 2025.
- One source reports that although user growth is large, in some regions growth has plateaued (e.g., Europe growth of 1.2% year‑over‑year).
- Brands report that the average time spent on Instagram remains significant (33 minutes daily), though figures vary.
- Social listening tools adoption among marketers rose, with 62% of social marketers using social‑listening tools in 2025.
- The increase in mixed‑format content (video + interactive) is a direct result of the algorithmic shift favouring Reels and Stories.
Most Popular Countries on Instagram
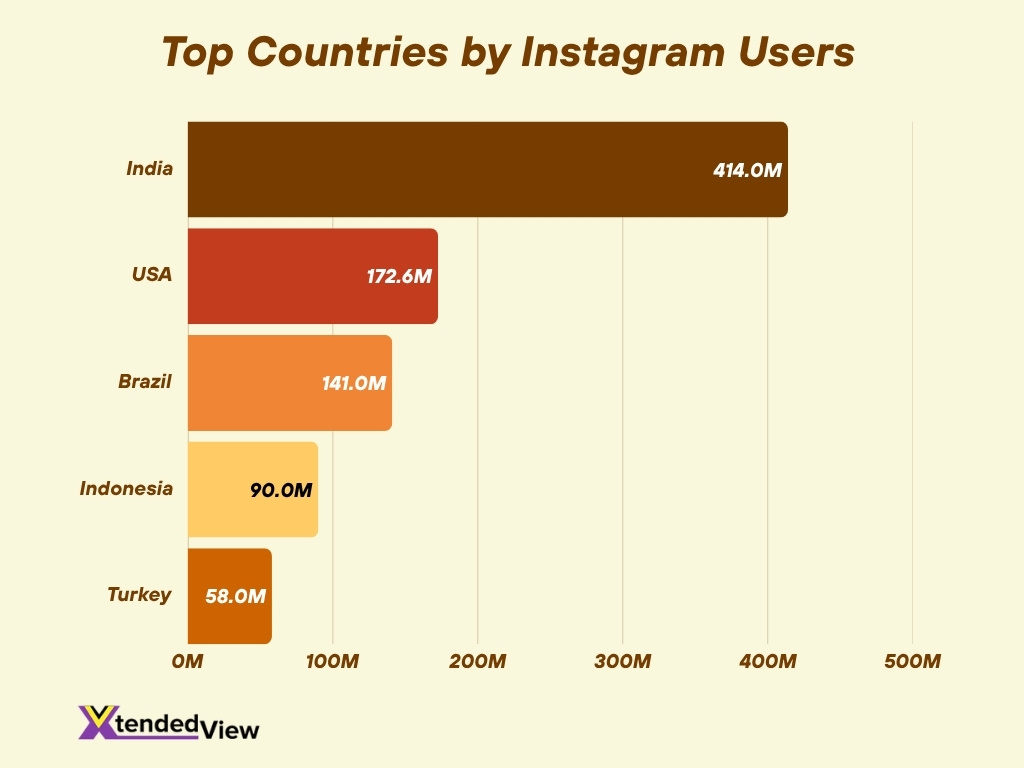
- As of 2024, India leads the list with over 392 million Instagram users.
- The United States holds the number two spot with about 172.6 million Instagram users (roughly half the U.S. population).
- Brazil follows with over 141 million Instagram users.
- Indonesia has just over 90 million Instagram users.
- Turkey is estimated to have 58 million users.
- In the U.S., about 79% of social‑media users are reported to be active on Instagram, showing strong penetration.
- For marketers targeting global audiences, these highest‑volume countries represent major opportunities for regional campaigns.
Regional Distribution of Instagram Users
- In early 2025, the ad‑reach audience of Instagram for users outside the U.S. was around 90.43% of the total reach of 1.88 billion users.
- The region of Asia‑Pacific (APAC) continues to dominate growth, with India alone accounting for 414 million Instagram users in early 2025.
- In India, Instagram’s ad reach was equivalent to about 28.4% of the total population at the start of 2025.
- Within India, Instagram’s ad‑reach among adults aged 18+ was about 37.6% in early 2025.
- Between January 2024 and January 2025 in India, Instagram’s potential ad audience grew by 51.0 million users, a +14.0% increase.
- In the U.S., as of 2025, about 76% of adults aged 18‑29 use Instagram.
- Approximately 51% of U.S. urban residents and 54% of suburban residents reported using Instagram in 2025.
- The Middle East and Africa region shows slower but steady Instagram adoption, though precise country‑level figures are less frequently published.
Instagram Demographic Breakdown
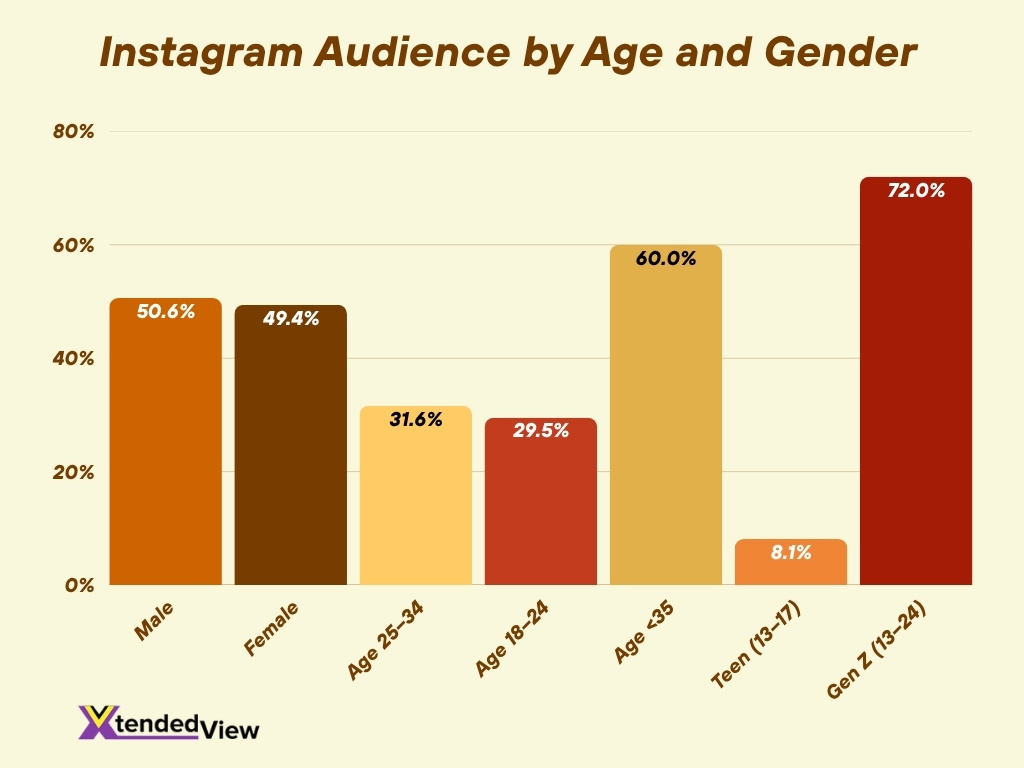
- Globally in 2025, Instagram’s gender split is nearly equal, about 50.6% male and 49.4% female.
- The largest age category worldwide is users aged 25‑34, at approximately 31.6%, followed by those aged 18‑24 at around 29.5%.
- In the United States, users aged 25‑34 comprise about 28.3% of Instagram’s audience, and users aged 18‑24 account for 26.5%.
- For users aged under 35 years, Instagram captures around 60%+ of its global audience in 2025.
- Among Gen Z (users aged 13‑24), approximately 72% turn to Instagram for customer service or engagement with brands.
- Teen users (13‑17) represent roughly 8.1% of Instagram’s overall user base.
- The platform maintains access across a broad income range, but detailed income‑segmented data is less readily published.
Instagram Reach and Penetration Rates
- As of January 2025, Instagram’s ad‑reach was at least 1.74 billion users globally.
- That number represented about 26.9% of all people aged 13+ globally, and about 33.3% if excluding China.
- Among all internet users worldwide, Instagram reached about 31.3% at the beginning of 2025.
- In 12 months (Jan 2024→Jan 2025), Instagram’s potential reach increased by +5.5% (+90.8 million users).
- In 2025, Instagram’s average reach rate (organic) is estimated at 3.50%, compared to Facebook’s 1.65%.
- In the U.S., about 58% of Instagram users say they use the platform to discover brands or products.
- Only around 16% of U.S. adults say they use Instagram as a primary news source.
Statistics on Instagram Usage
- In the 2025 index by Sprout Social, 29% of users reported purchasing on Instagram.
- In 2025, the average engagement rate across Instagram content dropped to about 0.50%, a year‑on‑year decline of 28%.
- In a U.S. study, 44% of Instagram users say they use the app for shopping each week.
- 70% of shoppers globally say they use Instagram to purchase products or services online.
- 99.9% of Instagram users are active on at least one other social media platform.
- 35% of Instagram users prefer Stories that include a mix of photo, text, and video.
- Among Gen Z users, 36% say Instagram is their starting point for online product searches.
Time Spent Per Day
- On average, users spend about 31 minutes and 40 seconds per day on Instagram globally.
- Another source estimates the U.S. adult average at 33.1 minutes each day.
- Users under age 25 reportedly spend about 32 minutes/day, while those over 25 average 24 minutes/day.
- Heavy social‑media users can spend up to 1 hour and 25 minutes/day on the platform.
- In some countries (e.g., Turkey) monthly average time per user exceeded 21 hours (42 minutes/day) in 2024‑25.
Top 10 Most-Followed Instagram Accounts
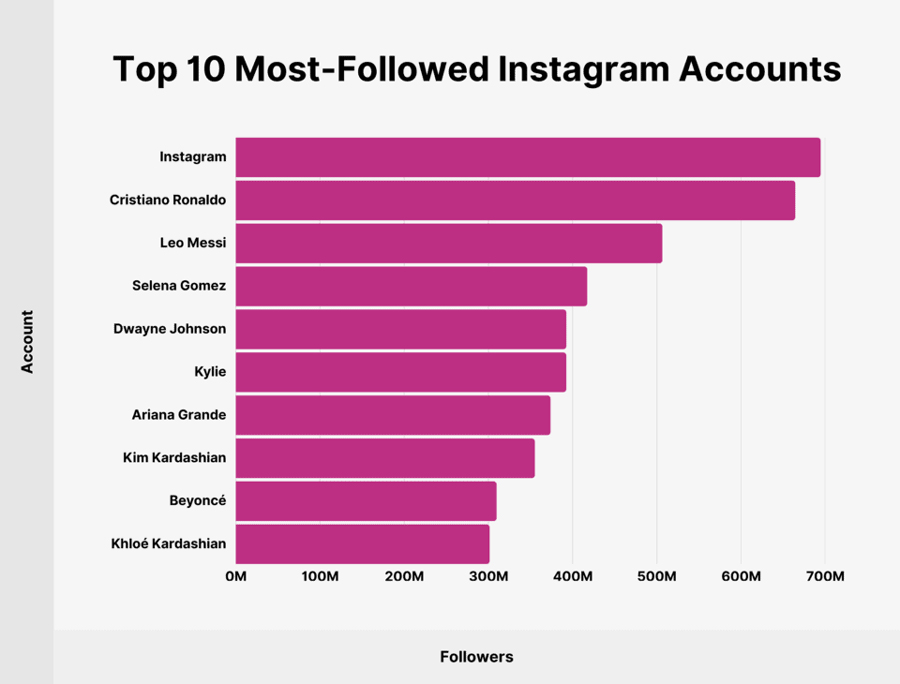
- Instagram holds the top spot with 700M followers, making it the most-followed account on the platform.
- Cristiano Ronaldo leads individual accounts with 600M followers, reinforcing his position as the most-followed person on Instagram.
- Leo Messi follows closely behind with 480M followers, maintaining strong global fan engagement.
- Selena Gomez ranks as the most-followed female celebrity with 430M followers.
- Dwayne “The Rock” Johnson secures 410M followers, showcasing influence across entertainment and fitness audiences.
- Kylie Jenner holds 400M followers, driven by beauty, lifestyle, and business influence.
- Ariana Grande remains one of the top musicians on the platform with 380M followers.
- Kim Kardashian continues her cultural dominance with 360M followers.
- Beyoncé, a global music icon, has 315M followers.
- Khloé Kardashian rounds out the top 10 with 310M followers, reflecting the Kardashian-Jenner family’s strong Instagram presence.
Device and App Usage Statistics
- In 2025, an estimate suggests that the average U.S. adult uses Instagram for 33.1 minutes per day, and users share 1.3 billion images on Instagram every day worldwide.
- Data indicates Instagram users are almost always active on other social platforms too, and 99.9% also use another service.
- Among teenagers, around 50% use Instagram at least once per day.
- Device access remains mobile‑first, most interactions derive from smartphones, aligning with global mobile OS shares (Android 72%, iOS 28% as of 2025).
- While precise app version usage stats are scarce, Instagram’s growth of Reels and Stories features indicates that mobile video consumption dominates.
Instagram Stories Statistics
- Approximately 500 million Instagram Stories are used daily across the platform.
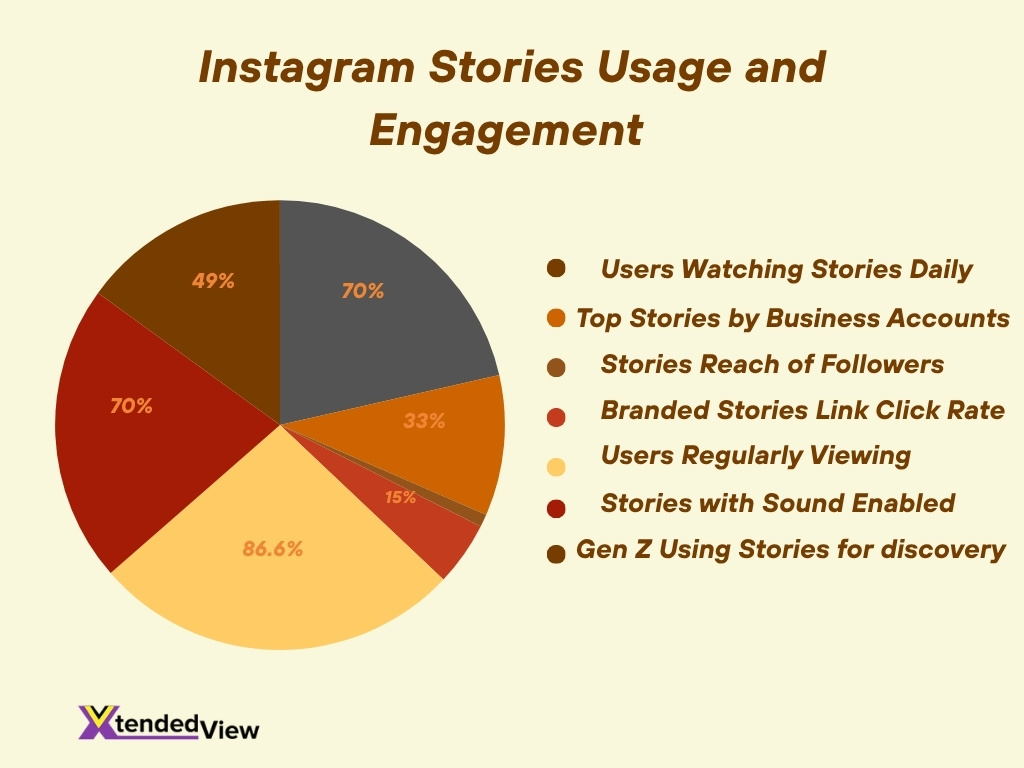
- Around 70% of Instagram users watch Stories each day.
- One‑third of the most‑viewed Stories are posted by business accounts.
- Stories reach about 2%‑9% of a user’s followers, compared to 13%‑27% for standard posts.
- Between 15%‑25% of viewers click links in branded Stories.
- Nearly 86.6% of Instagram users upload or view Stories regularly.
- For many brands, an average Story posting rate is 10 times per month, with top‑performers posting about 16+ times per month.
- Sound is enabled in roughly 70% of Stories, making audio‑on creative more relevant.
- Among Gen Z, approximately 49% use Stories to discover products or services.
Instagram Reels Statistics
- More than 2 billion users interact with Reels each month as of 2025.
- Over 200 billion Reels are played daily across Instagram and Facebook.
- Reels content is watched by roughly 726.8 million users, representing 55.1% of Instagram’s ad audience.
- Reels make up about 35% of total usage time on Instagram in 2025.
- On average, Reels reach 36% more users than carousels and 125% more than photo posts.
- Engagement benchmarks: Reels 1.23%, carousels 0.99%, image posts 0.70%.
- Nearly 694,000 Reels are sent via direct message every minute.
- Carousels still generate higher interaction rates overall than Reels in some contexts, with a reported 10.15% engagement for carousels in certain datasets.
- By 2025, more than 62% of influencer marketers plan to use Reels in their campaigns.
Content Preferences on Instagram
- According to recent data, users prefer short‑form video content like Reels over static image posts, with higher reach and engagement observed.
- Carousels are currently achieving the highest engagement rates in many industry reports (10.15%).
- Among content types, Reels have the highest reach rate at approximately 37.87% of all content impressions in 2025.
- Static image posts average engagement around 0.45% while Reels and carousels hover around 0.50%‑0.55% in many sectors.
- Humour and entertainment‑oriented Reels gain higher levels of interaction, with 50% of users preferring humorous content.
- Brands using a mix of Stories, Reels, and static posts see better performance than relying on one format alone.
- Interactive features (polls, quizzes, stickers in Stories) are increasingly preferred over plain photo posts.
- About 61% of Instagram users learn about friends’ activities through Stories rather than feed posts.
Key Statistics for Instagram Engagement
- The overall average engagement rate on Instagram is around 0.50% in 2025, a drop of 28% year‑on‑year.
- In some reports, the global average engagement rate is cited at 6.01%, though methodological differences apply.
- For influencer posts, the average engagement rate reported is 1.85% globally.
- For top brands, the median engagement rate is around 1.02%.
- Engagement for Story content often reaches 2%‑9% of followers for many accounts.
- Reels outperform other formats in reach/visibility but still see engagement rates near 1%‑1.2%.
- Posts with user mentions and tags drive up to 30% more engagement on average.
- Brands that interact (reply to comments, engage in Stories) see higher retention and engagement over time.
- The decline in engagement rates suggests content saturation and increased competition for attention.
Instagram Influencer Statistics
- An estimated 79% of marketers consider Instagram influencers essential for their campaign strategies in 2025.
- According to one study, influencers on Instagram deliver $4.12 return for every $1 spent.
- About 61% of consumers trust influencers more than traditional advertisements.
- Instagram remains the #1 preferred channel for influencer marketing at 57.1% of campaigns.
- Micro‑influencers (smaller follower counts) often yield higher engagement than macro‑influencers.
- Brands are allocating larger budgets to influencer content on Reels and Stories rather than static ads.
- 89% of marketers say influencer marketing ROI meets or exceeds other marketing channels.
- The influencer market size is projected to grow by 35.6% from 2024 to 2025.
Business and Brand Usage on Instagram
- More than 90% of U.S. Instagram users follow at least one business profile.
- Approximately 75% of companies (especially B2C) are active on Instagram in 2025.
- About 61% of users use Instagram to discover new products.
- Reels and Story formats now dominate brand content strategies over static posts.
- Brands posting interactive Story content (polls, quizzes) report higher follower engagement.
- Nearly 30‑40% of brand discovery happens via Instagram itself, rather than external referral.
- Brands that integrate shopping tags into Stories generate significant lift in traffic and conversions.
Instagram Marketing and Advertising Stats
- Instagram’s advertising revenue is forecast to reach up to $71 billion globally in 2025.
- In the U.S., brand purchase intent via Instagram is projected at 37.3% of users in 2025.
- Sponsored post cost averages around $1,300 for typical campaigns in 2025.
- Reels between 60‑90 seconds generate 24% more shares than shorter videos.
- Posts with mentions (tagging other accounts) can yield 2× more reach and 30% more engagement.
- More than 53% of U.S. marketers leverage Reels in influencer marketing campaigns.
- Shoppable posts (inline shopping features) can boost brand traffic by over 2,600% compared to non‑shoppable posts.
Frequently Asked Questions (FAQs)
Instagram has over 2 billion active users globally in 2025.
29% of users reported they made a purchase on Instagram in 2025.
Approximately 90.43% of Instagram’s 1.88 billion ad‑reach audience is outside the U.S.
Around 60% of Instagram users are under the age of 35.
Over 200 billion Reels are played daily across Instagram and Facebook in 2025.
Conclusion
Instagram remains a dynamic platform powering both user expression and brand engagement across the globe. From the dominance of Stories and Reels formats to the shifting landscape of influencer marketing and evolving brand strategies, the numbers highlight one clear trend: short‑form, interactive, and authentic content wins attention. Brands and creators who lean into these formats and measure performance with meaningful metrics are best positioned for growth. Now is the time to align your strategy with the data.