Streaming video has become one of the largest entertainment markets in the US, and Hulu and Amazon Prime Video remain two of its biggest competitors. While Hulu focuses on next-day TV, live channels, and bundled entertainment, Amazon Prime Video combines streaming with a broader retail ecosystem, exclusive originals, and sports rights. Businesses use these platforms to expand advertising reach, while studios rely on them to monetize premium content and global releases. This article explores the latest Hulu vs. Amazon Prime Video statistics, helping readers compare subscribers, growth, market presence, and industry trends through verified data.
Editor’s Choice
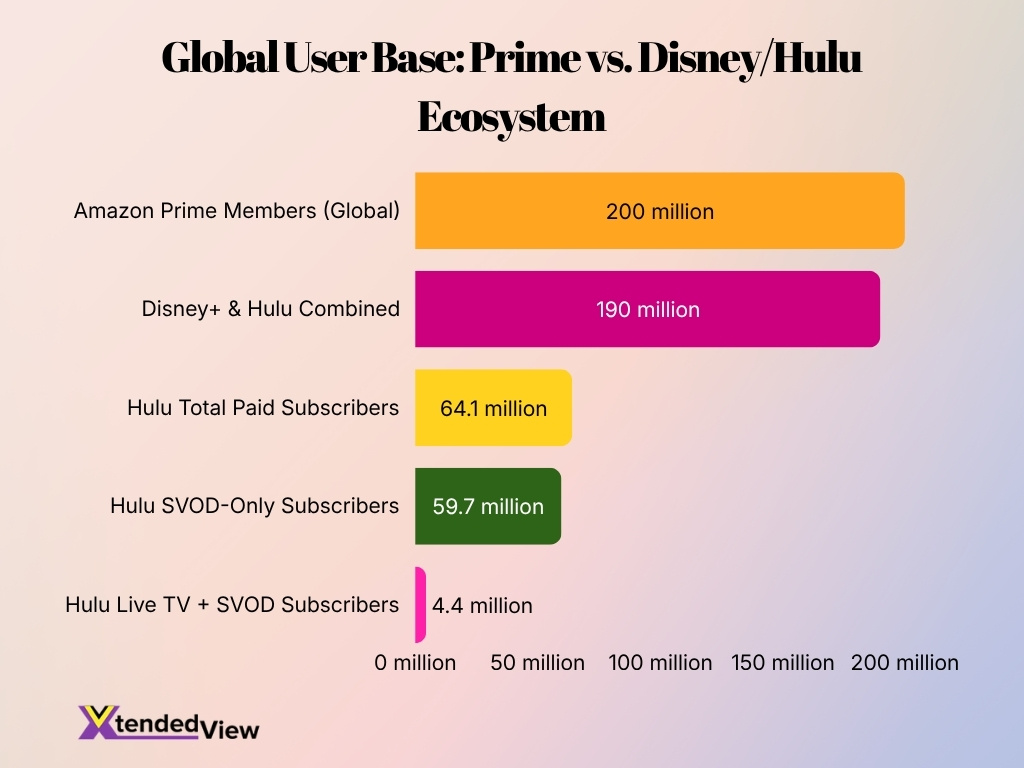
- Hulu reached approximately 64.1 million paid subscribers by the end of fiscal 2025, including 59.7 million SVOD subscribers and 4.4 million Live TV + SVOD subscribers.
- Amazon Prime surpassed 200 million global Prime members, giving Prime Video one of the world’s largest built-in streaming audiences.
- Hulu’s SVOD-only average monthly revenue per paid subscriber remained around $12.36 during fiscal 2025.
- Disney’s direct-to-consumer streaming business turned profitable during 2025, supported by continued growth across Hulu and Disney+.
- Prime Video continues expanding premium sports programming through exclusive NFL coverage and additional regional sports partnerships.
- Hulu remains one of the largest premium streaming platforms in the US, accounting for roughly 15% of premium SVOD subscriptions measured by subscription analytics firms during 2025.
- Both services increasingly rely on ad-supported streaming, reflecting the industry’s broader shift toward hybrid subscription models.
Recent Developments
- Disney continued integrating Hulu into the Disney+ experience, creating a more unified streaming platform while maintaining Hulu as a standalone service.
- Disney reported that its streaming businesses generated hundreds of millions of dollars in quarterly operating profit, highlighting improved monetization.
- Hulu’s paid subscriber base increased from 52.0 million in 2024 to 64.1 million in 2025, representing approximately 23% year-over-year growth.
- Amazon continued investing heavily in Prime Video through exclusive sports, original programming, and AI-powered personalization features.
- Prime Video further expanded its advertising business after making ads the default viewing experience for most subscribers in several markets.
- Disney announced that it will gradually stop reporting individual streaming subscriber counts and instead emphasize profitability and engagement metrics.
- Industry data shows ad-supported subscription tiers generated the majority of new streaming sign-ups during 2025, benefiting platforms such as Hulu.
- Nielsen data indicates streaming continues gaining TV viewing share in the US, supported by sports rights, original programming, and hybrid subscription models.
Overview of Hulu vs Amazon Prime Video
- Hulu launched in 2007 and has evolved into a premium streaming platform offering on-demand content, Live TV, and original programming.
- Amazon Prime Video debuted in 2006 as Amazon Unbox before becoming an included benefit within Amazon Prime.
- Hulu primarily targets the US market, while Prime Video operates across hundreds of countries and territories, making it one of the most globally available streaming services.
- Hulu differentiates itself with next-day access to network television, while Prime Video emphasizes bundled value through Amazon Prime membership.
- Both platforms invest billions annually in licensed programming and original productions to attract and retain subscribers.
- Prime Video has expanded its competitive position through exclusive sports rights, including Thursday Night Football, while Hulu continues growing Hulu + Live TV.
- Disney owns Hulu, whereas Amazon operates Prime Video as part of its broader digital services ecosystem.
- Both platforms support 4K streaming, offline downloads, personalized recommendations, and multi-device compatibility.
Global User Base and Subscriber Statistics
- Hulu reported 64.1 million paid subscribers during fiscal 2025, up from 52.0 million one year earlier.
- Hulu’s subscriber mix included 59.7 million SVOD-only subscribers and 4.4 million Live TV + SVOD subscribers.
- Amazon Prime exceeded 200 million global Prime members, providing Prime Video with one of the industry’s largest potential streaming audiences.
- Prime Video remains available across more than 240 countries and territories, giving Amazon a substantially larger international footprint than Hulu.
- Hulu primarily serves US customers despite growing accessibility through Disney’s broader streaming ecosystem.
- Disney+ and Hulu together served more than 190 million combined subscriptions before Disney changed its subscriber reporting strategy.
- Amazon continues expanding Prime membership internationally, indirectly increasing Prime Video adoption through bundled benefits.
- Subscriber growth across both platforms increasingly comes from bundled offerings and ad-supported subscription plans rather than standalone premium subscriptions.
Year-on-Year Subscriber Growth Trends
- Hulu’s total subscriber count surged from 52.0 million in 2024 to 64.1 million in 2025, achieving a 23% annual growth.
- Hulu SVOD-only subscriptions climbed from 47.4 million to 59.7 million, representing a massive 26% year-over-year increase.
- Hulu Live TV + SVOD subscriptions declined slightly from 4.6 million to 4.4 million amid changing consumer viewing preferences.
- Global online video subscriptions hit a record 2.24 billion in 2025, demonstrating a massive 17.6% year-over-year expansion.
- Ad-supported streaming tiers accounted for over 60% of all new subscriber additions across major platforms in 2025.
- Netflix maintained its industry dominance by reaching a peak of 325 million paid subscribers globally in early 2026.
- Subscription video on demand services captured exactly 69.2% of the total global streaming market revenue in 2025.
- The global OTT streaming user base grew rapidly to reach an estimated 4.33 billion total subscribers in 2026.
- Amazon Prime Video sustained strong engagement levels by maintaining approximately 250 million global subscribers through 2026.
Revenue and Monetization Statistics
- Disney’s direct-to-consumer streaming business generated $24.61 billion in revenue during fiscal 2025, an 8% year-over-year increase from $22.78 billion in 2024.
- The streaming segment’s operating income reached $1.33 billion in fiscal 2025, compared with $143 million in 2024, marking a major improvement in profitability.
- Subscription revenue across Disney’s streaming services increased 11% year over year to $20.77 billion, supported by higher pricing and subscriber growth.
- Hulu’s SVOD average monthly revenue per subscriber (ARPU) remained steady at $12.36 during fiscal 2025, demonstrating stable monetization despite changing subscriber mixes.
- Hulu + Live TV generated a much higher ARPU of $99.85 per month during fiscal 2025 because subscriptions include live television services.
- Disney reported that advertising revenue across its streaming business remained largely stable during fiscal 2025, with higher ad impressions offsetting lower advertising rates.
- During the quarter ending December 2025, Disney’s streaming division reported approximately $450 million in operating income, up 72% year over year.
- Amazon continues monetizing Prime Video through multiple revenue streams, including Prime memberships, advertising, transactional rentals, premium channel subscriptions, and sports rights, reducing dependence on subscription fees alone.
Video Streaming Services US Market Share Insights
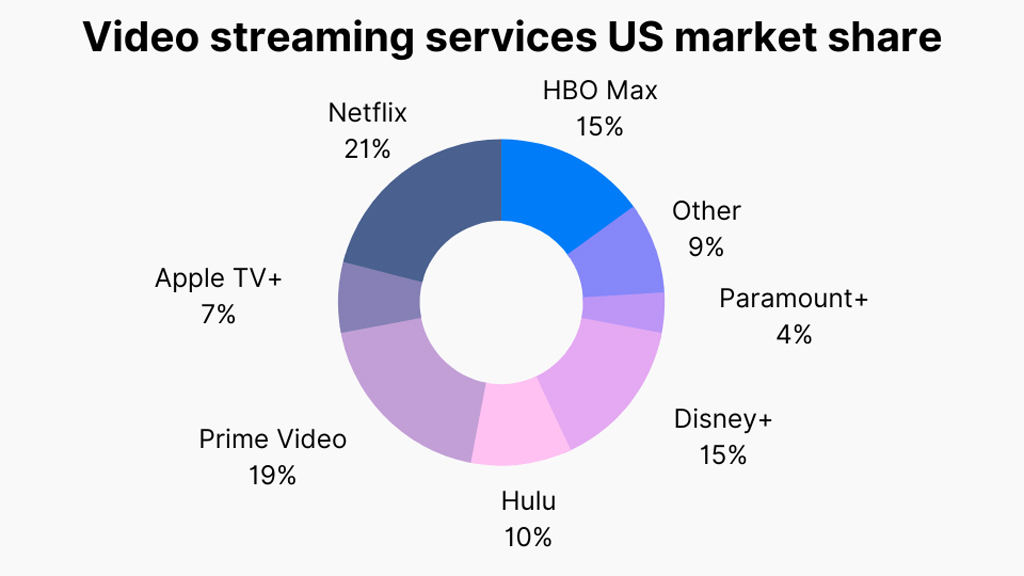
- Netflix leads the US video streaming market with a 21% share, showing its strong position as the most widely used platform.
- Prime Video follows closely with 19%, making it the second-largest streaming service in the US market.
- Netflix and Prime Video together account for 40% of the market, highlighting their dominance over other platforms.
- HBO Max holds a solid 15% share, placing it among the top streaming services in the US.
- Disney+ also captures 15% of the market, tying with HBO Max and showing strong competition in family and entertainment content.
- Hulu owns 10% of the US streaming market, giving it a mid-level position among major video platforms.
- Other streaming services collectively make up 9%, showing that smaller platforms still attract a meaningful user base.
- Apple TV+ accounts for 7% of the market, reflecting a smaller but growing presence in the streaming space.
- Paramount+ has the lowest listed share at 4%, suggesting it trails behind larger competitors in the US market.
- The data shows that the US streaming market is highly competitive, but Netflix, Prime Video, HBO Max, and Disney+ remain the strongest players.
Content Library and Catalog Growth Statistics
- Amazon aggressively expanded its original programming by spending $22.4 billion on video and music content in 2025.
- The integrated Disney+ and Hulu library currently features 9,578 distinct movie and TV seasons for bundle subscribers.
- Hulu’s expanding streaming catalog successfully attracted 45.8 million active subscribers by the close of 2024.
- The combined Disney+ and Hulu application strategically stocks 33 of the 100 most popular titles in the United States.
- Amazon Prime Video’s massive international catalog commands an ad-supported reach of over 200 million global viewers.
- Hulu’s diverse streaming and Live TV offerings helped generate a massive $12 billion in total revenue during 2024.
- The Prime Video platform maintains 115 million active viewers within the United States who regularly consume its content.
- Amazon’s content spending budget of $22.4 billion sits roughly 25% higher than competing platforms’ investment in original titles.
Streaming Subscription Price Increase Trends in the U.S.
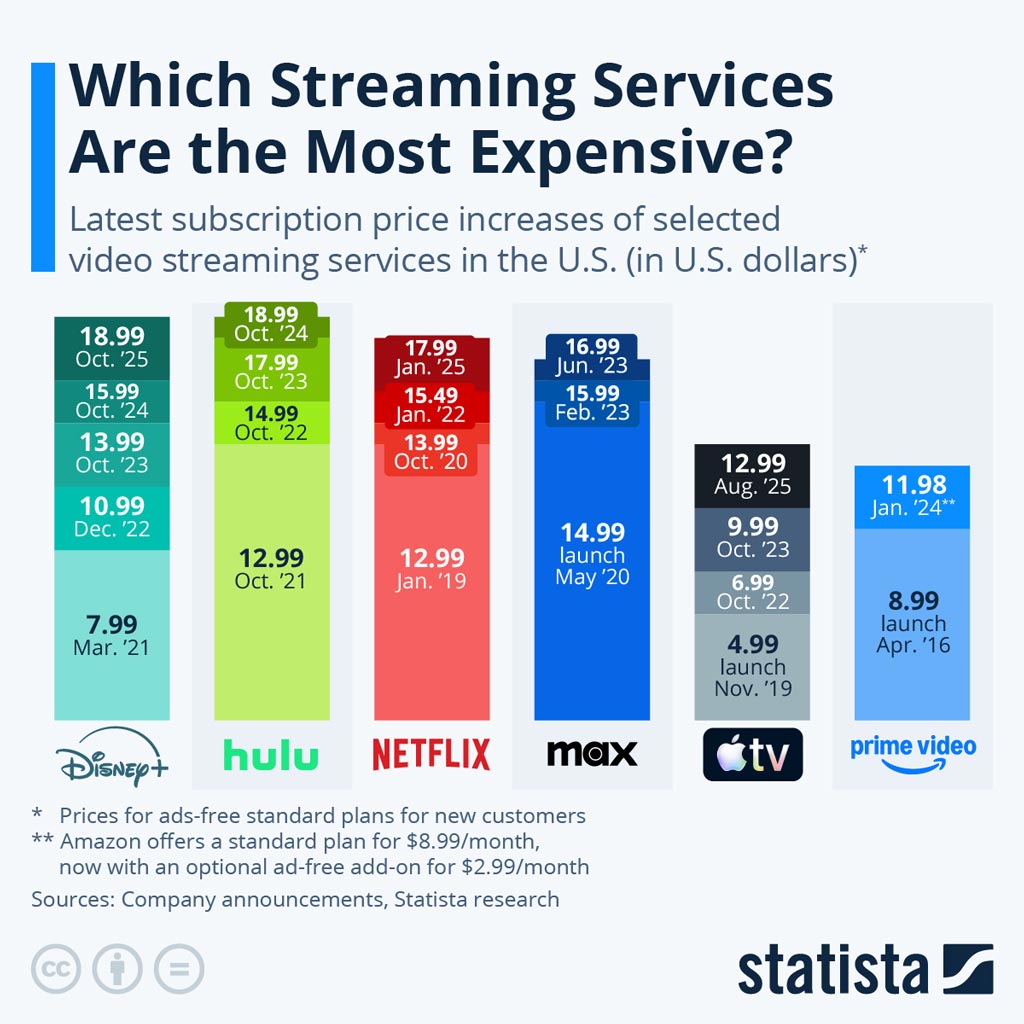
- Disney+ and Hulu are the most expensive services listed, both reaching $18.99 per month.
- Disney+ saw a sharp rise from $7.99 in Mar. 2021 to $18.99 in Oct. 2025.
- Hulu increased from $12.99 in Oct. 2021 to $18.99 in Oct. 2024, making it one of the priciest platforms.
- Netflix rose steadily from $12.99 in Jan. 2019 to $17.99 in Jan. 2025.
- Max had a smaller price increase, moving from $14.99 at launch to $16.99 in Jun. 2023.
- Apple TV+ recorded strong growth, rising from $4.99 at launch to $12.99 in Aug. 2025.
- Prime Video remains one of the cheaper options at $11.98 per month with the ad-free add-on.
- The data shows that most major streaming services have shifted toward higher ad-free subscription prices.
- Price hikes are most visible among platforms with large content libraries, especially Disney+, Hulu, and Netflix.
- Streaming users now pay much more for premium, ad-free access than they did during the early launch years.
Regional Availability and Localization Statistics
- Disney+ reached 131.6 million subscribers by late 2025 across more than 150 countries.
- Amazon Prime Video is currently accessible for streaming in over 240 countries and territories.
- Hulu maintains its domestic focus with 64.1 million paid memberships inside the United States.
- Content localization budgets account for 7% to 12% of total production spending for major streaming platforms.
- Providing content with native-language dubbing increases average watch time by 30% to 50%.
- The global dubbing market reached an estimated $3.8 billion in 2025 due to international streaming expansion.
- Drama series featuring local dubbed audio achieve higher completion rates of 70% to 85%.
- Disney’s combined direct-to-consumer streaming segment generated $24.6 billion in revenue during fiscal year 2025.
- Full Amazon Prime memberships are limited to 27 countries despite the video platform’s wider global reach.
Live TV and Sports Streaming Statistics
- Hulu + Live TV serves approximately 4.4 million subscribers as of fiscal 2025.
- Amazon Prime Video’s Thursday Night Football averaged 15.3 million viewers during the 2025 season.
- Prime Video’s exclusive NFL Wild Card playoff game reached a record-breaking 31.6 million viewers.
- Hulu + Live TV offers access to over 95 live television channels, including national sports networks.
- The global sports online live video streaming market is projected to reach $38.76 billion in 2026.
- Digital live sports audiences are projected to grow by 5.8% this year compared to just 0.4% for overall live sports.
- Streaming platforms saw a massive 52% year-over-year surge in sports programming during the first quarter of 2026.
- The top five streaming companies globally now hold 48% of total sports streaming subscribers.
- Streaming ad placements during the NFL season delivered 66% stronger performance than cable and broadcast averages.
- Thursday Night Football viewers on streaming platforms skewed nearly seven years younger than linear network audiences.
Original Content Performance Statistics
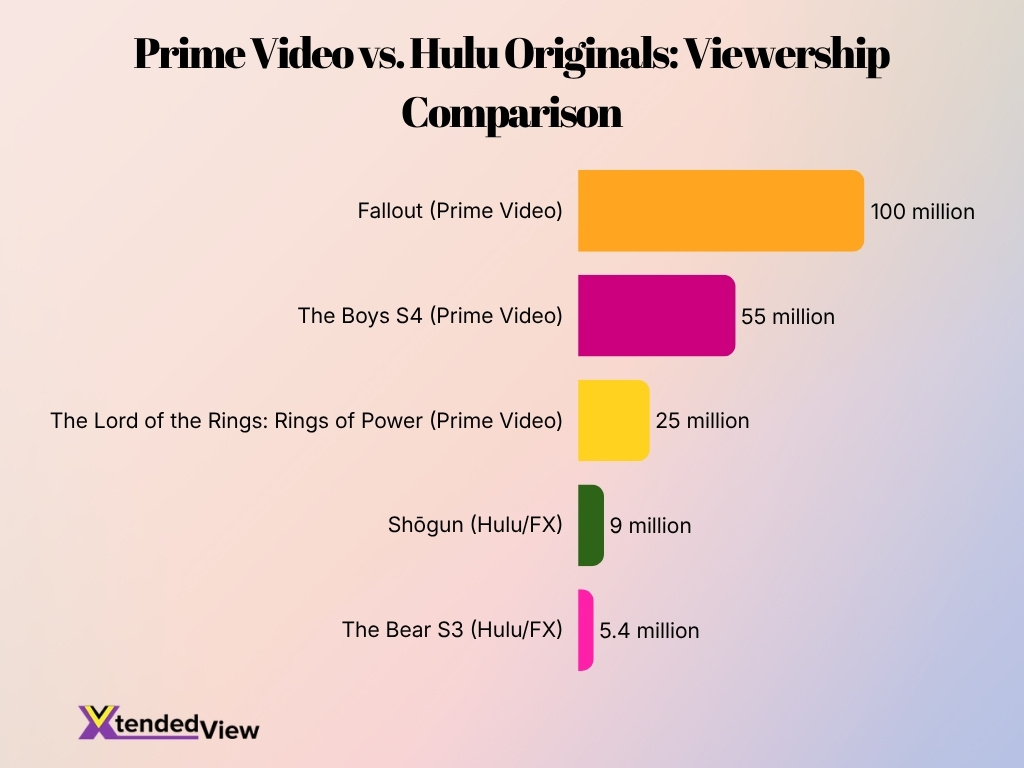
- “The Lord of the Rings: The Rings of Power” attracted over 25 million viewers globally on its first day.
- Season 4 of “The Boys” drew more than 55 million viewers, representing a 20% increase in audience size.
- The hit series “Fallout” successfully crossed the 100 million global viewers milestone for Prime Video.
- Season 3 of “The Bear” drove a record-breaking 5.4 million views in its first four days.
- The historical epic “Shōgun” garnered a massive 9 million global views in just six days.
- Shifting focus to premium scripted programming improves long-term subscriber retention by an estimated 15%.
- Award-winning streaming originals have been shown to reduce monthly subscriber churn by up to 20%.
- Combining original series with live sports programming increases weekly viewer engagement by nearly 30%.
- Ecosystem cross-promotion increases total audience reach for premium Hulu originals by an average of 35%.
- Original content production currently accounts for over 50% of total content expenses for major streaming platforms.
Usage Frequency and Viewing Time Statistics
- Streaming accounted for 46.6% of ad-supported TV viewing during the first quarter of 2026, the highest level recorded by Nielsen.
- Ad-supported television represented nearly 73% of total TV viewing during the same period, highlighting advertisers’ growing focus on streaming audiences.
- Nielsen data shows streaming continues gaining viewing share while traditional broadcast and cable television gradually decline.
- During March 2026, Prime Video accounted for approximately 3.8% of total television viewing measured by Nielsen’s streaming tracker.
- Disney’s combined streaming platforms, including Hulu, Disney+, and ESPN+, represented approximately 5.3% of total TV viewing during March 2026.
- Live sports continue producing the highest spikes in viewing time across both Hulu and Prime Video.
- Personalized recommendations, autoplay features, and integrated user profiles contribute to longer viewing sessions across both services.
- Industry analysts increasingly use engagement hours per subscriber alongside subscriber counts to evaluate streaming platform performance.
Device and Platform Usage Statistics
- Smart TVs currently account for an overwhelming 70% of all connected TV media usage.
- The average US household actively operates 3.5 connected streaming devices for content consumption.
- More than 82% of modern television households access their entertainment primarily through connected TVs.
- Services like Amazon Prime Video support over 200 million global subscribers across compatible devices.
- Approximately 58% of all daily television viewing time is now spent directly on streaming platforms.
- 4K Ultra High Definition models command the largest segment with a 56% global market share in smart televisions.
- Around 40% of streaming viewers frequently utilize voice search navigation to find personalized recommendations.
- Hulu and its integrated partner platforms currently support a paid user base of over 55 million subscribers.
Primevideo.com vs Hulu.com Audience Demographics
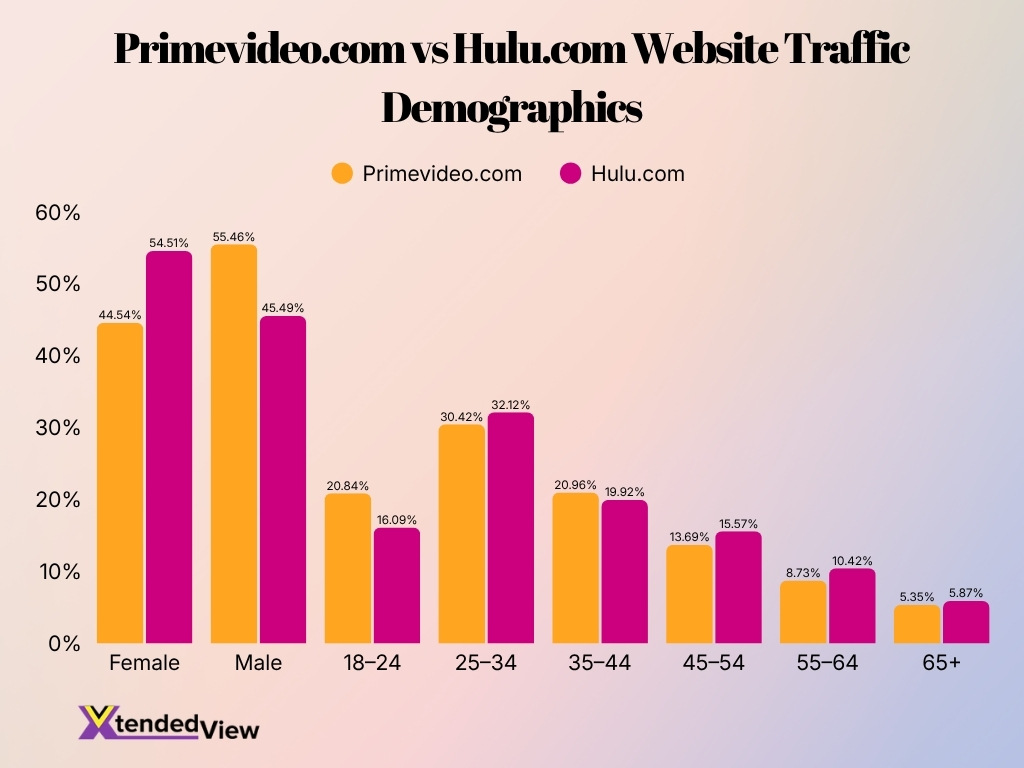
- Primevideo.com has a more male-skewed audience, with 55.46% male visitors compared to 44.54% female visitors.
- Hulu.com attracts a stronger female audience, with 54.51% female visitors and 45.49% male visitors.
- The 25–34 age group is the largest audience segment for both platforms, reaching 30.42% on Primevideo.com and 32.12% on Hulu.com.
- Hulu.com has a slightly higher share of young adult users aged 25–34, leading Primevideo.com by 1.70 percentage points.
- Primevideo.com has a stronger share among 18–24-year-olds, with 20.84% of visitors compared to 16.09% for Hulu.com.
- The 35–44 age group is nearly balanced across both platforms, with 20.96% on Primevideo.com and 19.92% on Hulu.com.
- Hulu.com performs better among older users aged 45–54, with 15.57% compared to 13.69% for Primevideo.com.
- Hulu.com also leads in the 55–64 segment, attracting 10.42% of visitors versus 8.73% for Primevideo.com.
- The 65+ audience remains the smallest group for both sites, with 5.35% on Primevideo.com and 5.87% on Hulu.com.
- Overall, Primevideo.com has a stronger male and younger visitor base, while Hulu.com has a stronger female audience and slightly higher older-age representation.
Customer Satisfaction and Subscriber Retention Statistics
- Disney’s direct-to-consumer streaming segment generated $1.33 billion in operating profit during fiscal 2025.
- The global Disney+ platform successfully surpassed 135 million active subscribers by the end of 2025.
- Data shows that 68% of Disney+ bundle subscribers retain their active subscriptions after six months.
- Advanced personalized recommendation algorithms now drive over 80% of total content plays on major platforms.
- Disney+ successfully increased its average monthly revenue to $7.81 per core subscriber by late 2025.
- Regular platform engagement and usage drive 50% of subscriber retention decisions among American viewers.
- Disney+ expanded its market footprint to capture 14% of all SVOD subscriptions in the United States.
- The global streaming market valuation surged to $195.85 billion as providers prioritized profitability over growth.
Bundle Adoption and Cross-Service Usage Statistics
- Disney reported 43.7 million subscribers using Disney+ and Hulu bundles in fiscal 2025, up from 27.1 million the previous year.
- The ad-supported Disney, Hulu, and Max bundle offers overall cost savings of up to 43% compared to standalone subscriptions.
- Around 49% of consumers state that lower monthly entertainment costs make them highly likely to adopt a streaming bundle.
- The inter-company Disney and Max bundle successfully drove 22% of new Max sign-ups during the third quarter of 2024.
- Cross-service bundles vastly outperform standalone apps, achieving a massive 80% user retention rate after three months.
- Nearly 42% of streaming viewers emphasize they are more likely to maintain bundled packages rather than individual platform services.
- Younger audiences are driving adoption, with exactly 60% of Gen Z and millennials expressing strong interest in TV streaming bundles.
- Bundled subscription models effectively combat subscription fatigue, helping lower the industry’s average 2.8% monthly net churn rate.
- Amazon Prime leverages its wider ecosystem, helping its ad-supported streaming tier capture over 115 million global viewers.
- With Americans managing an average of 2.9 streaming subscriptions, integrated billing and bundled content remain top priorities for retention.
Ad-Supported vs. Total OTT Viewers
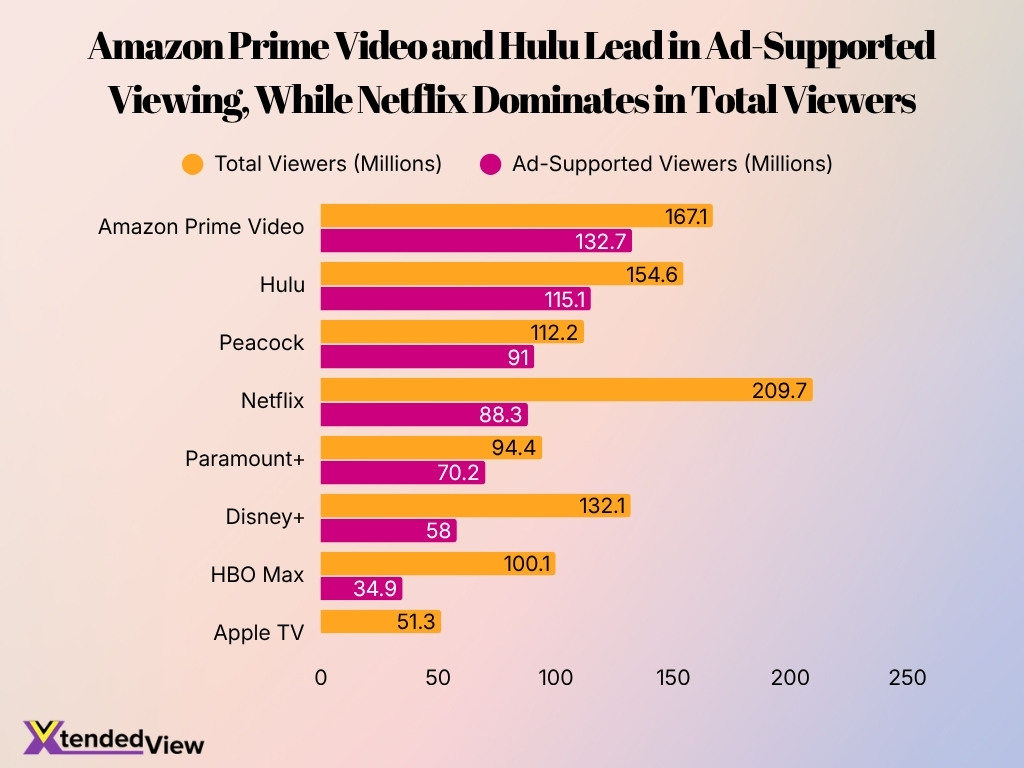
- Amazon Prime Video leads ad-supported viewing with 132.7 million US viewers, ahead of all other platforms.
- Hulu ranks second in ad-supported viewers with 115.1 million, showing strong demand for its ad-based plan.
- Netflix dominates total subscription OTT viewing with 209.7 million viewers, the highest among all platforms.
- Netflix has only 88.3 million ad-supported viewers, meaning a large share of its audience still uses non-ad-supported plans.
- Amazon Prime Video also has a strong total viewer base of 167.1 million, placing it second after Netflix.
- Hulu reaches 154.6 million total viewers, making it one of the strongest competitors in both total and ad-supported viewing.
- Peacock has 91.0 million ad-supported viewers out of 112.2 million total viewers, showing heavy reliance on ad-supported viewing.
- Disney+ records 132.1 million total viewers but only 58.0 million ad-supported viewers, indicating lower ad-plan adoption.
- HBO Max has 100.1 million total viewers, but only 34.9 million ad-supported viewers, the lowest ad-supported count among listed platforms with data.
- Apple TV has 51.3 million total viewers, but ad-supported viewer data is marked as N/A.
Advertising Reach and Ad Performance Statistics
- Disney’s ad-supported streaming platforms reach 157 million global monthly active users, including 112 million in the US and Canada.
- Disney reported a 15% increase in advertising impressions during fiscal 2025, which successfully offset weaker advertising rates.
- Approximately 63% of Hulu subscribers engage with ad-supported plans, cementing it as a top premium US streaming platform.
- Amazon Prime Video’s ad-supported tier successfully reached over 315 million monthly viewers globally by August 2025.
- Nearly 84% of advertisers believe that connected TV delivers far better targeting capabilities than traditional linear television.
- More than 50% of new Disney+ subscribers in the US are now actively choosing the more affordable ad-supported tier.
- Roughly 60% of connected TV viewers are fully willing to watch streaming advertisements to secure a lower subscription cost.
- US connected TV advertising spending is officially projected to hit $38 billion in 2026, marking a 14% year-over-year growth.
Frequently Asked Questions (FAQs)
Hulu reported 64.1 million paid subscribers at the end of fiscal 2025, including 59.7 million SVOD subscribers and 4.4 million Live TV + SVOD subscribers.
Amazon has more than 200 million global Prime members, providing Prime Video with one of the world’s largest built-in streaming audiences.
Hulu’s average monthly revenue per paid SVOD subscriber was $12.36 in fiscal 2025, while Hulu + Live TV generated $99.85 per subscriber per month.
Hulu accounted for approximately 15% of US premium SVOD subscriptions in Q4 2025, ranking among the leading subscription streaming services.
Hulu’s paid subscriber base increased from 52.0 million in 2024 to 64.1 million in 2025, representing 23% year-over-year growth.
Conclusion
Hulu and Amazon Prime Video continue competing from different strategic positions. Hulu remains strongest in US television, live TV, and advertising-supported streaming, while Amazon Prime Video leverages its global Prime ecosystem, international reach, and exclusive sports rights to drive engagement. Recent data also show a broader industry shift from subscriber growth alone toward profitability, advertising revenue, bundled offerings, and long-term customer retention.
As streaming competition intensifies, both platforms are expected to expand their investments in premium content, AI-driven personalization, sports programming, and hybrid subscription models, shaping the next phase of digital entertainment.