
Google remains at the heart of how billions of people access information every day. From guiding online shopping decisions to powering enterprise advertising, the platform’s reach shapes both consumer behaviour and business strategy. In the retail sector, for example, brands optimize for Google search to drive conversions, while in publishing companies, Google Search often provides the largest slice of web traffic.
Editor’s Choice
Here are seven top statistics selected for their relevance in 2025:
- Google holds approximately 89.7 % of the global search engine market share.
- The platform handles an estimated over 5 trillion searches annually.
- In the U.S., Google’s share of desktop search traffic is about 87 % as of recent data.
- About 15 % of Google search queries each day are unique , never seen before on the platform.
- Mobile devices account for over 60 % of Google search usage in the U.S.
- Millennials and Gen Z users make up roughly 63 % of global Google users in 2025.
- Urban users search on Google about 21 % more frequently than rural users.
Recent Developments
Reflecting shifts in the search and technology landscape, Google is adapting to new patterns and pressures:
- Google’s global search engine market share has dipped below 90 % for most of 2025, signalling rising competition.
- AI‑driven features such as “AI Overview” now trigger on around 13.14 % of Google searches (March 2025).
- Google now projects to handle up to 13.6 billion searches per day in 2025, according to some estimates.
- Default search engine contracts (for example, with Apple) and antitrust pressures are generating renewed regulatory scrutiny.
- Mobile‑first indexing and speed/performance optimization continue to be major strategic priorities for Google.
- Search‑engine competitors powered by AI (like ChatGPT) are gaining traction, particularly among younger users.
- The shift to “search as a conversation , including voice and AI interactions , is being prioritized in Google’s roadmap.
Google Overview and Key Facts
Here are core facts about Google in 2025, giving context to its scale and operations:
- The company behind Google Search is Alphabet Inc., with global operations across search, advertising, cloud, AI, and hardware.
- Google Search supports more than 100 languages and serves users around the globe; the brand is often ranked among the world’s most valuable.
- As of 2025, Google processes 8.5 billion to 13.6 billion searches per day, depending on the source.
- Affiliates within the Alphabet ecosystem (YouTube, Maps, Chrome, Android) expand Google’s reach far beyond “just search.”
- Google’s search business remains the dominant driver of its advertising revenue and is central to its broader business model.
- Google’s headquarters are located in Mountain View, California (“the Googleplex”).
- The company invests heavily in infrastructure , data centres, undersea cables, and AI computing power, all of which underpin its global network.
Google Market Share Statistics
Delving into market share gives us a sense of how Google compares to competitors in 2025:
- Google holds roughly 89.54 % of the global search engine market (July 2024–July 2025).
- This share has hovered in the 89–90 % range since early 2025, a modest decline from earlier years above 90%.
- In the U.S., Google’s market share was around 86.12 % (July 2024–July 2025) for all search usage.
- A report estimates Google’s share of “total digital queries” at 81.6 % globally in Q2 2025.
- Some regions show even higher dominance ; for instance, India’s share of desktop search is over 90 %.
- Competitors hold much smaller shares: Bing around 4 % globally, Yandex 2.5 %, DuckDuckGo under 1%.
- The fact that share is slipping slightly even as Google remains dominant suggests evolving user behaviour and increased choice.
Google Search Volume Statistics
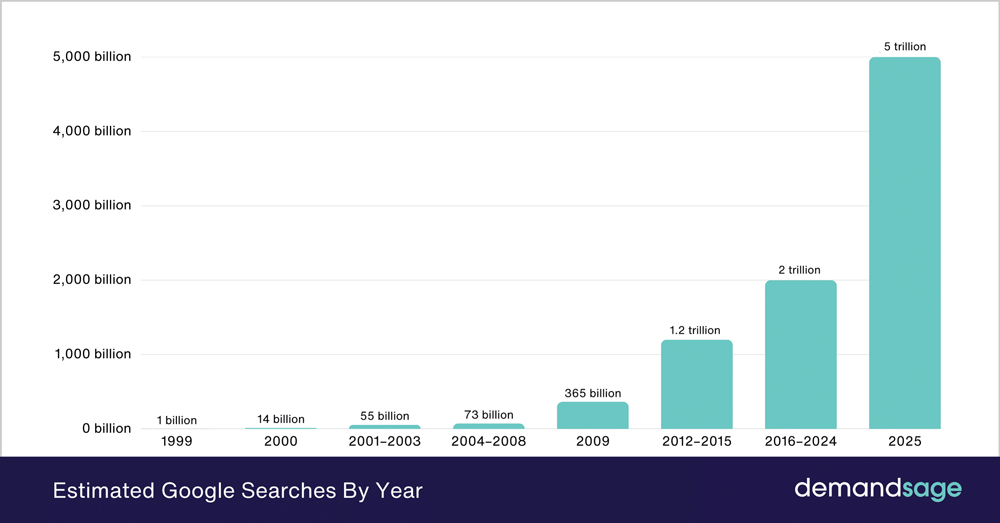
- Google handled around 1 billion searches in 1999, marking the start of its rise as the world’s go-to search engine.
- Search volume jumped to 14 billion in 2000, showing strong early-internet adoption.
- Between 2001 and 2003, searches climbed further to 55 billion, reflecting expanding global internet access.
- From 2004–2008, search volume nearly doubled again to 73 billion, as smartphones and broadband internet started transforming user behaviour.
- By 2009, annual searches skyrocketed to 365 billion, driven by mobile search growth and worldwide internet penetration.
- In the 2012–2015 period, Google crossed the 1.2 trillion search mark, a milestone that cemented its dominance in global information discovery.
- Between 2016 and 2024, search volume surged again to reach 2 trillion searches, highlighting the role of search in modern digital life.
- By 2025, Google is expected to reach 5 trillion annual searches, showcasing exponential demand for online information and real-time answers.
Google User Demographics
Understanding who uses Google helps tailor strategies and contexts:
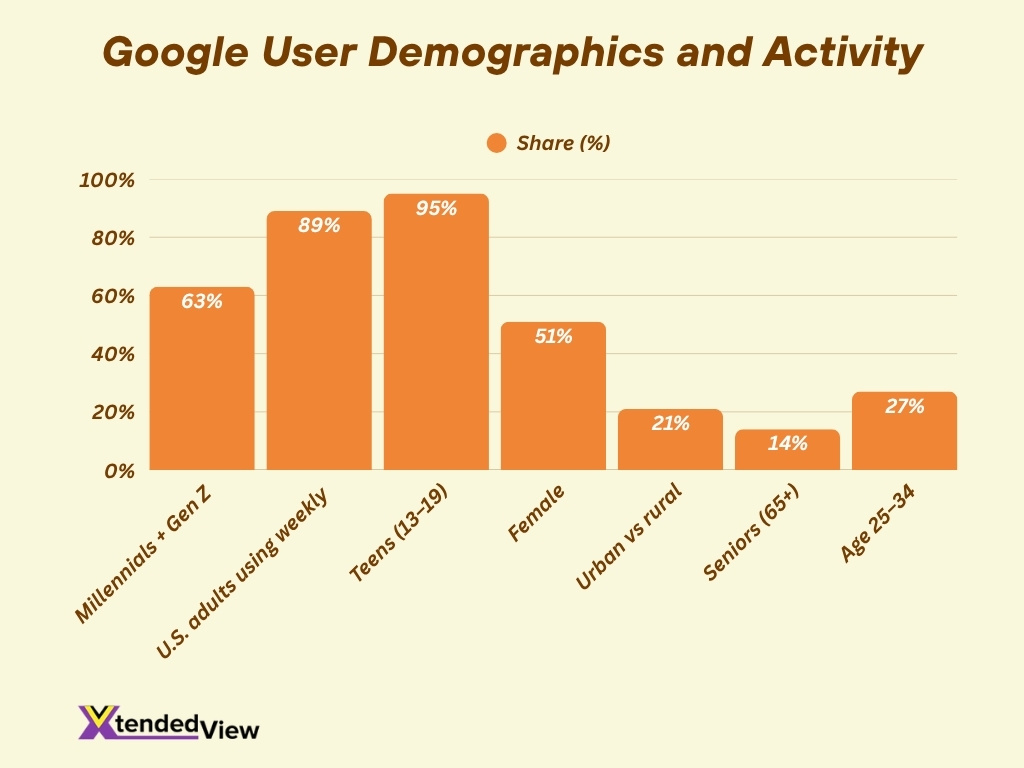
- Millennials and Gen Z users together account for about 63 % of all Google users globally in 2025.
- In the United States, about 89 % of adults use Google at least once per week.
- Among teenagers (age 13–19), approximately 95 % use Google as their main information source for homework and trending topics.
- Females generate about 51 % of daily Google search traffic globally.
- Urban users perform roughly 21 % more searches per day than rural users, mostly on mobile devices.
- Seniors (age 65 +) now represent 14 % of all U.S. Google users, up from around 11 % in 2023.
- The age group 25‑34 contributes around 27 % of total searches, making it the most active cohort.
- Professional users (in tech, marketing, academia) average 22–28 searches per day, compared with 3–5 per day for the general population.
Google Mobile Usage Statistics
- As of 2025, there are an estimated 4.69 billion smartphone users worldwide, up by roughly 440 million from the previous year.
- The average smartphone user spends about 4 hours and 37 minutes per day using their phone.
- Global mobile app usage rose to 4.9 hours per day in 2025, up from 4.1 hours in 2023.
- More than 3.45 billion people use the Google Chrome browser, many via mobile devices.
- Android devices include over 3.5 billion active users globally in 2025.
- In regions such as Africa, mobile usage of Google Chrome accounts for 84 % of traffic.
- Mobile-targeted search and ads are increasingly crucial: mobile searches on search engines now exceed desktop searches in many markets.
- Unique mobile behaviours include more “near me” and voice‑activated queries, with voice search contributing significantly to mobile search volume.
Google Advertising Revenue Statistics
- In Q1 2025, Alphabet Inc. reported consolidated revenue of $90.2 billion, up ≈12 % year‑over‑year.
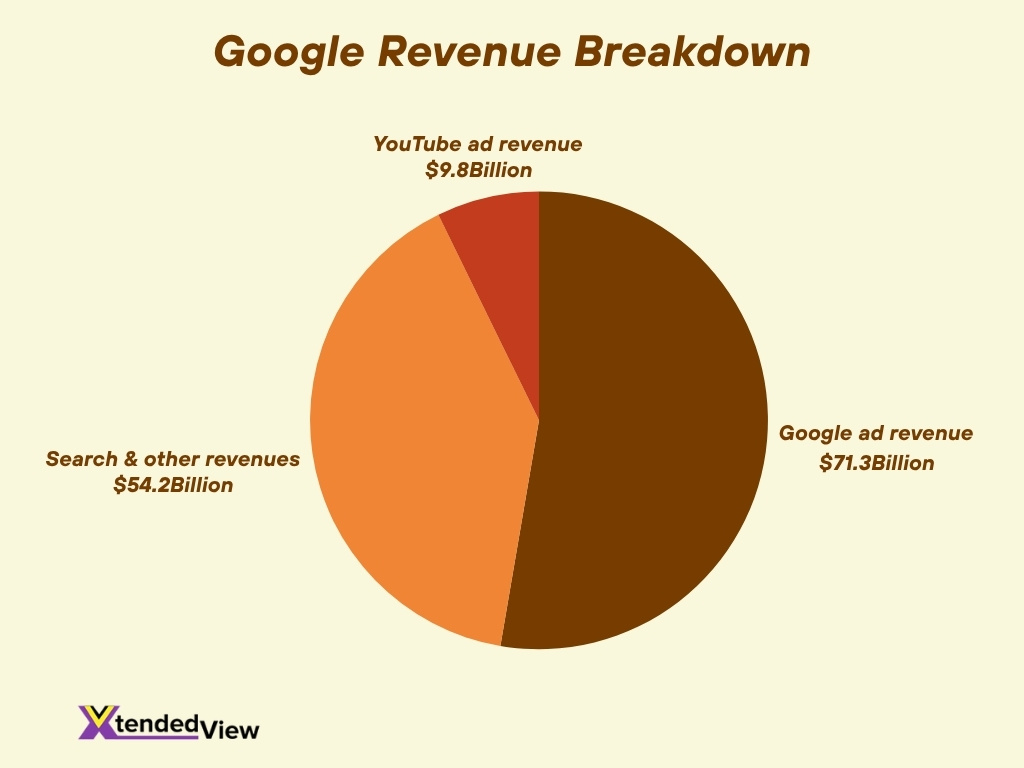
- In Q2 2025, ad revenue for Google’s core business was about $71.3 billion, up 10.4 % YoY.
- Search and other revenues rose nearly 12 % to $54.2 billion, and YouTube ad revenue grew 13 % to $9.8 billion.
- Forecasts show Google ad revenue is projected at roughly $296.15 billion in 2025.
- Among search ads, the average click‑through rate and conversion benchmarks are trending: 6.66 % CTR and 7.52 % conversion rate in 2025.
- Google Shopping Ads have an average conversion rate of 1.91 % and average CPC around $0.66.
- The platform holds 80.20 % share of the PPC market globally.
- In the U.K., more than half of advertising spend went to Google and Meta.
Google Product Usage Statistics
- The Google Play Store houses around 2.87 million apps in 2025.
- Chrome browser use: more than 3.45 billion users globally.
- One Android SDK version (SDK 35/15) reached 26% share by the end of June 2025.
- Over 50% of mobile searches globally originate from Android OS devices.
- Gmail is used by 27.76% of all email users globally, processing more than 130 billion emails in 2025.
- Smart TVs and IoT devices show 40% YoY growth in Google product search volume.
- Google One reached 150 million users by May 2025.
- App vs browser behaviour shows increased app engagement across platforms.
Google Trends and Search Behaviour
- Google Trends shows relative term popularity, not absolute volume.
- 58% of Google searches occur only once, highlighting specific user intent.
- Around 16.4 billion searches are processed daily, totalling 5.9 trillion annually.
- 77% of users perform more than three Google searches per day.
- 45% of desktop users decide their next action within five seconds of a search, while mobile users do so in 33%.
- In Latin America, search activity increased by 6.3% YoY.
- As of mid‑2025, the most searched term was “YouTube”, followed by “Amazon”, “Facebook”, etc.
- Over 50% of Google searches now end without clicking through to another site.
Google Algorithm Update Statistics
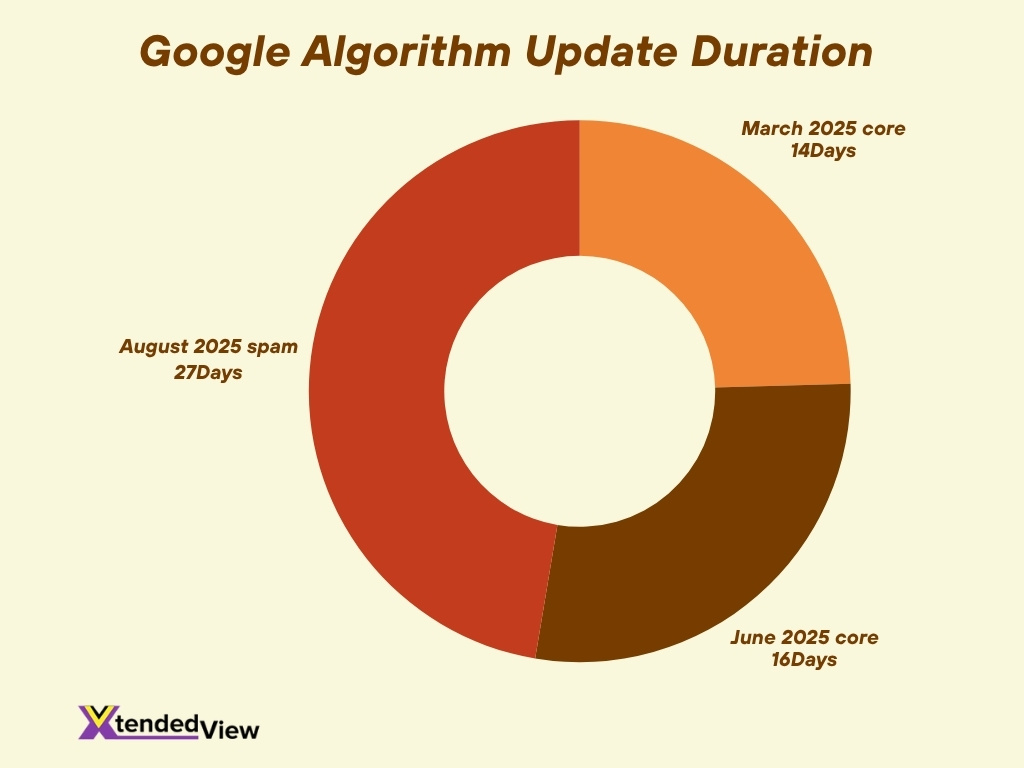
- March 2025 core update rolled out over 14 days, June 2025 update over 16 days, and August 2025 spam update over 27 days.
- March update resembled volatility levels from December 2024.
- June update emphasized “people‑first” results globally.
- Internal links and some schema markup dropped to 1% in importance for rankings.
- Google’s search index holds over 100 million gigabytes of data.
- Spam, AI‑generated content, and mobile UX are key targets of recent updates.
- AI Overviews have introduced new ranking signals.
- Post-update volatility affects many sites for weeks.
Google Click‑Through Rate (CTR) Statistics
- The average conversion rate for PPC search ads is 4.4 % in 2025.
- CTR benchmarks show 6.66 % average CTR and 7.52 % conversion rate.
- Google Shopping Ads show 1.91 % conversion and $0.66 CPC.
- Zero-click results with featured snippets reduce downstream CTR from 7.3 % to 2.6%.
- Desktop CTR for the top organic result remains 65 %.
- Mobile users engage faster but click fewer links.
- Long‑tail keywords generate 1.76× more organic clicks.
Google Featured Snippets Statistics
- As of 2025, nearly 19.2% of all search engine results pages (SERPs) include a featured snippet.
- Paragraph‑type featured snippets make up around 70% of all featured snippet formats.
- One study found that in March 2025, only 839,000 queries yielded featured snippets versus 1.3 million in Sept 2024, a drop of about 35%.
- A further example: a site had 132,000 queries yielding snippets in March 2025, down from 307,000 in Sept 2024, a 57% decline.
- For voice searches, roughly 40.7% of responses come from featured snippets.
- In many cases, featured snippets are sourced from content already ranking in the top result position (50% of the time).
- Video‑type snippets now appear in 10% of searches, up from 5% two years prior.
- Featured snippets significantly boost visibility, even if they reduce click‑throughs in zero‑click scenarios.
- Optimizing content for featured snippets (clear answer, paragraph/list/table format) remains an important strategy in 2025.
Google Voice Search Statistics
- About 20.5% of internet users globally use voice search in 2025.
- There are 8.4 billion voice assistants in use.
- In the U.S., 153.5 million people use voice assistants.
- 27% of users employ voice on mobile.
- 80%+ of voice answers come from the top three search results.
- Voice queries average 29 words in length.
- 58% use voice for local business info.
- 40.7% of voice responses are from featured snippets.
- Voice search leads convert at 10–15× the value of web leads.
Google Maps Usage Statistics
- Google Maps has over 2.2 billion monthly active users.
- 70%+ of Android users use Maps.
- In the U.S., 85% of smartphone owners have Maps installed.
- Maps is available in 220+ countries and 95 languages.
- Holds 67% of the navigation app market.
- 5 million apps and sites use Google Maps weekly.
- Users make 25 million updates per day.
- 42% of local searchers use Maps for directions.
Google Local Search Statistics
- 46% of Google queries have local intent.
- 42% click on the Map Pack results.
- Listings with photos see 42% more direction requests.
- 90% of local searchers visit a business within a week.
- “Open now / near me” searches have grown 400%.
- 23% of travel planners use Maps.
- 35+ million businesses have profiles in Maps.
Google Shopping and E‑commerce Statistics
- 2.77 billion people will shop online in 2025.
- Global ecommerce sales exceed $6.8 trillion.
- Mobile commerce makes up 59% of ecommerce sales.
- 63% of shoppers start their journey on Google Search.
- 31.5% begin via Google Shopping.
- Google Shopping gets 85% of retail PPC clicks.
- 36% of initial product searches happen on Shopping.
- 65% of ecommerce ad clicks come from mobile.
Google Data Privacy and Security Statistics
- Data breach costs average $4.44 million globally.
- 120+ countries have active privacy laws.
- 94.1% of businesses believe in balanced data practices.
- 68% of users are overwhelmed by data collection.
- Privacy/security spending hits $212 billion.
- GDPR fines near €5.9 billion.
- Only 3% of U.S. adults fully understand privacy laws.
Google AI and Machine Learning Statistics
- The machine learning market reached $113.10 billion.
- 98% of companies explore generative AI.
- 90% of tech workers use AI tools.
- 20 billion visual queries happen monthly.
- The NLP market is projected to grow from $42.47 to $791B by 2034.
- AI Overview appears in 13% of desktop searches.
- TPUs deliver 4.7× more performance in 2025.
Frequently Asked Questions (FAQs)
89.57 % of the global search engine market share.
Approximately 13.6 billion searches per day
About $71.3 billion, representing 10.4 % year‑over‑year growth.
Roughly 80.20 % of the global PPC market.
Forecasted at approximately $296.15 billion for the year.
Conclusion
Google continues to dominate multiple facets of digital behaviour, from voice searches, local queries, mobile‑first shopping journeys, to AI‑enhanced experiences. The statistics highlight its overwhelming reach across search, navigation, e‑commerce, and machine intelligence, while also revealing the growing importance of data privacy and security in this expansive ecosystem.
Together, these metrics signal how businesses and consumers alike must adapt to a landscape where Google’s tools shape discovery, engagement, and conversion. For a deeper dive into each area and how it applies to your strategy, explore the full article.