
Facebook remains a dominant force in the social media landscape, shaping how people connect, how businesses reach audiences, and how trends spread online. In one scenario, a U.S. small business used Facebook’s advertising tools to double its reach within six months, while globally, a nonprofit leveraged the platform to mobilize volunteers across five continents in under a week. The following article explores key data across user numbers, demographics, and country-by-country breakdowns to help you understand Facebook’s current scale and relevance.
Editor’s Choice
Here are seven standout statistics that offer a clear snapshot of Facebook’s reach and influence:
- Facebook has an estimated 3.07 billion monthly active users worldwide as of 2025.
- Daily active users (DAU) on Facebook number around 2.11 billion, representing roughly 68.7% of monthly users.
- In January 2025, Facebook’s tools showed at least 2.28 billion users age 13+ globally.
- India is home to the largest national Facebook audience, with approximately 581.6 million users.
- Facebook’s global addressable advertising reach increased 4.3% in the 12 months to early 2025.
- Approximately 35.3% of people aged 13+ worldwide used Facebook in January 2025.
- Among global social media platforms, Facebook accounts for about 59% of the total social media user base as of early 2025.
Recent Developments
- Facebook reported its best three-year span of growth among U.S. and Canadian adults aged 18-29, with more than 40 million now checking the platform daily.
- Facebook’s global potential audience reach figure grew by roughly 93.3 million users over 12 months ending January 2025.
- The platform continues expanding in regions where growth had previously slowed, including the Asia Pacific and Latin America.
- Facebook’s advertising tools now reach approximately 39.4% of all adults (age 18+) globally as of January 2025.
- Reports show a renewed focus on younger demographics and video-centric features, partly to counter competition from platforms like TikTok.
- In regions where Facebook was previously blocked or limited, growth is still constrained, which impacts the “eligible” user rate calculation.
- Facebook’s position within the broader corporate ecosystem of Meta Platforms (which includes Instagram, WhatsApp, etc.) means cross-platform synergies increasingly shape its development.
General Facebook Statistics
- As of 2025, Facebook’s monthly active users (MAUs) worldwide are estimated at around 3.065 billion.
- Facebook’s DAU (daily active users) figure is about 2.11 billion, up from earlier years.
- Facebook’s share of the global social media user base is about 59.4%.
- In January 2025, Facebook tools showed a user count of 2.28 billion aged 13+ globally.
- Facebook’s global adoption rate (age 13+) was approximately 35.3%, rising to 43.7% when excluding users in China (where the service is blocked).
- Facebook’s reach for ads increased by 4.3% year on year as of early 2025.
- The number of monthly active users grew from about 2.96 billion in 2022 to 3.07 billion in 2025, roughly a 3% increase.
- Facebook accounts for the largest portion of internet users connected to a social network in many mature markets, including the U.S.
- Outside the U.S./Canada, approximately 90% of Facebook’s daily active users reside, reflecting its truly global scale.
- The platform’s growth in some markets is now more incremental than explosive, suggesting maturity in certain regions.
Facebook Usage Statistics
- U.S. penetration of Facebook reached approximately 72.1% of the population in 2023, with projections up toward 75.8% by 2027.
- Globally, an average person uses about 2 hours and 21 minutes daily on social media; the U.S. average is slightly lower at about 2 hours and 9 minutes.
- Facebook dominates the social media usage landscape with over 3 billion users vs fewer on competing platforms in 2025.
- In Europe, Facebook reached approximately 308 million monthly active users as of the recent data.
- Among all social media platforms, users engage on about 6.8 different platforms per month on average.
- In mature markets, usage growth is flatter, while emerging regions still show higher relative growth rates.
- Facebook’s time spent metric is still strong, but it competes with short-form video platforms for attention.
- In countries where Facebook has been restricted, measured usage may underrepresent latent demand and potential growth.
Facebook User Demographics
- The largest age bracket on Facebook globally falls in the 25-34 years range (~31.1%).
- Gender distribution data indicates roughly 56.8% male and 43.2% female users in one dataset.
- Younger users (Gen Z) show comparatively lower usage of Facebook in some markets, with trend shift toward newer platforms.
- Women tend to have larger “friend networks” on Facebook than men in many countries, per demographic research.
- In Asian markets, the gender divide in Facebook adoption diminishes among older adults.
- Facebook advertising tools reached about 39.4% of all global adults age 18+ as of January 2025.
- Users under age 34 now represent less than half of Facebook’s total user base in many mature markets.
- Regional socio-economic factors influence Facebook adoption differentially; urban vs rural divides remain relevant.
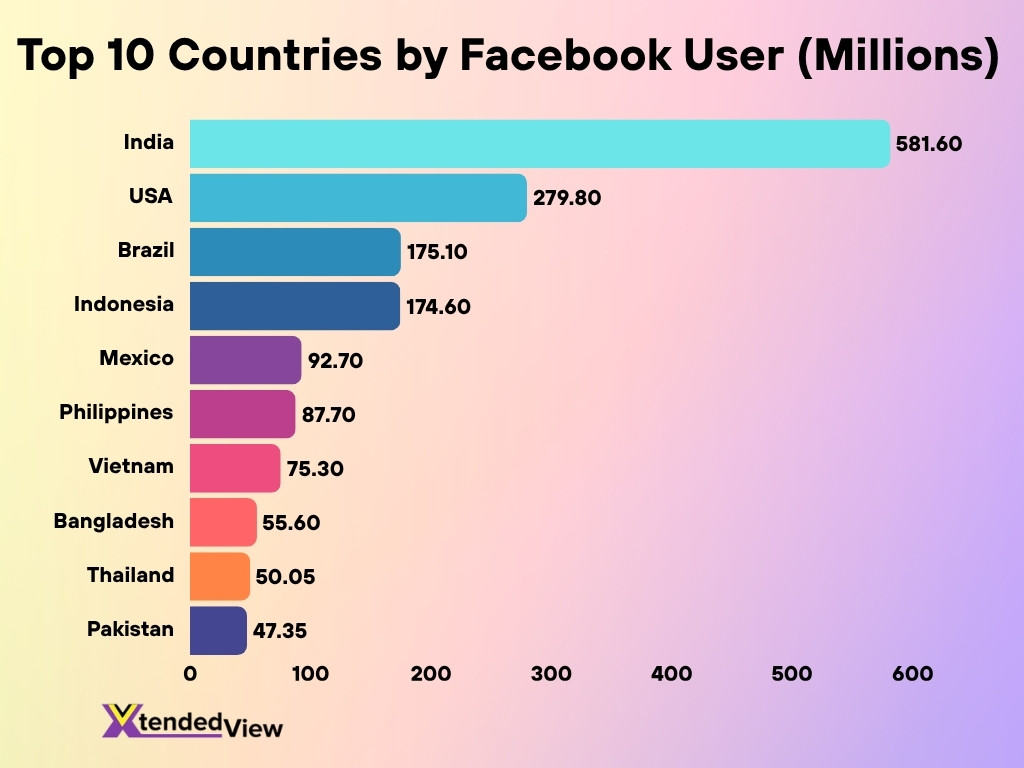
Facebook Users by Country
- India leads with approximately 581.6 million Facebook users as of 2024/25.
- The United States has around 279.8 million users, placing it second globally.
- In Indonesia, there were about 174.6 million Facebook users in January 2025, representing roughly 61.2% of its population.
- Brazil reports about 175.1 million Facebook users (2024 estimate).
- Mexico recorded approximately 92.7 million users.
- The Philippines, around 87.7 million Facebook users.
- Vietnam, roughly 75.3 million Facebook users.
- Bangladesh, about 55.6 million users.
- Thailand, nearly 50.05 million Facebook users.
- Pakistan, approximately 47.35 million users.
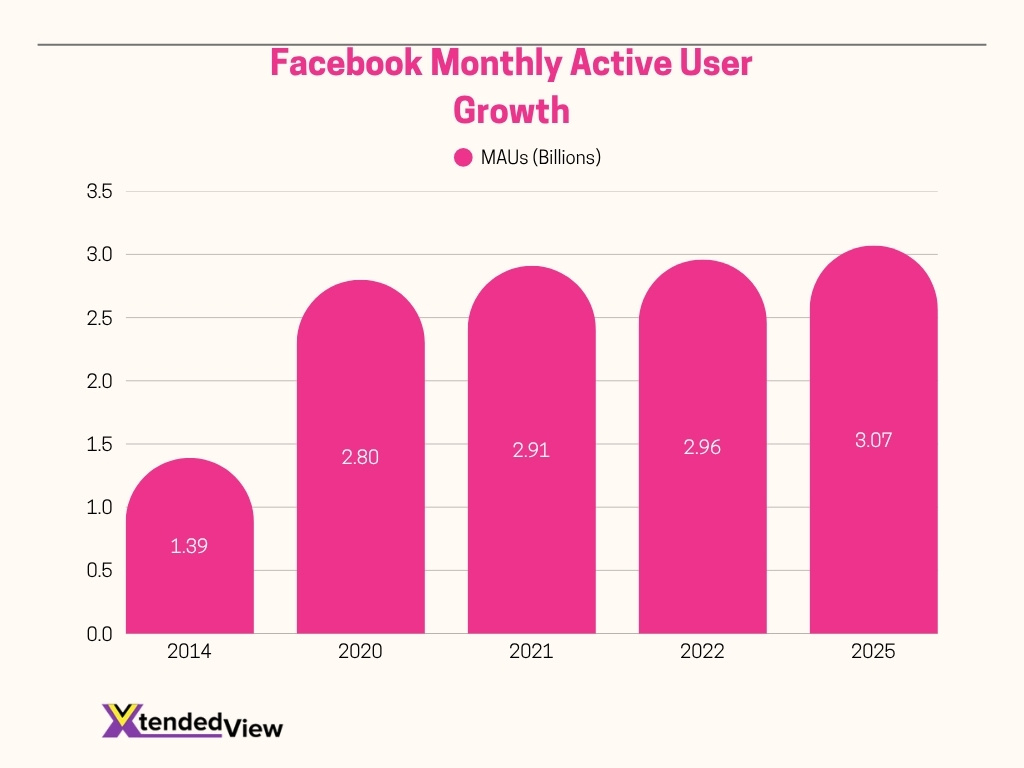
Facebook Growth & History
- By early 2025, Facebook had grown to approximately 3.07 billion monthly active users (MAUs), up from about 2.96 billion in 2022, a ~3% increase.
- The platform’s potential global ad reach in January 2025 was around 2.28 billion users, representing roughly 35.3% of the global population aged 13+.
- The year-on-year growth in Facebook’s global potential audience reach was about 4.3%, which equates to an additional ~93 million users over the prior 12 months.
- Since 2014, the user base expanded from 1.39 billion MAUs to 3.07 billion in 2025, an overall growth of ~120%.
- Growth has matured in many established markets; new user gains are now incremental rather than explosive.
- In emerging regions, growth is still meaningful, but the global growth rate reflects the platform’s scale and saturation.
- Earlier milestones, Facebook had ~2.91 billion MAUs in 2021 and ~2.80 billion in 2020.
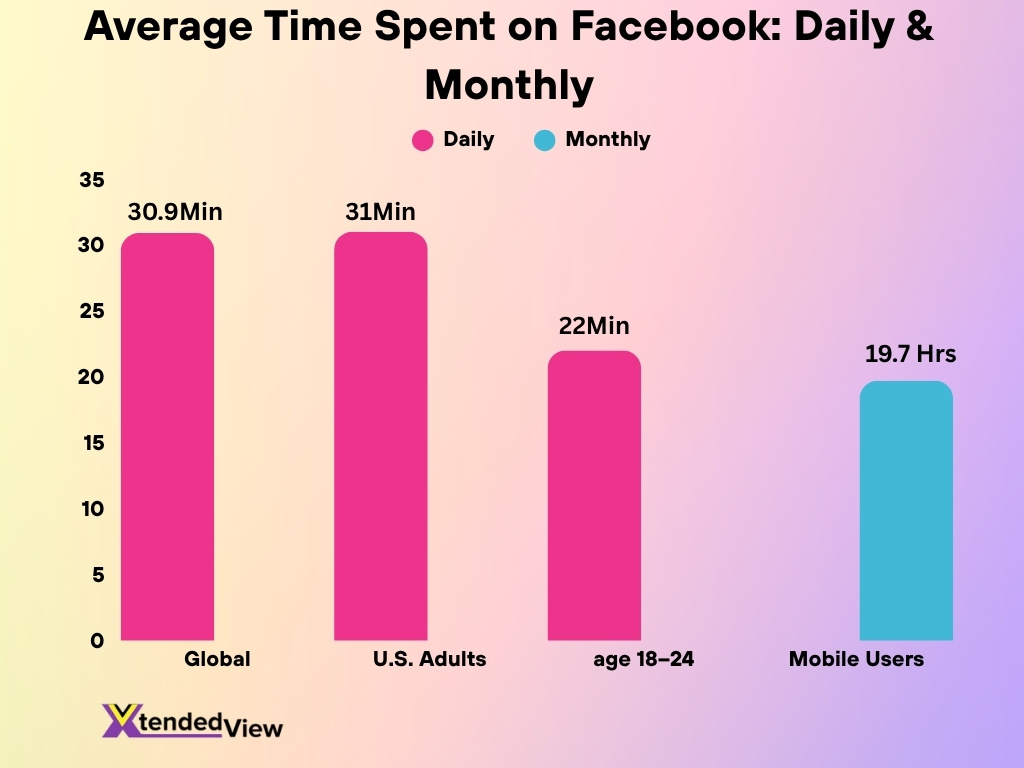
Average Time Spent on Facebook
- In 2025, the average daily time spent on Facebook is around 30.9 minutes per user.
- Similar studies place the daily average at around 31 minutes for U.S. adult users.
- The average monthly time spent is ~19 hours 43 minutes (~19.7 hours) for mobile users.
- Among younger users (age 18-24), the daily average may be lower (~22 minutes).
- The time spent metric has been trending downward in mature markets as other platforms capture more attention.
- On average, users reportedly access Facebook about 8 times per day.
Facebook Engagement Statistics
- The overall average engagement rate on Facebook in 2025 is approximately 1.3% across all types of posts.
- By industry, engagement rates vary; for example, in the education sector, Facebook recorded ~2.2% average engagement.
- In media & entertainment, the engagement rate was much lower, around 0.8%.
- Engagement fell in 2025, one benchmarking study finds. Facebook’s rate dropped ~36% year on year, compared to smaller dips for other platforms.
- Photo posts are performing better than other formats, one finding suggests pictures generated ~35% more engagement than text posts and ~44% more than videos.
- Pages post on average ~7.9 times per week for business accounts to maintain engagement.
- For brands, optimal posting frequency may be ~10 times/week to hit ~1.61% engagement rate.
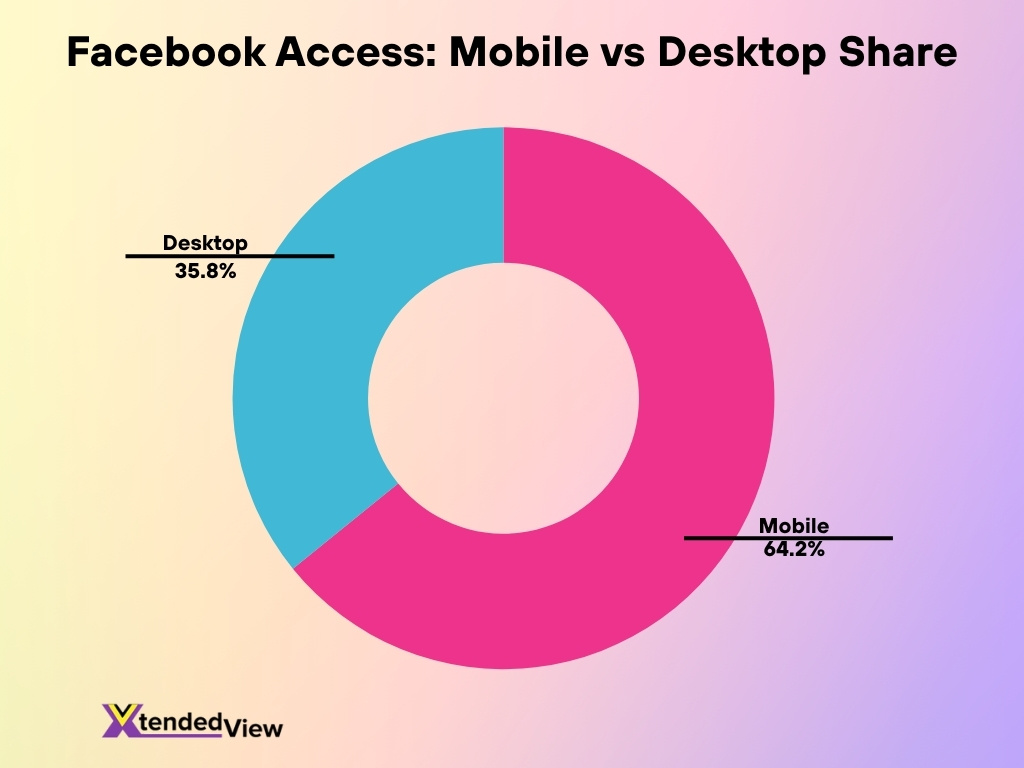
Facebook Mobile vs Desktop Usage
- Globally, mobile devices account for approximately 64.17% of total internet traffic from June 2024 to June 2025, with desktops at 35.83%.
- In the U.S., mobile devices accounted for ~56.75% of web traffic in late 2024, and desktops ~43.25%.
- On social platforms, the vast majority of users access Facebook via mobile rather than desktop.
- In 2025, mobile traffic share for websites reached ~64.35%.
- While specific Facebook mobile vs desktop usage numbers are less frequently reported, the broader trends confirm mobile-first consumption.
- The shift toward mobile matters for content format, videos, stories, and shorter sessions aligns with mobile behavior.
Facebook Video Statistics
- In 2025, users spend on average 35 minutes per day on Facebook, with video content a significant component.
- Video marketing data, among marketers, ~71% say Facebook videos are effective for engagement and reach.
- Mobile-first video on Facebook can boost brand awareness by up to ~67% compared to non-mobile-first formats.
- Captions on Facebook videos can increase viewing time by ~12%.
- Video content now represents ~60% of time spent on Facebook in some reports.
- Short-form video (Reels) adoption is rising rapidly, with the platform adapting to that trend.
- Business accounts prioritize video, vertical video ads with voiceover convert ~3% better per dollar spent than other ad formats.
Facebook Stories Statistics
- As of 2025, more than 300 million users access Facebook Stories (and Messenger Stories) daily.
- About 58% of users say they visited a brand’s website after seeing a Facebook Story (or similar vertical format).
- Stories format continues to grow as mobile usage dominates, particularly for time-sensitive or ephemeral content.
- The optimal timeframe to leverage Stories is during peak app usage times, early morning, and commutes remain strong.
- For brands, adding interactive elements (polls, swipe-ups) in Stories tends to increase engagement beyond standard posts.
- Stories enable brands to reach users outside the main feed algorithm, making them a strategic format for digital marketing.
Facebook Business/Brand Statistics
- Facebook Pages (brand accounts) average ~7.9 posts per week.
- In the U.S., Facebook ad tools reach ~62.2% of the population age 13+.
- On average, a Facebook user clicks ~12 ads per month.
- Approximately 93% of social media marketers rely on Facebook Ads as part of their strategy.
- Among millennials, ~69% still prefer Facebook over other platforms for their routine social use.
- The photo post engagement rate on brand pages is ~0.17%; status posts ~0.13%.
Facebook Advertising Statistics
- In 2025, the average click-through rate (CTR) for Facebook ads across industries increased to 1.40%, up from 1.26% in 2024.
- The average cost per click (CPC) in the construction sector dropped from $0.88 in 2024 to around $0.80 in 2025.
- Conversion rate (CVR) in home services ads rose from 6.5% in 2024 to 7.1% in 2025.
- Facebook ad reach (users age 13+) stood at 2.28 billion, meaning the platform’s advertising tools reached ~35.3% of the global 13+ population.
- That figure also translates to ~39.4% of all adults aged 18+ worldwide being reachable via Facebook ads.
- Facebook’s ads accounted for ~93% of its total revenue.
- Among social commerce shoppers in the U.S., about 38.5% of Facebook users say they expect to purchase on the platform in 2025.
- Among Facebook advertisers, shifting creative formats (e.g., videos, carousels) became a top priority for 2025 campaigns.
- Important KPIs in 2025 remain CPA, ROAS, and reach/impressions, with CPC and CPM continuing to be closely monitored.
Facebook Consumer Behavior Statistics
- In 2025, around 69% of U.S. consumers are expected to shop on Facebook.
- Among internet users, ~27% say they prefer discovering products via social media channels.
- In the U.S., for social commerce, the “add to cart” conversion via Facebook stands at about 34.10%.
- Approximately 4 in 10 Facebook users engage with brand content at least once daily (about 44%).
- Nearly 93% of social media marketers include Facebook ads as part of their strategy in 2025.
- Among millennials, ~69% still say they prefer Facebook over other social platforms.
- An estimated 10 million+ businesses worldwide advertise on Facebook.
- Facebook users under age 24 increasingly use other platforms too, which means multi-platform behavior is more common among younger demographics.
Most Active Times on Facebook
- The average daily time spent on all social platforms is about 2 hours 21 minutes globally in February 2025, with Facebook as a major contributor.
- Engagement peaks for Facebook are typically during the early evening (US time zones), around 7 p.m.–9 p.m.
- Weekends show a slightly higher per-session time on Facebook than weekdays in many mature markets.
- Using Stories or Video content within the first 2–3 hours of identified peak times yields higher view-through rates.
- Posting at times aligned with commute peaks (around 6 a.m. and 5–6 p.m.) shows higher engagement response rates.
- The concentration of ad impressions delivered across Facebook’s family of apps rose ~5% year over year in Q1 2025.
- Mobile usage further skews active times, morning and evening, when mobile phones are the top devices for Facebook access.
Facebook Marketplace & Shopping Statistics
- Approximately 16% of Facebook’s ~3.07 billion monthly active users shop on Facebook Marketplace, about 491 million users globally.
- Marketplace commands ~51% share within the social commerce space.
- In the U.S., about 38.5% of Facebook users expect to buy goods via the platform in 2025.
- Among Facebook Marketplace sellers, listing activity across furniture, clothing & accessories dominates the top categories.
- Annual downloads of the Facebook app exceeded ~571 million in 2024, expected to surpass ~600 million in 2025.
- Marketplace listings remain active in over 228 countries and territories.
- The growth of mobile-friendly ad and shopping formats (Stories, Reels) supports increased Marketplace interactions.
Facebook Security & Privacy Statistics
- The European Commission fined Meta nearly €797.72 million for tying Marketplace to Facebook in 2024.
- The number of people in the Meta “family” of apps (including Facebook) reached 3.43 billion daily active people, up 6% year over year.
- There is increasing public concern about privacy settings and ad targeting transparency on Facebook.
- Facebook continues to refine its ad disclosure and data use policies in response to evolving global privacy standards.
- Meta expects capital expenditures in the range of $60–65 billion, driven by infrastructure, monetization, and regulatory efforts.
- The trend toward stronger user consent tools and privacy controls continues to escalate.
- Studies indicate that younger users are more likely to use alternative platforms due to privacy concerns.
Facebook Revenue & Financial Statistics
- In 2024, Facebook generated approximately $164.5 billion in revenue, a ~21.9% increase over 2023.
- For the twelve months ending June 2025, Meta’s revenue was about $178.805 billion, a ~19.4% year-over-year increase.
- North America contributed ~$72 billion of Facebook’s 2024 revenue, despite accounting for only ~8.9% of its user base.
- In Q1 2025, Meta reported revenue of $42.31 billion, up 16% year over year.
- Worldwide average revenue per user (ARPU) was about $13.12, with U.S./Canada ARPU at ~$68.44 and Europe at ~$23.14.
- Approximately 93% of Facebook’s revenue stems from its advertising business.
- Some project ad revenue growth to slow, with Facebook ad revenue in 2025 estimated at ~$123.73 billion.
Facebook vs Other Social Platforms
- Facebook’s ad reach at ~2.28 billion users placed it second only to some platforms outside China.
- Facebook accounts for roughly 59% of the global social media user base in many datasets.
- Facebook continues to hold a more established position compared to newer platforms like TikTok.
- Facebook’s mature user base and strong advertiser infrastructure remain differentiators.
- Some other platforms may show faster growth rates in specific demographics, but Facebook’s scale gives it strength.
- Facebook remains one of the top choices for brands, especially targeting older demographics.
- From a revenue perspective, Facebook remains among the top digital ad platforms globally.
Frequently Asked Questions (FAQs)
Facebook has approximately 3.07 billion monthly active users (MAUs) in 2025.
The platform’s adoption among people aged 13+ is about 35.3%, increasing to 43.7% when excluding China.
Facebook reports around 2.11 billion DAUs, representing roughly 68.7% of its monthly users logging in daily.
The potential ad reach grew by 4.3%, equating to about 93.3 million additional users in a 12‑month span.
Facebook accounts for roughly 59% of the worldwide social media user base.
Conclusion
The data paints a clear picture: Facebook remains a gigantic force in social media, advertising, and commerce. With billions of users worldwide, it offers unmatched reach and continues to generate substantial revenue. For businesses, the platform still delivers major value, though the growth rate is moderating and consumer behaviour is shifting.
Advertisers and brands need to focus on improved creatives, mobile-first formats, precise audience targeting, and strong privacy compliance to remain effective. As Facebook competes with younger platforms and evolves its offerings, staying data-driven will be key.