Customer experience now affects far more than service satisfaction. It influences repeat purchases, customer acquisition, revenue protection, and long-term growth. In retail, companies use AI-assisted support and personalization to reduce friction during buying journeys, while banks and financial services firms connect customer data across channels to resolve issues faster and retain account holders. Rising expectations around speed, transparency, and personalization make CX a measurable business priority. Explore the statistics below to see how customer experience is changing and what those shifts mean for businesses.
Editor’s Choice
- The global customer experience management market is projected to reach $26.11 billion in 2026, up from $22.35 billion in 2025.
- 85% of CX leaders say customers may abandon a brand when a problem remains unresolved, even after the first interaction.
- 95% of consumers expect an explanation when AI makes decisions that affect their customer experience.
- 72% of U.S. consumers said in 2025 that they would pay more for a premium experience with a company.
- Consumers who receive excellent experiences are about 2.5 times more likely to purchase more, demonstrating the revenue value of CX quality.
- Global research estimates that poor customer experiences placed roughly $3.8 trillion in sales at risk in 2025, reflecting both reduced spending and customers leaving companies altogether.
- 70% of U.S. executives surveyed in 2025 said customer expectations were changing faster than their organizations could adapt.
Recent Developments
- 83% of CX leaders in 2026 say AI agents capable of retaining customer context and history are important for delivering genuinely personalized journeys.
- 74% of customers find it frustrating when they must repeatedly explain their situation to different agents, putting greater pressure on companies to preserve context across interactions.
- 76% of consumers say they would favor a company that allows text, images, and video within one support thread without making them restart the conversation.
- Consumer demands for AI transparency increased sharply, with 63% saying their expectations for transparency are higher than a year earlier.
- Although 80% of CX leaders agree that transparency will become essential for customer-facing AI, only 37% currently explain the reasoning behind AI decisions.
- A 2026 global study of 27,000 customers, 3,500 service representatives and 3,900 executives found that service representatives spend only 45% of their working time directly supporting customers.
- In 2026, 81% of marketers in India reported adopting AI, while 92% said customers increasingly expect two-way conversations with brands, illustrating how conversational CX expectations are expanding outside the U.S.
Customer Experience Management Market Growth
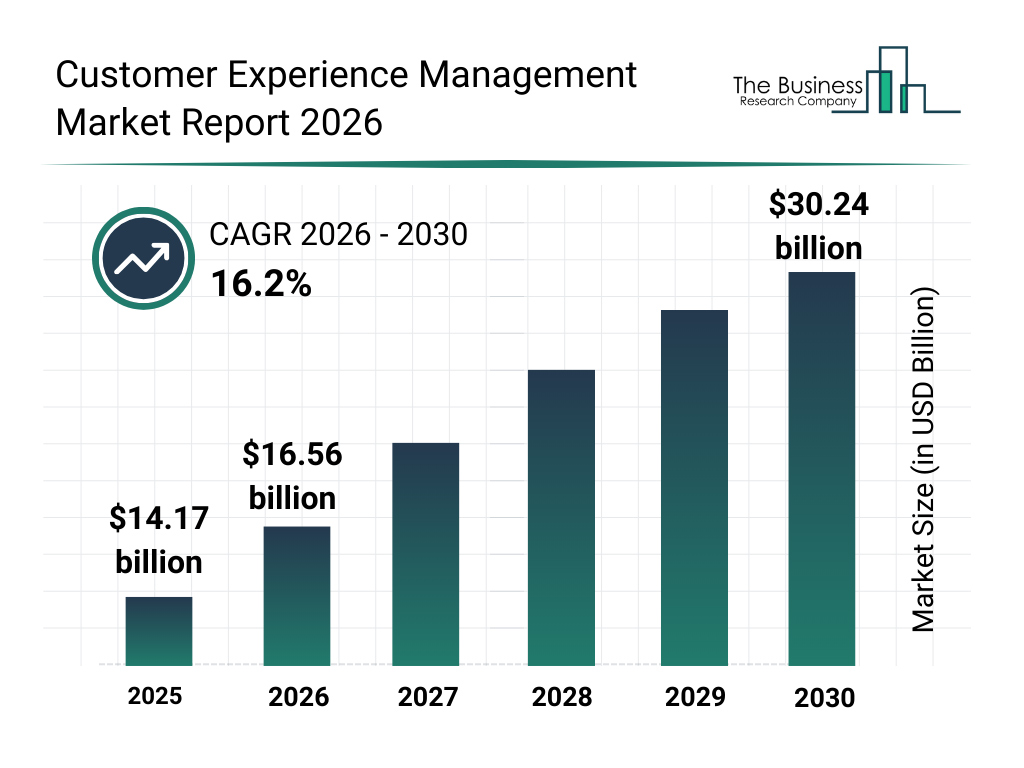
- The global customer experience management market was valued at $14.17 billion in 2025.
- The market is projected to increase to $16.56 billion in 2026, showing strong year-over-year expansion.
- By 2030, the customer experience management market is expected to reach $30.24 billion, more than double its 2025 value.
- From 2026 to 2030, the market is forecast to grow at a robust 16.2% CAGR.
- The market is expected to add approximately $13.68 billion in value between 2026 and 2030.
- Strong double-digit growth highlights rising business investment in customer engagement, personalization, digital experiences, and customer service technologies.
Customer Experience and Business Growth
- Customers who have excellent experiences are 2.5 times more likely to buy more than customers with weaker experiences.
- In 2025 global online-retail research, 82% of customers said they were likely to purchase more following their experience with an online retailer.
- The same online-retail research found 84% customer satisfaction, showing how high satisfaction and purchase intent can occur together in mature digital categories.
- 76% of online-retail customers said they were likely to recommend the company, making advocacy another potential source of customer acquisition.
- 75% of those online-retail customers reported a likelihood to trust the business, which matters because trust supports repeat transactions and longer customer relationships.
- Across 2025 CX research, satisfaction rose by about 3 percentage points year over year, while likelihood to recommend and likelihood to purchase more each improved by roughly 2.6 to 2.7 percentage points.
- In a 2025 U.S. executive survey, 84% of executives said their companies had increased spending on customer loyalty, showing that businesses continue to treat customer relationships as a growth investment.
- However, 83% of executives said they still needed better tools to determine what drives customer purchases, suggesting that many organizations struggle to connect CX investment directly to growth outcomes.
Customer Experience and Revenue
- Poor customer experiences put an estimated $3.8 trillion in global sales at risk in 2025.
- Within the countries directly analyzed, customers were estimated to reduce spending by approximately $2.18 trillion because of poor experiences.
- Another $811 billion in spending was at risk because consumers could stop doing business with companies altogether following very poor experiences.
- In the U.S. alone, poor customer experiences placed approximately $1.4 trillion in sales at risk, making the country the largest source of revenue exposure in the study.
- Consumers reported very poor experiences in about 12% of interactions across the countries studied for the 2025 analysis.
- Customers reduced spending after 38% of very poor experiences, while another 15% of those experiences resulted in customers stopping their spending with the company entirely.
- Taken together, poor experiences placed approximately 6.1% of sales at risk across the 23 directly studied markets.
- The percentage of poor interactions followed by reduced or stopped spending increased by 2.7 percentage points compared with the previous study period, showing that customers became more financially responsive to service failures.
- In 2025, 72% of U.S. consumers said they would spend more for a premium experience, providing evidence that better CX can support price premiums as well as protect existing revenue.
Customer Experience Return on Investment
- Customers receiving excellent experiences are around 2.5 times more likely to purchase more, making purchase intent one of the clearest measurable returns associated with better CX.
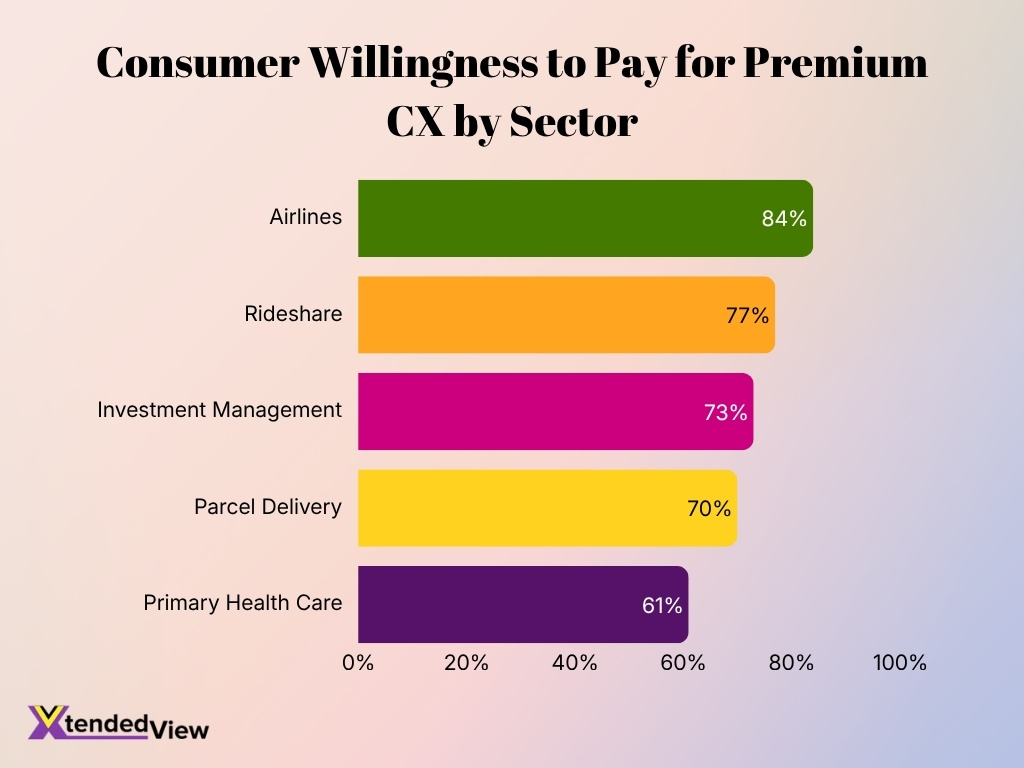
- 72% of U.S. consumers are willing to pay more for a premium customer experience, creating potential for businesses to recover CX investment through higher-value transactions.
- Among airline customers, willingness to pay more for an upgraded experience reaches 84%, the highest figure among the sectors measured in the 2025 U.S. study.
- 77% of rideshare customers say they would pay more for an improved experience, demonstrating the economic value of CX even in highly price-transparent digital markets.
- 73% of investment-management customers would consider paying more for better experiences, showing that CX premiums extend into financial services.
- 70% of parcel-delivery customers say they would pay extra for an upgraded experience, linking reliability and convenience with consumers’ willingness to spend.
- Better customer service itself commands a premium: 68% of U.S. consumers said they would pay more for improved customer service support.
- Even in primary health care, where customer choice operates differently from retail, 61% of consumers said they would pay more for an improved experience.
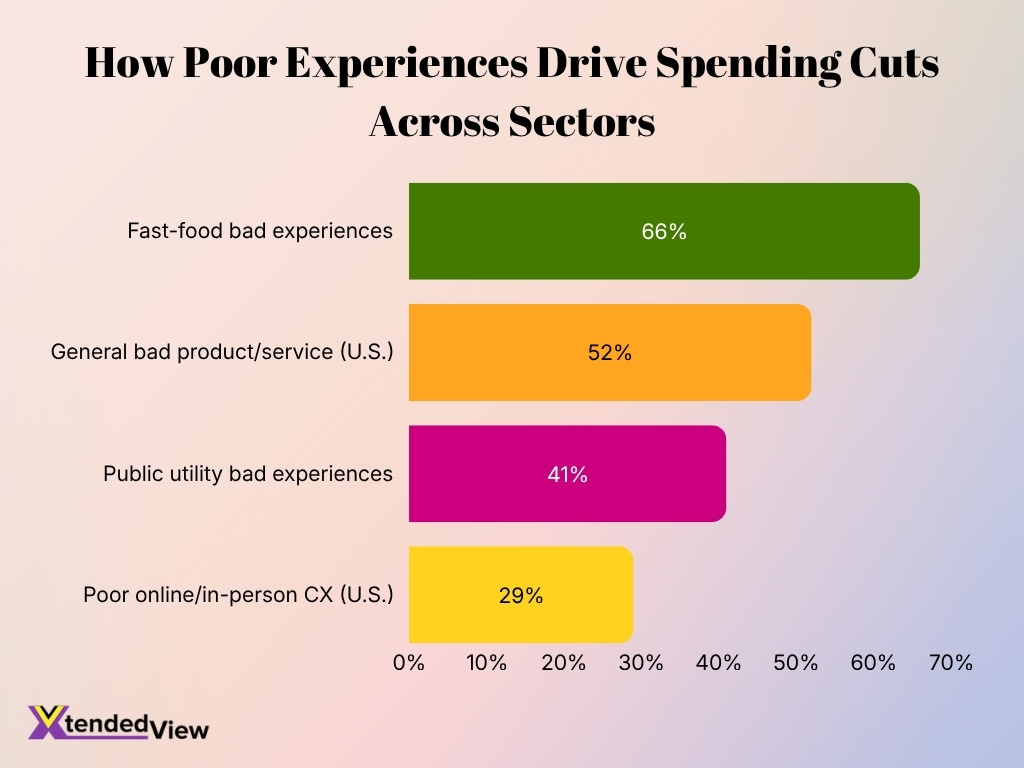
- ROI also comes from avoiding losses: nearly 29% of U.S. consumers said poor online or in-person CX caused them to stop buying from a brand in 2025, meaning improvements can protect revenue that would otherwise disappear through preventable customer loss.
Customer Experience and Customer Loyalty
- In a 2025 U.S. survey, 89% of executives believed customer loyalty had increased in recent years, while only 39% of consumers reported becoming more loyal. This 50-point perception gap shows why companies cannot rely on internal assumptions about loyalty.
- 57% of executives said their loyalty systems were not producing the outcomes their organizations needed, despite considering customer loyalty important.
- Another 46% of executives expected their current loyalty program to become irrelevant within three years, indicating that points-based and conventional rewards models face growing pressure.
- Global 2025 research found that customers rated 76% of recent experiences four or five stars for satisfaction, yet only 69% said they were likely to purchase more. The seven-point difference illustrates how satisfaction does not automatically create behavioral loyalty.
- The same global research found that 73% of consumers trusted an organization after a recent interaction, while 70% said they would recommend it.
- Customers who receive good service are 88% more likely to say they will purchase again, reinforcing the connection between service interactions and repeat business.
- 75% of customers have recommended a company because of excellent customer service, making service quality an important source of word-of-mouth acquisition.
- Emotional brand connections have weakened: 54% of customers report feeling emotionally connected to brands they buy from, down from 62% in 2022.
- In 2026 research covering 20,000 consumers, satisfied customers were 4.1 times more likely to recommend a company and 3.8 times more likely to trust it.
Customer Experience and Customer Retention
- In 2026 global research, satisfied customers were 2.3 times more likely to purchase more than dissatisfied customers, linking positive experiences with continued commercial relationships.
- The same 2026 research found that approximately one in two bad experiences leads customers to cut spending, making experience recovery an important retention strategy.
- In a large 2025 U.S. survey, 29% of consumers said they stopped buying from or using a company because of poor online or in-person customer experience.
- The retention threat grows when product and service quality enter the equation: 52% of U.S. consumers said they had stopped using or purchasing from a brand following a bad product or service experience.
- In 2025 global research, 69% of consumers said they were likely to purchase more following a recent interaction, compared with a 76% overall satisfaction rate.
- Customer service can strengthen retention after the sale: 88% of customers say good service makes them more likely to purchase again.
- The 2026 CX environment has also raised expectations for availability. 74% of consumers now expect customer service to operate 24/7 because of AI.
- Moreover, 88% of customers expect faster response times than they did just one year earlier. Companies therefore face greater retention risk when customers encounter long waits.
- Context matters as well: 74% of customers find it frustrating when they must repeatedly explain their situation to different agents. Preserving interaction history can reduce a common source of retention-damaging friction.
Customer Experience and Customer Churn
- 52% of U.S. consumers surveyed in 2025 said they stopped buying from a company because of a bad experience with its products or services.
- Separately, 29% of consumers reported abandoning a company specifically because of poor customer experience online or in person.
- Global 2026 research found that one in two poor experiences results in customers cutting their spending, demonstrating how quickly dissatisfaction can affect customer value.
- Earlier global research calculated that customers decreased spending following 38% of very poor experiences.
- An additional 15% of very poor experiences resulted in consumers stopping their spending with the organization entirely, rather than merely reducing it.
- Fast-food businesses face particularly high churn exposure: consumers cut or stop spending after 66% of bad experiences in that industry.
- Public utilities recorded a lower, but still substantial, rate, with consumers reducing their interactions or spending after 41% of bad experiences.
- Regional 2026 research illustrates the same risk outside the U.S.: 44% of Indian consumers said they were ready to switch brands after customer service failures.
- Customers in that Indian study spent an average of 10.8 hours per year trying to resolve service problems, showing how accumulated customer effort can create conditions for churn.
Customer Expectations for Customer Experience
- 88% of customers say they expect faster responses than they did one year ago, making speed one of the clearest shifts in 2026 CX expectations.
- 74% of consumers now expect customer service to remain available 24/7 because AI has changed their expectations around accessibility.
- Transparency has become equally important: 95% of consumers expect explanations for decisions made by AI.
- 74% of customers dislike having to repeat their story to different agents, indicating that customers increasingly expect companies to maintain context between interactions.
- Personal recognition is improving: 73% of customers now say companies treat them as individuals rather than numbers, compared with 39% in 2023.
- However, privacy expectations have risen alongside personalization. 71% of customers say they have become increasingly protective of their personal information.
- 72% of customers consider it important to know when they are communicating with an AI agent, reinforcing demand for clear disclosure in automated interactions.
- Trust remains fragile: only 57% of customers trust companies to use AI ethically.
- In 2026, customers were about three times more likely to use third-party generative AI tools than company-provided chatbots when trying to resolve customer service issues. The finding suggests that customers increasingly compare branded service tools with the broader AI experiences available to them.
- Meanwhile, 70% of U.S. executives say customer expectations are evolving faster than their companies can adapt, highlighting the operational challenge behind these changing demands.
Customer Service Response Time Statistics
- 88% of customers in 2026 expect companies to respond faster than they did one year earlier.
- 74% of consumers expect customer support to operate 24 hours a day, seven days a week because AI has reset expectations for service availability.
- In consumer service research, 96.5% of people said a fast customer service response was important or very important.
- 72.1% of consumers said they would be more likely to use a company again when it resolved their complaint or question quickly.
- Slow responses directly affect experience quality: 36.8% of consumers said slow customer service responses created a poor experience.
- 26.3% of consumers expected companies to resolve their service question within 30 minutes.
- Another 37.2% expected resolution within four hours, illustrating how short the acceptable service window has become for many customers.
- Contact-center research involving more than 23,000 consumers found that fewer than two-thirds of issues were resolved during the first call, leaving substantial room for improvement in first-contact resolution.
- In 2026 global research, service representatives spent only 45% of their working time directly supporting customers, suggesting that fragmented workflows and administrative work can constrain response capacity.
- In U.S. supermarket CX benchmarks, call centers scored only 76 out of 100, below measures such as ease of pickup, store convenience and mobile-app quality, which each reached 84.
Customer Satisfaction Statistics
- The U.S. national customer satisfaction score stood at 76.9 out of 100 in the fourth quarter of 2025, unchanged over the preceding six months.
- On an annual basis, U.S. customer satisfaction fell 0.5% in 2025 and had not recorded a material increase since 2017.
- In the second quarter of 2025, national customer satisfaction had already declined for three consecutive quarters, reaching the same 76.9 score.
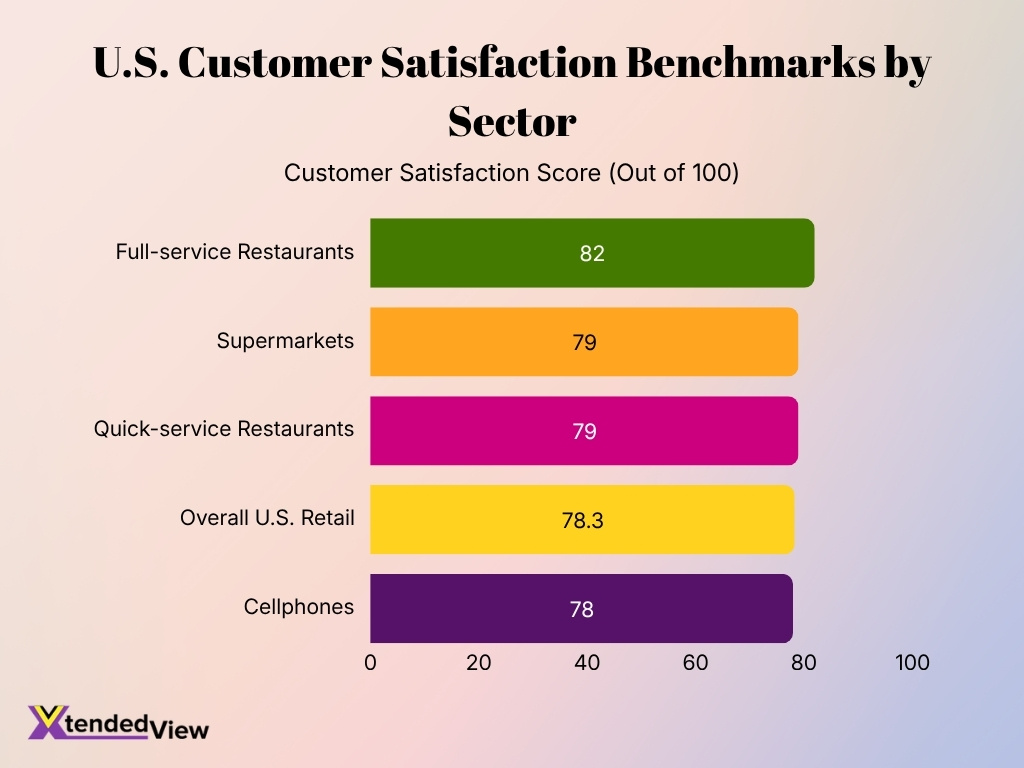
- The overall U.S. retail sector scored 78.3 out of 100 in early 2025, a 0.4% year-over-year improvement.
- Supermarket customer satisfaction reached 79 out of 100, remaining stable after a 4% increase in the previous study.
- More than 65% of tracked online retail brands recorded declining satisfaction scores, showing that digital retail did not share evenly in the sector’s overall improvement.
- Full-service restaurants recorded a customer satisfaction score of 82 out of 100 in 2025 despite a 2% decline, keeping the industry among the higher-scoring U.S. categories.
- Quick-service restaurants held steady at 79 out of 100, while their mobile-app satisfaction score improved 1% to 83.
- Cellphone satisfaction dropped 4% to 78 in 2025, reaching its lowest level in a decade despite continued investment in new AI-enabled features.
- In 2026 global research, good customer service produced a 92% satisfaction rate, outperforming good value for money as a satisfaction driver.
Personalization in Customer Experience
- Globally, 64% of consumers prefer purchasing from companies that tailor experiences to their individual wants and needs.
- Personalization preferences vary sharply by market: 82% of consumers in India prefer tailored experiences, compared with only 37% in Japan.
- In the U.S., 39% of consumers expect brands to personalize online shopping through tailored interactions, recommendations, and marketing based on individual preferences and behavior.
- 73% of customers say companies now treat them as individuals rather than numbers, up dramatically from 39% in 2023.
- Despite that improvement, only 49% of customers believe companies use their personal information in ways that benefit them, exposing a gap between data collection and perceived customer value.
- 86% of consumers in 2026 say they would share more personal information if organizations were clearer and more transparent about how they use that data.
- Personalization can have a commercial upside: customers exposed to personalization during a recent purchase journey were 1.8 times more likely to pay a premium.
- However, personalized marketing generated negative experiences for 53% of customers in one 2025 study. Those customers were 3.2 times more likely to regret their purchase.
- Customers who experienced problematic personalization were also 44% less likely to purchase again, showing that personalization can damage retention when it creates pressure or misses the customer’s needs.
- Personalized purchase journeys made customers twice as likely to feel overwhelmed by information and 2.8 times more likely to feel pressured for time, underscoring the need to personalize selectively rather than maximize personalization at every touchpoint.
Omnichannel Customer Experience Statistics
- 84% of consumers identified as omnichannel buyers in purchase data covering the 52 weeks ending Jan. 1, 2026, meaning they shopped across both physical and digital environments.
- 79% of customers expect consistent interactions across departments, showing that customers view sales, marketing and service as parts of one relationship rather than isolated functions.
- However, 55% of customers say interactions often feel like conversations with separate departments instead of one connected company.
- 74% of customers expect to be able to complete online the same activities they can complete in person or over the phone.
- 71% of customers prefer different channels depending on the context of the interaction, which makes channel choice an important part of CX design.
- 64% of customers use multiple devices while starting and completing a single transaction, highlighting the importance of maintaining state and customer data across devices.
- In global channel research involving 23,730 consumers, 61% preferred a human-mediated channel on average across nine common activities rather than digital self-service or automated chat.
- Automated chat remained the least-preferred option, with only 8% of consumers choosing it on average across the nine activities studied. The preference increased to 12% for checking an order status and 10% for booking an airline ticket.
- Multimodal support is becoming part of omnichannel CX: 76% of consumers say they would choose a company that allows them to use text, images, and video in the same conversation without restarting.
Customer Service Channel Preferences
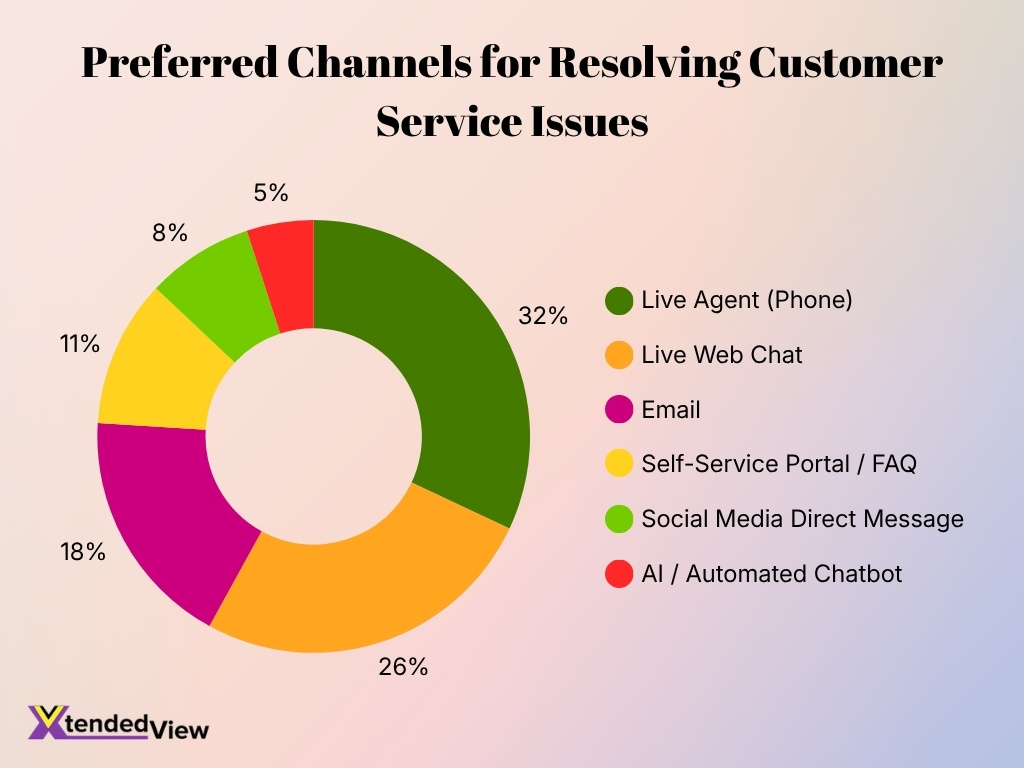
- Live agent phone support is the most preferred option, chosen by 32% of customers for resolving customer service issues.
- Live web chat ranks second at 26%, showing strong demand for fast, real-time digital assistance.
- Email support is preferred by 18% of customers, making it the third-most popular service channel.
- Self-service portals and FAQs attract 11% of customers, indicating a smaller but notable preference for resolving issues independently.
- Social media direct messages are preferred by just 8% of customers when seeking customer service assistance.
- AI and automated chatbots rank last at only 5%, suggesting customers still favor human-assisted support for issue resolution.
- Combined, 58% of customers prefer either phone support or live web chat, highlighting the importance of real-time customer service channels.
Digital Customer Experience Statistics
- Analysis of 37 million users and 223 million digital sessions in 2025 examined 258 billion events to measure how customers respond to digital performance problems.
- 91% of consumers experienced at least one issue affecting their digital experience during the previous 12 months.
- 40% of users encounter at least one app crash or slow-loading problem every week.
- Another 15% of users report encountering 10 or more app crashes or slow-loading incidents, indicating that a smaller segment experiences recurring digital friction at high frequency.
- The 2025 analysis found a direct performance relationship: every 1% decline in digital quality corresponded with a 1% increase in customer churn.
- After a strong video-streaming experience, 93% of users return within seven days, illustrating how digital performance can affect near-term engagement.
- More than half, 51% of customer service journeys now begin on third-party digital platforms rather than on a company’s own service channel.
- Among Gen Z customers, that figure rises to 74%, with nearly three-quarters starting their service journey outside the company’s official channels.
- In mobile-commerce research from India, 59% of consumers prioritized faster app loading, while 57% wanted a simple interface, 52% wanted personalization, and 41% valued seamless payments. The findings show that digital CX priorities extend beyond visual design to speed and transaction reliability.
Artificial Intelligence in Customer Experience
- Customer service organizations using AI agents increased from 39% in 2025 to 66% in 2026, representing approximately 1.7 times the adoption level within one year.
- Overall, 85% of customer service organizations now use at least one form of AI in their service operations.
- 70% of organizations using AI service agents report measurable value within 60 days of deployment.
- Among organizations using AI agents, 77% deploy them in both customer-facing and internal operations, rather than restricting the technology to one side of the service workflow.
- 89% of service professionals whose organizations already use AI agents believe expanding their use would benefit the organization.
- Still, only 44% of consumers trust AI to handle their customer service needs, while 65% of service professionals believe their customers fully trust AI. The gap suggests businesses may overestimate consumer confidence.
- In 2026, customers were roughly three times more likely to use third-party generative AI tools than a company’s own chatbot when trying to resolve a customer service issue.
- Customer service leaders invested a median 12% of their 2025 budgets in AI, the highest allocation among 10 business functions examined, but only 24% demonstrated positive financial returns across AI use cases.
- 91% of customer service leaders report pressure from executive leadership to implement AI in 2026, showing how quickly AI has moved onto executive CX agendas.
- Customer-facing AI still has an understanding problem. In a 2026 study of 7,001 consumers, AI interactions scored 4.41 for friendliness but only 4.08 for understanding, the widest behavioral gap among the interaction types studied.
Leading Causes of Customer Frustration
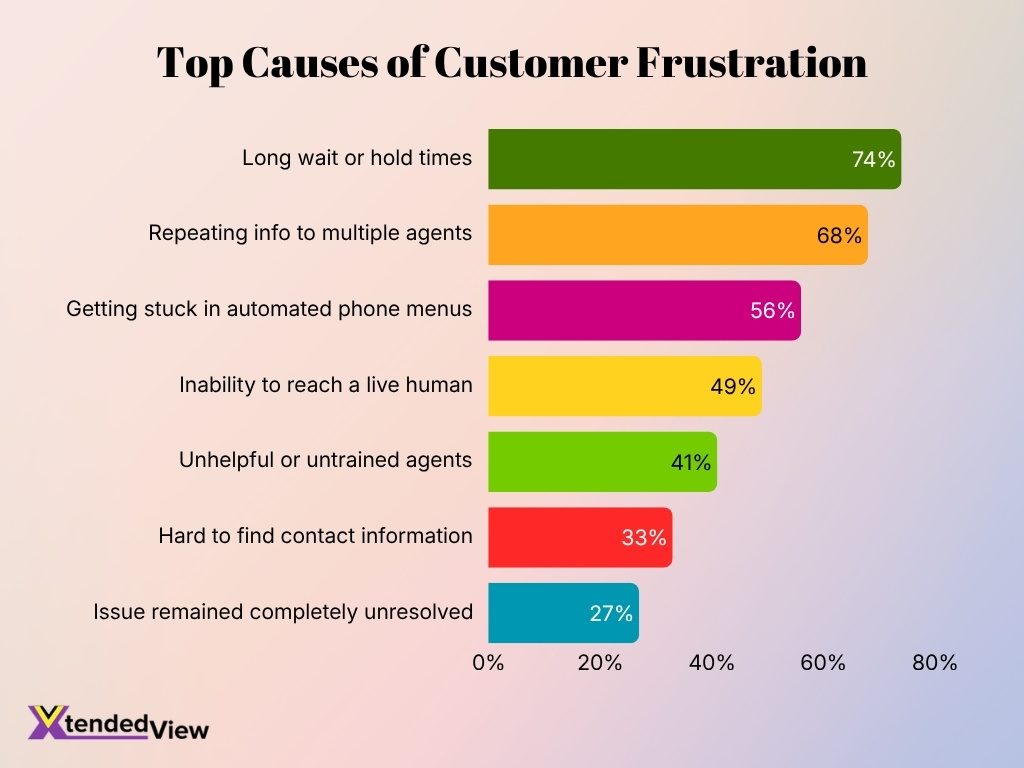
- Long wait or hold times are the biggest source of customer frustration, affecting 74% of customers.
- 68% of customers are frustrated when they have to repeat the same information to multiple agents, highlighting poor support continuity.
- Getting stuck in automated phone menus frustrates 56% of customers, suggesting automation can create friction when poorly designed.
- Nearly half of customers, 49%, report frustration when they are unable to reach a live human agent.
- Unhelpful or untrained agents negatively affect 41% of customers, emphasizing the importance of effective staff training.
- 33% of customers are frustrated by difficulty finding contact information, indicating that support channels need to be easier to locate.
- Even after seeking assistance, 27% of customers say their issue remained completely unresolved, representing a significant customer experience failure.
Customer Feedback and Voice of the Customer
- After a very good experience, only 31% of consumers sent feedback directly to the company in 2025 research, 6.5 percentage points lower than the comparable 2021 figure.
- Following a very poor experience, 32% of consumers gave feedback directly to the company, representing a 7.7-point decline from 2021.
- Among customers who contacted a business directly after a negative experience, 49% used email, making it the most common direct feedback channel in the study.
- Another 40% submitted negative feedback through the company’s website, an increase of 4.6 percentage points from 2021.
- Email use for negative feedback increased by 9.5 percentage points compared with 2021, showing a shift toward asynchronous complaint channels.
- Consumers are 14 percentage points more likely to use surveys after a very good experience than after a very poor one. Therefore, survey-only feedback programs may overrepresent satisfied customers.
- By contrast, consumers are 21 percentage points more likely to send an email after a bad experience than after a positive one.
- Current 2026 consumer research indicates that only about 3 in 10 departing customers explain why they leave, limiting companies’ ability to diagnose churn through direct feedback alone.
- Around 30% of consumers now tell nobody about a poor experience and simply switch companies, while consumers have become 29% less likely to provide direct feedback than they were five years earlier.
- Public feedback is also becoming less dependable as a complete VoC signal. Consumers are 15% less likely to post on social media after a bad experience than they were five years ago.
Customer Experience Measurement
- Global 2025 NPS research included more than 275,000 consumers, covering 478 brands, 13 industries and 13 countries.
- NPS declined in 20 of 39 industry-country combinations measured consistently in both 2024 and 2025.
- Only three of those 39 combinations recorded an NPS increase, while 16 remained unchanged, showing that advocacy weakened much more often than it improved.
- One survey of CX managers found that 50.5% of companies use CSAT, narrowly making it the most frequently used of three major experience metrics examined.
- 49% of companies in that research used NPS, while only 9% used Customer Effort Score.
- Only 32% of companies used more than one major CX metric, suggesting many organizations still depend heavily on a single measurement perspective.
- In 2026, 82% of CX leaders say prompt-based analytics can unlock insights within seconds instead of requiring specialist analysis over longer periods.
- 87% of CX leaders say AI already improves their data and analytics capabilities, reflecting the growing use of AI in CX measurement rather than customer interactions alone.
- High-maturity organizations track automation success rates at 66% compared with 21% among low-maturity organizations, a gap of 45 percentage points that links AI maturity with more rigorous performance measurement.
- Resolution remains a critical outcome metric: when service issues go unresolved, customer satisfaction falls to 2.83, while agent understanding falls 37%, from 4.44 to 2.78.
Frequently Asked Questions (FAQs)
Nearly $3 trillion in global sales is estimated to be at risk in 2026 because 11% of customer experiences are poor and 47% of those bad experiences lead consumers to cut spending.
In 2025, 29% of U.S. consumers said they stopped buying from or using a brand because of poor online or in-person customer experience, while 52% stopped after a bad product or service experience.
In 2026, 87% of customers said companies using generative AI for customer service must provide an option to reach a human agent.
AI-agent adoption among customer service organizations reached 66% in 2026, up from 39% in 2025, an increase of about 1.7 times in one year.
Contact centers with mature AI capabilities report 85% greater profitability than organizations with low AI maturity, according to 2026 global contact-center research.
Conclusion
Customer experience statistics point to a market where customers expect connected journeys, faster resolution, and more relevant service regardless of channel. AI can help companies meet those expectations, but deployment alone does not guarantee a better experience. Businesses need to measure whether technology actually resolves problems, preserves context, and earns customer trust.
Digital behavior also makes traditional surveys less complete as a standalone source of customer insight. Customers increasingly switch quietly, begin support journeys outside company-controlled channels and use third-party AI tools to solve problems. Therefore, leading CX programs will need to combine direct feedback, behavioral signals, operational metrics and customer outcomes.
For U.S. companies in particular, the financial stakes remain substantial. The next phase of customer experience management will depend less on adding channels and more on connecting them, understanding customer intent and using AI without sacrificing transparency or human access.