
Introduction
Business Intelligence (BI) has moved from nice-to-have reporting to a core business tool. Organizations leverage BI to spot market shifts weeks ahead, automate alerts on supply‑chain risks, and tailor customer experiences in real time. In healthcare, BI helps hospitals reduce readmission rates by identifying at‑risk patients; in retail, it powers dynamic pricing engines that boost margins.
These seven statistics are essential signposts for BI:
- The global BI market is projected at USD 36.82 billion in 2025.
- From 2025 to 2033, the BI market is expected to grow at a CAGR of 14.98%.
- The 2025 business intelligence software market alone is valued at USD 47.48 billion.
- North America held roughly 30.96% of the global BI market share in 2024.
- In 2025, 82% of organizations plan to increase funding in BI and data analytics.
- Over 33% of large companies used BI in decision-making by 2023.
- BI implementations routinely report ROI of 112% and payback periods near 1.6 years.
Recent Developments
- EY’s AI‑related services revenue increased 30% in 2025, reflecting how BI capabilities are folding into broader AI strategies.
- AI-driven analytics and real-time processing are shifting BI from monthly dashboards to continuous intelligence.
- M&A in data infrastructure is surging as firms seek to integrate data pipelines with analytics; such deals now make up ~25% of tech M&A volume.
- Many BI adopters report stagnation due to low user adoption in traditional dashboards.
- In 2025, BI tools are increasingly embedded into vertical applications (e.g., ERP, CRM) rather than used standalone.
- Ethical rules, data privacy, and AI governance frameworks are becoming nonnegotiable guardrails for new BI projects.
- Increased cloud migration has caused hybrid BI architectures to proliferate, blending on‑prem and cloud layers.
Business Intelligence Market Overview
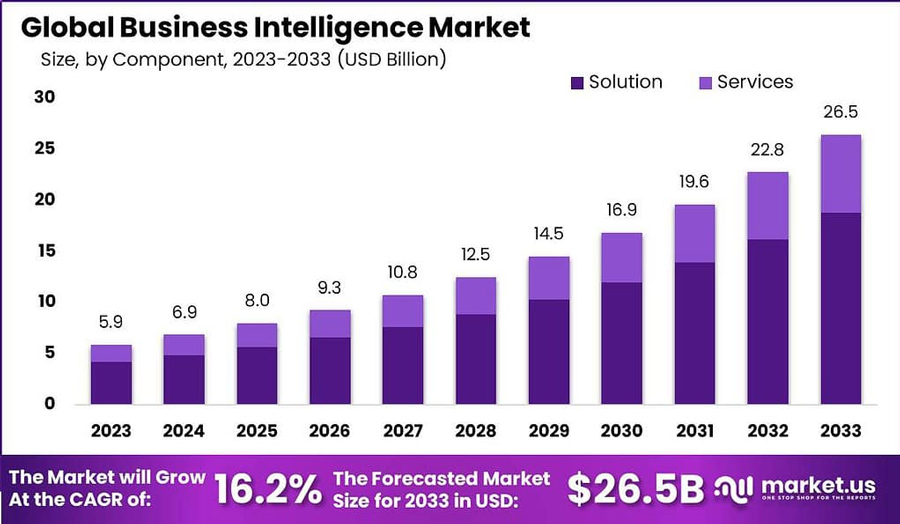
- In 2024, the global BI market was valued at USD 30.1 billion.
- The 2025 estimate is USD 36.82 billion.
- From 2025 to 2033, it’s forecast to reach USD 116.25 billion, growing at a 14.98% CAGR.
- Another forecast estimates the market at USD 63.20 billion by 2032, with an 8.9% CAGR.
- The BI software market (subset) is pegged at USD 47.48 billion in 2025, expanding to USD 151.26 billion by 2034 (CAGR 13.74%).
- In 2025–2029, the BI market is expected to add USD 18.56 billion in growth, at a CAGR of 10.7%.
- Before 2025, one forecast projected BI would reach USD 33.3 billion by 2025.
- The global BI market is heavily concentrated; the top 10 vendors hold 62.5% of the market share.
- In 2024, North America accounted for ~30.96% of the BI market.
Adoption of Business Intelligence Solutions
- By 2025, 82% of organizations intend to increase BI & analytics funding.
- In 2023, over 33% of large-sized businesses used decision intelligence practices.
- Nearly 49% of companies increased BI analytics usage compared to pre‑pandemic levels.
- In many surveys, 95% of business professionals agreed that analytics is important for future success.
- The cloud‑BI segment commanded a 53% share of the BI software space in 2024.
- Cloud‑based BI has an average deployment time of 3–4 months, versus 12–18 months for on‑premise.
- BI adoption often stalls due to usability, data preparation gaps, or poor integration with business workflows.
- Self‑service BI tools are helping business users bypass IT bottlenecks and drive broader adoption.
Business Intelligence Usage Across Industries
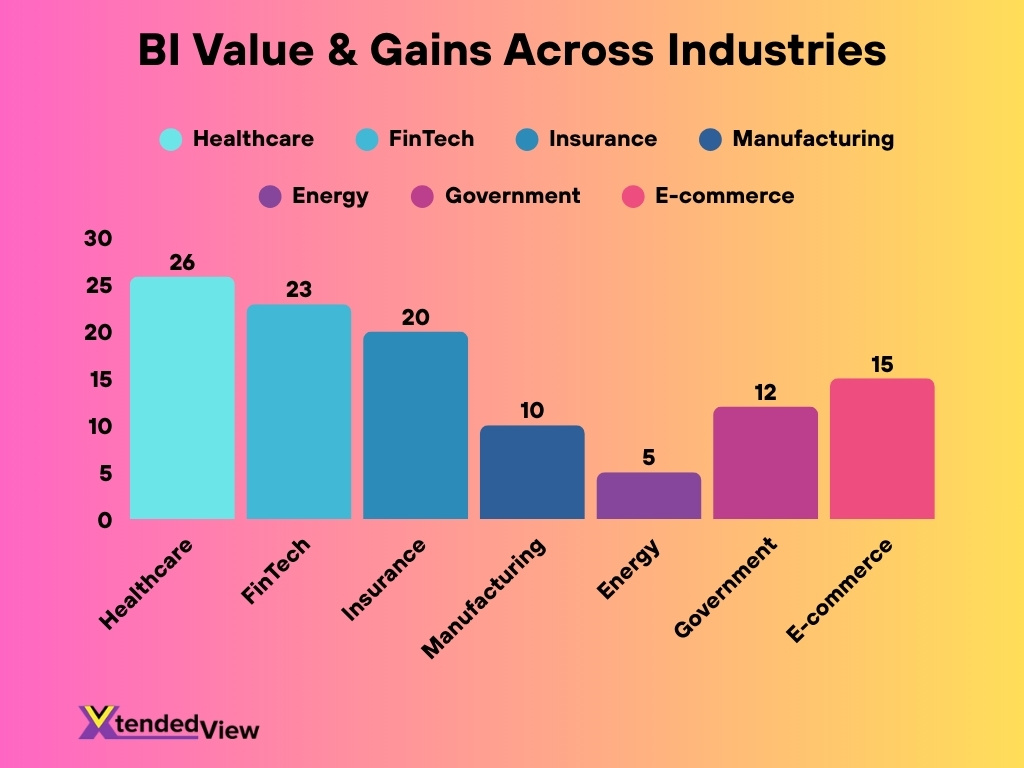
- In healthcare, BI helps forecast patient volume and reduce readmissions. Projections estimate the global healthcare BI market may hit USD 25.86 billion by 2032.
- FinTech’s analytics spend is forecast to reach USD 22.9 billion by 2031.
- The IT and telecommunications sector led BI revenue share in 2022.
- Retail uses BI for demand forecasting, inventory optimization, and customer segmentation. Many firms report double-digit uplifts in margin after adoption.
- Manufacturing firms deploy BI for predictive maintenance, reducing downtime by 10 – 20%.
- Insurance uses BI to detect fraud patterns, improving detection rates by 15–25%.
- Energy companies couple BI with IoT data to monitor equipment and optimize load balancing, achieving 5–10% efficiency gains.
- Government agencies use BI for service delivery, tax forecasting, and citizen analytics; some jurisdictions report cost reductions of 8–12%.
- In e‑commerce, BI-driven personalization can lift conversion rates by 10–15%.
Impact of Business Intelligence on Decision Making
- Companies using BI report an average ROI of 112% and a payback of 1.6 years.
- 67% of top-performing companies claim they rely on BI and analytics tools.
- BI users can cut decision cycle time by 20–40%, especially in finance and operations.
- AI‑driven BI tools bring a 25% improvement in operational efficiency over traditional methods.
- Over 70% of organizations 2025 will use real‑time analytics powered by AI, up from ~40% in 2020.
- Embedded analytics is projected to reach USD 77.52 billion by 2026.
- Nearly 93% of executives regard social media data as a key future input to BI.
- Many organizations now automate alerts and anomaly detection via BI, reducing reactive decision-making by 15–30%.
- BI maturity correlates with higher profit margins; firms in advanced BI maturity tiers often outperform peers by 5–8 percentage points in margins.
Mobile Business Intelligence Statistics
- The mobile BI market is estimated at USD 19.93 billion in 2025, growing at a CAGR of 22.8%.
- Another source places mobile BI at USD 20.1 billion in 2025.
- The market is projected to grow to USD 55.56 billion by 2030.
- The global mobile BI trajectory aligns with a CAGR of 22.5% from 2024 onward.
- In 2024, the mobile BI market was valued at USD 18.26 billion.
- Cloud deployment dominates mobile BI, representing around 74.5% of total mobile BI implementations.
- Large enterprises hold ~73.6% of the mobile BI market share.
- By 2034, the mobile BI market is forecast to reach USD 138.9 billion.
Cloud‑Based Business Intelligence Trends
- In 2025, the global cloud computing market is estimated at USD 912.77 billion.
- Over 90% of organizations now use cloud computing in some capacity.
- About 60% of organizations run more than half of their workloads in the cloud.
- Multi‑cloud adoption is common; 80% of organizations use multiple public or private clouds.
- By 2028, 25% of organizations are projected to express significant dissatisfaction with cloud initiatives.
- By 2029, 50% of cloud compute usage will be driven by AI/ML tasks.
- Traditional BI in the cloud is de-emphasized in trend surveys; real-time analytics ranks 13th and embedded analytics 16th in importance.
- Cloud-based BI tools are becoming the default in new deployments.
Artificial Intelligence and Machine Learning in BI
- AI, machine learning, and generative models are the top trends reshaping BI in 2025.
- BI vendors now embed features like natural language query (NLQ) and auto‑insight generation.
- The shift is toward augmented analytics, where AI suggests correlations, anomalies, or next‑step actions.
- Organizations increasingly rely on AI to reduce manual data prep.
- Semantic layers are becoming essential to bridge AI models and BI systems.
- Models and BI workflows are integrated so that AI-driven forecasting is built into dashboards.
- AI adoption brings challenges like model explainability, drift, and bias.
Self‑Service Analytics and Data Democratization
- The global self-service BI market was valued at USD 6.73 billion in 2024.
- It is projected to grow to USD 7.99 billion in 2025.
- From 2025 to 2032, CAGR is expected at 18.7%, reaching USD 26.54 billion.
- 32% of organizations report being very successful with self-service BI.
- Among large enterprises, ~88% report success.
- Cloud deployments dominate, with ~70% share.
- Software accounts for 62% of the self-service BI market.
- Sales & marketing use case holds ~28% of self-service analytics implementations.
Real‑Time Analytics and Embedded BI
- 60% of organizations prioritize real-time data access for decisions.
- 81% of users in analytics environments use embedded analytics.
- 47% use BI for productivity tracking, 42% for trend analytics.
- The embedded analytics market was USD 78.53 billion (2024), projected to reach USD 150.4 billion by 2030.
- 75% of software applications will embed analytics by 2025.
- Real-time BI tools like Power BI streaming datasets are common.
- Embedded analytics is used in customer-facing SaaS.
- 32% cite legacy infrastructure as the main barrier.
Data Governance, Privacy, and Security in BI
- 75.9% of organizations have implemented analytics governance policies.
- Only 20% test BI content continuously.
- 77% encounter issues or inaccuracies in BI content monthly.
- 82.8% prioritize accuracy testing for BI content.
- 95% with multiple BI environments test their content.
- 66% report negative consequences from dashboard errors.
- 52.2% plan to increase investment in BI content testing.
- ~30% certify content manually, while ~40% lack standard processes.
Data Quality Management Statistics
- 67% say they don’t fully trust the data they use.
- Only 12% believe their data quality supports AI.
- Data quality is among the top three BI trends.
- 40% cite data accuracy as their biggest challenge.
- 71% report scalability problems with legacy BI.
- Auto‑Prep systems correctly predict > 70% of data joins.
- Poor data quality costs the U.S. USD 3.1 trillion annually.
- Data quality has been a top concern for 9+ years.
- In 2025, it ranked second after data security.
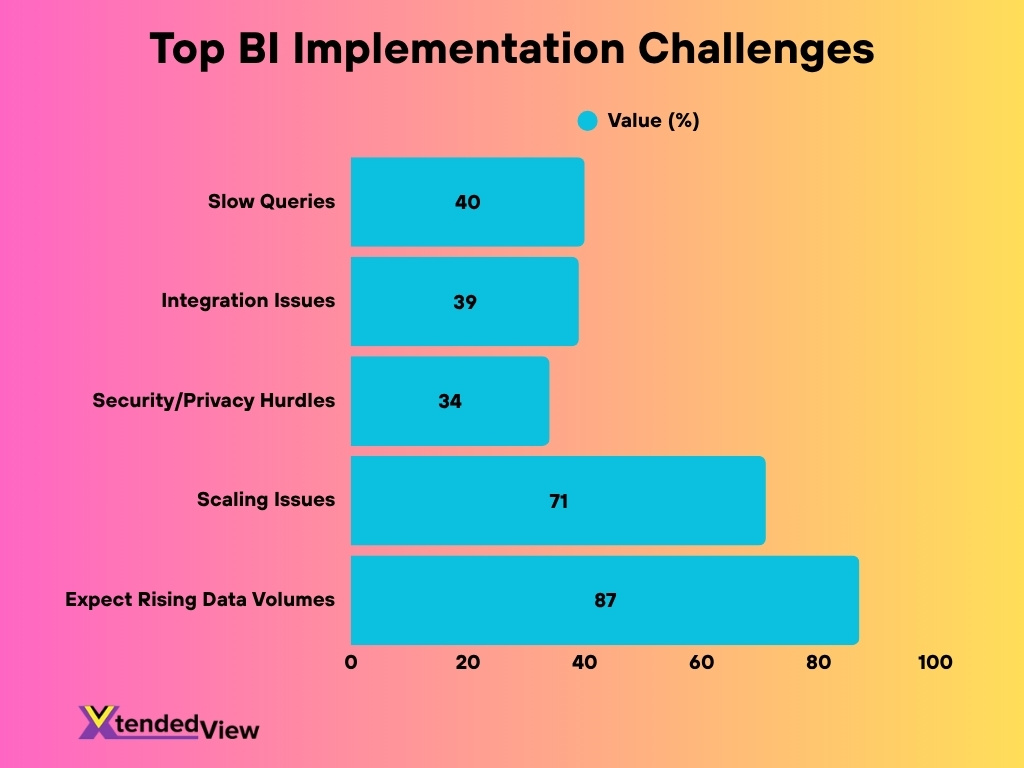
Challenges in Business Intelligence Implementation
- 40% say slow queries are their biggest challenge.
- Poor user adoption is a top failure cause.
- 39% face integration issues.
- 34% cite security and privacy hurdles.
- 71% report scaling issues with growing data.
- IT and business misalignment causes scope creep.
- Weak training and siloed teams drive failure.
- Common errors include ignoring core data sources.
- 87% expect rising data volumes, yet BI tools lag.
Career and Job Statistics in Business Intelligence
- U.S. projects 23% growth in data analyst jobs by 2032.
- Average salary rose by USD 20,000, reaching ~$111,000.
- 69.3% of jobs seek SQL, stats, and visualization skills.
- 28.1% require Tableau, 24.7% Power BI.
- Excel appears in 41.3% of job ads.
- 70% say AI boosts effectiveness, 87% say it enhances value.
- Analytics roles remain open for 45–53 days.
- The global data talent gap could hit 4.3 million by 2025.
- 59% of demand comes from finance, insurance, and IT.
Data Storytelling and Visualization in BI
- Visuals are processed 60,000× faster than text.
- AR/VR and immersive dashboards are on the rise.
- AI auto‑generates charts and flags anomalies.
- Dashboards will reflect live data changes.
- Visual challenges persist in the AI era.
- Interactive visualizations dominate BI interfaces.
- Semantic layers maintain metric consistency.
- Transparency and interpretability are key priorities.
Collaborative BI and Breaking Down Data Silos
- 68% rank data silos as a top 2025 concern.
- Firms often manage 1,000+ sources.
- 82% plan to unify data into centralized platforms.
- Only 1 in 10 execs say they’re highly connected.
- Semantic layers help link departments.
- Shared dashboards and annotations are standard.
- Guardrails guide users in shared self-service tools.
- Cross-team BI reduces duplication.
- Data catalogs help map siloed assets.
Industry-Specific BI Innovations and Use Cases
- Retail uses BI for live inventory and pricing.
- Healthcare applies BI to predict admissions.
- Finance uses BI to flag fraud with a 15–25% improvement.
- Telecoms use semantic models for KPI standardization.
- BI and IoT reduce downtime in manufacturing by 10–20%.
- Energy firms improve efficiency 5–10% with BI.
- Public agencies use BI to forecast budgets.
- BI improves route planning in logistics.
- E-commerce boosts conversion by 10–15% with personalization.
Future Trends in Business Intelligence
- Generative AI + semantic layers will power conversational BI.
- MCPs will standardize metrics across tools.
- Composable architectures will replace monoliths.
- Edge analytics will connect IoT to BI.
- Explainable AI will be mandatory in compliance-heavy sectors.
- BI will embed directly into SaaS platforms.
- Data observability tools will monitor quality and drift.
- Guardrails will enhance safe democratization.
- Immersive storytelling will expand through XR.
Frequently Asked Questions (FAQs)
The global BI market is projected to reach USD 33.3 billion by 2025.
The BI & analytics market is expected to grow at a 10.1 % CAGR through 2026.
Over 70 % of organizations will leverage real‑time analytics powered by AI by 2025, up from ~40 % in 2020.
The top 10 BI vendors hold 62.5 % of the global BI market.
Auto‑Prep systems can correctly predict over 70 % of transformation and join steps in BI workflows.
Conclusion
In 2025, BI is no longer just reporting; it’s the nerve center of strategic, real‑time action. But advanced analytics won’t unlock value on its own; clean data, governance, collaboration, and thoughtful adoption remain indispensable. Organizations that align teams, invest in data reliability, and lean into new architectures and AI will outpace rivals. Let this article be your roadmap, and I invite you to dive into the detailed parts to build a BI practice for tomorrow.