
Introduction
Black Friday and Cyber Monday have evolved into the two biggest shopping events of the year in the U.S. Cyber Monday set a new record with $13.3 billion in online sales, outpacing the $10.8 billion in online sales achieved on Black Friday.
Retailers from Amazon to Main Street use these days as focal points for revenue drives, while consumers time purchases on electronics, fashion, and gifts. In the tech sector, product launches often align with Cyber Monday to ride the surge in attention. Likewise, small retailers blend limited-time offers into both Black Friday and Cyber Week to capture both in‑store and online traffic.
Editor’s Choice
Here are seven standout statistics you should keep in mind:
- $13.3 billion: Cyber Monday 2024 U.S. online spending, a record high.
- $10.8 billion: Online sales on Black Friday 2024 in the U.S., up ~10.2 % year over year.
- Online sales growth: +11.1 % YoY, while in‑store sales declined by 5.4 %.
- Mastercard: +14.6 % growth in online Black Friday sales vs. +0.7 % in-store rise.
- 87.3 million Americans shopped online on Black Friday 2024 vs 76 million in-store.
- Mobile share: ~55 % of online Black Friday purchases were on mobile devices.
- BNPL impact: Buy Now, Pay Later added ~$686 million to online Black Friday sales (8.8 % YoY growth).
Recent Developments
- Early deals stretch the season: Many brands begin discounts weeks before Thanksgiving to reduce pressure on a single day.
- In‑store rebound within Cyber Week: Experian reports that in 2025, in-store traffic during Cyber Week may surpass online, reversing a multi‑year trend.
- Mobile dominance grows: Online Black Friday sales rose ~10.2 % over last year, and mobile now accounts for 69 % of global purchases.
- Social commerce and live shopping: Platforms like TikTok and Instagram are expected to drive more in-app checkouts and live sales in the 2025 season.
- Consumers are more skeptical: 16 % of global shoppers reportedly “rarely or do not trust” retailer offers during Black Friday, Cyber Monday.
- Electronics remain top pick: 37 % of global shoppers during Black Friday say they buy electronics.
- Gen Z & Millennials lead: Only 9 % of these demographics skip the events, while Baby Boomers show lower participation.
- Thanksgiving growth: In 2024, Thanksgiving Day online sales hit $6.1 billion, up 8.8 % year over year.
- Holiday weekend total: The weekend after Thanksgiving posted $10.9 billion in sales, a 5.8 % increase over the prior year.
Black Friday vs Cyber Monday Overview
- Primary channel: Black Friday historically blends in-store and online, while Cyber Monday is almost exclusively digital.
- Discount type: Black Friday often features doorbuster deals and limited in-store offers, Cyber Monday extends deeper discounts across categories.
- Audience behavior: Impulse shoppers gravitate to Black Friday, calculated bargain hunters wait for Cyber Monday.
- Campaign style: Black Friday deals often launch at midnight or early morning, Cyber Monday campaigns run throughout the day and night.
- Sales rhythm: Some consumers use Black Friday to test deals, then return to compare on Cyber Monday before committing.
- Overlap: Many retailers now blur the line, offering the same deals across both days as part of a “Cyber Week” push.
- Category focus: Big-ticket electronics often get doorbusters on Friday, smaller gadgets, fashion, and accessories see deeper discounts on Monday.
Total Sales: Black Friday vs Cyber Monday
- Black Friday 2024 U.S. online sales reached $10.8 billion, marking 10.2 % growth over 2023.
- In the same period, Cyber Monday sales hit $13.3 billion, up 7.3 % YoY.
- The revenue gap: Cyber Monday outpaced Black Friday online by about 23 % in 2024.
- On Black Friday, online sales rose 11.1 % while in‑store sales fell 5.4 % before inflation adjustment.
- Mastercard data: Black Friday online sales rose 14.6 % YoY, in-store up 0.7 %.
- Total holiday weekend ecommerce (Black Friday through Sunday) reached $41.1 billion, up 8.2 %.
- Globally, Black Friday’s online sales contributed to ~$74.4 billion in total online sales across all markets in 2024.
- Some sources place U.S. online sales for Black Friday at $17.5 billion, though others cite $10.8B.
- The holiday weekend sale growth was more modest at ~5.8 %.
Online vs In‑Store Shopping
- 87.3 million Americans shopped online on Black Friday 2024 vs 76 million in-store.
- On Black Friday, online sales growth was +11.1 % YoY, and in-store sales fell –5.4 %.
- Mastercard: online Black Friday sales +14.6 % YoY vs in-store +0.7 %.
- Foot traffic on Black Friday was down 3.2 % overall, with regional declines: Midwest –7 %, Northeast –2.1 %, South –3.5 %, West –3.2 %.
- Online carts exceeded in-store cart size by over 2×.
- On Cyber Monday, nearly all transactions are digital, and in‑store sales are negligible.
- Mobile share: ~55 % of Black Friday online purchases were via mobile devices.
- In the global context, mobile now accounts for ~69 % of purchases.
- Many shoppers prefer to browse in-store but complete purchases online.
Number of Shoppers and Participation Rates
- In 2025 (estimated), 183.4 million U.S. consumers are expected to shop between Thanksgiving and Cyber Monday.
- Around 87 % of people globally take part in Black Friday and Cyber Monday events.
- In 2023, over 90 million U.S. shoppers made online purchases on Black Friday.
- In a 2023 survey, 71 % of respondents planned to shop online during Black Friday or Cyber Monday.
- Among Black Friday shoppers, 46 % said they made impulse buys.
- Approximately 37 % of online shoppers on Black Friday tried a new brand.
- Three in ten shoppers (~31 %) begin holiday shopping before Black Friday.
- In the U.S., Black Friday shoppers are about 18.9 % more likely to purchase online than in-store.
- Among younger demographics (Gen Z and Millennials), only ~9 % skip Black Friday entirely.
Average Spending (Consumer, Cart, Gifts)
- Deloitte projects shoppers will spend an average of $650 during the BFCM week in 2025, up roughly 15 % year-over-year.
- In 2024, Amazon’s peak minutes reportedly hit $15.7 million per minute during Cyber Monday.
- On Black Friday 2024, peak hourly online spending reached $11.3 million per minute between 10 a.m. and 2 p.m.
- Average spend per American shopper on Black Friday in 2024 ranged between $400–$674.
- U.S. total Black Friday retail revenue (online + offline) was estimated at $20 billion.
- 58 % of consumers placed items in their cart ahead of BFCM events.
- 31.1 % of Americans said they planned to spend more during Black Friday than the prior year.
- 49.3 % expected to spend about the same amount.
- 45 % of consumers saw higher prices before discounts.
Mobile Shopping and Device Usage
- Globally, 69 % of Black Friday purchases occurred on mobile devices in 2024.
- U.S. mobile share estimated at 55 %.
- On Cyber Monday 2024, $991.2 million in purchases were made via BNPL, 75.2 % of which were on mobile devices.
- Mobile app downloads for major retailers rose by ~35 % during November.
- 68 % of shoppers research on a desktop before purchasing via mobile.
- 78 % of consumers cite convenience as the top reason for using mobile shopping.
- Shopify merchants report mobile-first traffic, especially from social media.
- Mobile site performance is critical to avoid abandonment.
- Mobile commerce is growing faster than desktop globally.
Top Product Categories
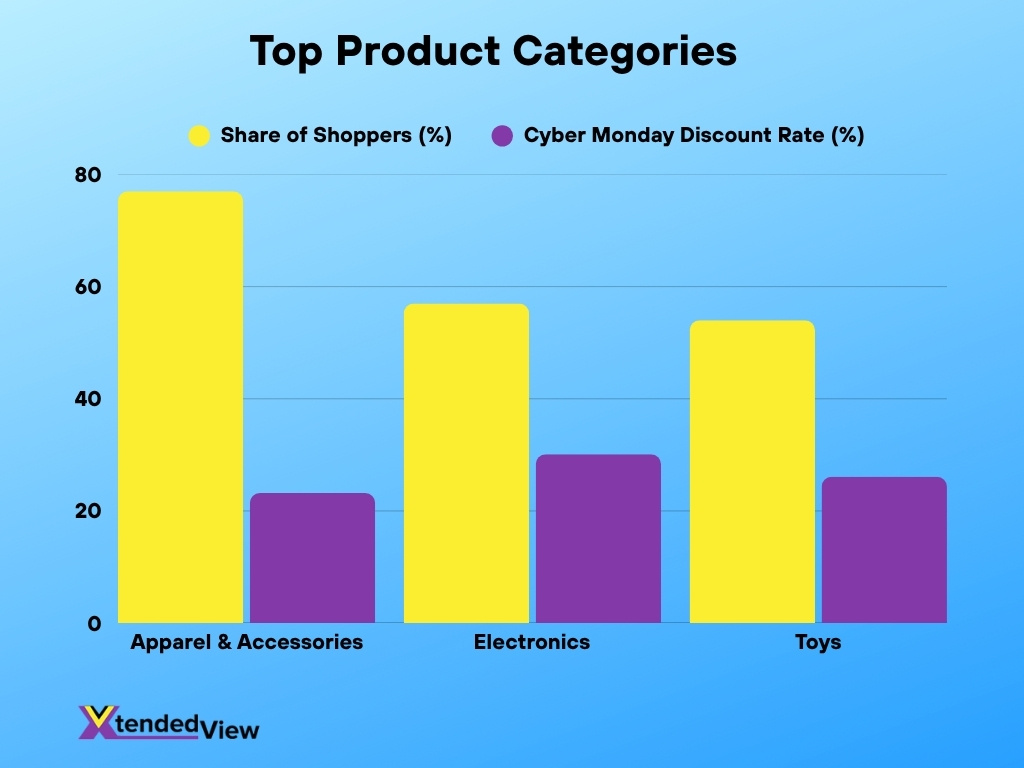
- Apparel & accessories (77%), electronics (57%), and toys (54%) were most shopped in BFCM.
- Cyber Monday discounts: electronics 30.1%, toys 26.1%, apparel 23.2%.
- BNPL is popular in fashion, lifestyle, and electronics.
- Top categories included fashion, beauty, personal care, and household supplies.
- Mobile devices and tech gear remained heavily discounted.
- Home goods and appliances featured prominently in early deals.
- Gift cards, small electronics, and fashion accessories surged in last-minute sales.
- Beauty and home décor led social commerce activity.
Discount Rates and Best Deals
- Cyber Monday 2024 discounts: electronics — 30.1 % off, toys — 26.1 %, apparel — 23.2 %.
- Average discount ranges: 25–28% during BFCM.
- Doorbuster deals often offered 50%+ off early in the day.
- Discounts increased late on Cyber Monday to clear inventory.
- Premium brand discounts mostly ranged 15–25 %.
- Dynamic pricing was used in real-time to adjust based on demand.
- Free shipping and extra discount codes were widely offered.
- Bundles and upsell tactics helped retain order values.
- Some restrictions applied to high-demand or new products.
Buy Now, Pay Later (BNPL) Usage Stats
- BNPL made up $686.3 million in online Black Friday sales, up 8.8 % YoY.
- Cyber Monday BNPL spending reached $991.2 million.
- ~40% of Millennials and Gen Z planned to use BNPL during BFCM.
- BNPL less common among Gen X and Boomers.
- 75.2 % of Cyber Monday BNPL was done via mobile.
- Retailers offering BNPL saw higher conversion rates.
- BNPL helped reduce friction in checkout flows.
- Some users struggled with tracking multiple plans.
- More brands now advertise BNPL early in the funnel.
Amazon, Shopify, and Major Retailer Data
- Cyber Monday U.S. online sales totaled $13.3 billion, slightly exceeding projections.
- Black Friday U.S. online sales reported between $10.8B and $17.5B depending on the source.
- Shopify merchants recorded record order volumes during BFCM.
- TikTok Shop made $100 million in sales on Black Friday via livestreams.
- Amazon dominated volume, especially in electronics and toys.
- Walmart and Target saw strong omnichannel performance.
- Different analytics platforms vary on sales figures.
- AI-powered tools improved upsell and personalization results.
- Loyalty programs boosted average order value for small-to-mid merchants.
Demographics: Who Shops on Each Day?
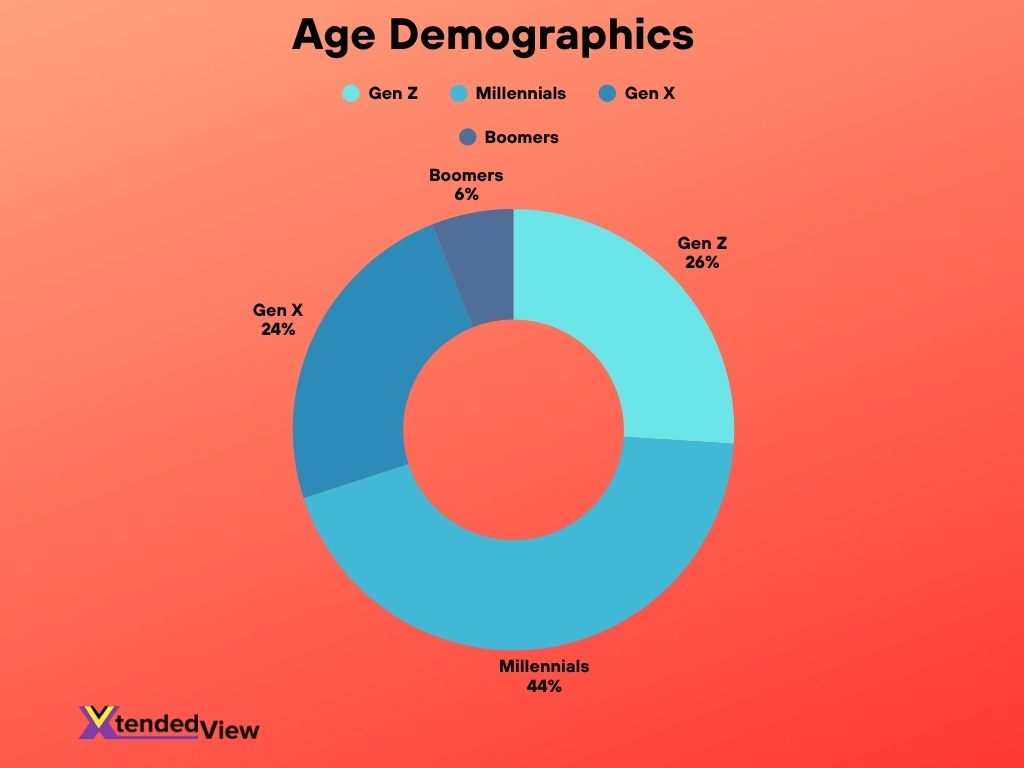
- 26 % Gen Z, 44 % Millennials, 24 % Gen X, 6 % Boomers participated in BFCM 2024.
- 84 % of Millennials shopped online on Black Friday vs 77 % on Cyber Monday.
- Up to 33% of Boomers opted out of shopping.
- Men were slightly more likely to reduce spending due to job fears.
- Higher-income households (≥ $150,000) were more likely to spend $1,000+.
- Those earning $100K–$149K leaned toward in‑store shopping.
- Gen Z and Millennials favored BNPL and mobile-first platforms.
- More women than men planned to reduce holiday spending.
- 20% expected to spend over $1,000 during BFCM.
Consumer Shopping Behaviors
- Shoppers often check deals before the weekend and buy during peak times.
- 74.9% said price was the top influence in BFCM shopping.
- 48% of consumers saved money in advance to spend on Black Friday.
- 27.12% of Gen Z always make impulse buys, compared to 7.14% of Boomers.
- Shoppers blend in-store and mobile to finalize purchases.
- Many hold out until Cyber Monday for deeper discounts.
- Cyber Monday saw $15.8 million per minute in peak hour sales.
- Economic pressures made deal-hunting more popular.
- Engagement with email and digital ads spiked.
- 97% of Americans are aware of BFCM and expect deals.
Trends in Marketing and Promotions
- Brands now stretch promotions across November.
- AI-powered chatbots increased site traffic by 1,800%.
- AI chatbot use raised conversions by up to 9%.
- Email and SMS promos surged, with 192% YoY growth in digital activity.
- Social commerce (e.g., TikTok Shop) hit $100 million on Black Friday.
- Stackable discounts and bundles encouraged larger orders.
- Limited-time and flash deals created urgency.
- Over 51% chose climate-smart delivery when offered.
- Recommendation engines boosted relevance and personalization.
- AR/VR tools helped shoppers engage with products interactively.
Differences in Shopping Experience
- In-store allows physical touch, instant gratification, and impulse buys.
- Online offers speed, convenience, a broader selection, and flexibility.
- Mobile site performance is critical to success.
- AI assistants guide decisions and reduce bounce.
- AR is being used to simulate product experiences.
- Online checkout must be simple and offer varied payment options.
- In-store events draw traffic and create brand experiences.
- Click-and-collect options blend online ease and in-person pickup.
- Online orders have higher return rates, making logistics key.
- Personal service in stores offers a unique engagement layer.
Impact on Small Businesses
- Shopify merchants made $11.5 billion globally during BFCM, up 24% YoY.
- Over 67,000 Shopify sellers had record sales.
- Small brands leveraged influencers and niche value.
- Poor logistics or stockouts can hurt smaller players.
- Some small brands depend heavily on BFCM for annual revenue.
- Dynamic pricing tools helped smaller retailers stay agile.
- DTC and cross-border sellers saw growth without intermediaries.
- Focus shifted toward retention vs big ad spend.
- Fulfillment and returns are often challenges at scale.
- BFCM visibility helps small brands gain new long-term customers.
Global vs US Shopping Patterns
- Global Black Friday online sales hit $74.4 billion in 2024.
- U.S. Black Friday online sales reached $10.8 billion.
- U.S. Cyber Monday hit $13.3 billion in online revenue.
- U.S. shoppers split spending between both days; globally, one-day dominance is more common.
- Shopify merchants saw balanced global performance.
- Mobile commerce outpaces desktop globally, especially in Asia/LatAm.
- Other countries may have equivalent events (e.g., Singles’ Day in China).
- Cross-border challenges like duties affect sales outside the U.S.
- Inflation and currency impact discounts in global markets.
- Localization and logistics matter more in global eCommerce strategy.
Frequently Asked Questions (FAQs)
Online sales reached $13.3 billion, up 7.3 % year over year.
U.S. online Black Friday sales were $10.8 billion, rising ~10.2 % year over year.
In 2024, 57 % of Cyber Monday sales came via smartphones, and BNPL added $991.2 million in transactions.
Online sales grew 11.1 %, while in‑store sales declined 5.4 % (unadjusted for inflation).
Around 183.4 million Americans are projected to shop across that period.
Conclusion
Black Friday and Cyber Monday continue to reshape retail rhythms. The data from recent years show that online and mobile channels dominate, consumers act strategically, and technology (AI, personalization, BNPL) plays a bigger role than ever. Small businesses and global brands alike navigate tradeoffs around inventory, marketing timing, and customer experience. As we head into 2025, the battle for holiday dollars will revolve less around who shouts the biggest discount and more around who delivers the right offer, at the right moment, in the right way.