
Black Friday and Cyber Monday continue to shape the global retail calendar, influencing everything from holiday inventory planning to digital marketing budgets. Retailers use these events to accelerate year-end revenue, while consumers rely on them to secure discounts on electronics, apparel, home goods, and seasonal gifts. As online shopping, mobile commerce, AI-driven recommendations, and flexible payment options gain momentum, the distinction between the two shopping events continues to evolve. Explore the latest statistics to understand how Black Friday and Cyber Monday compare in sales performance, consumer behavior, and retail impact.
Editor’s Choice
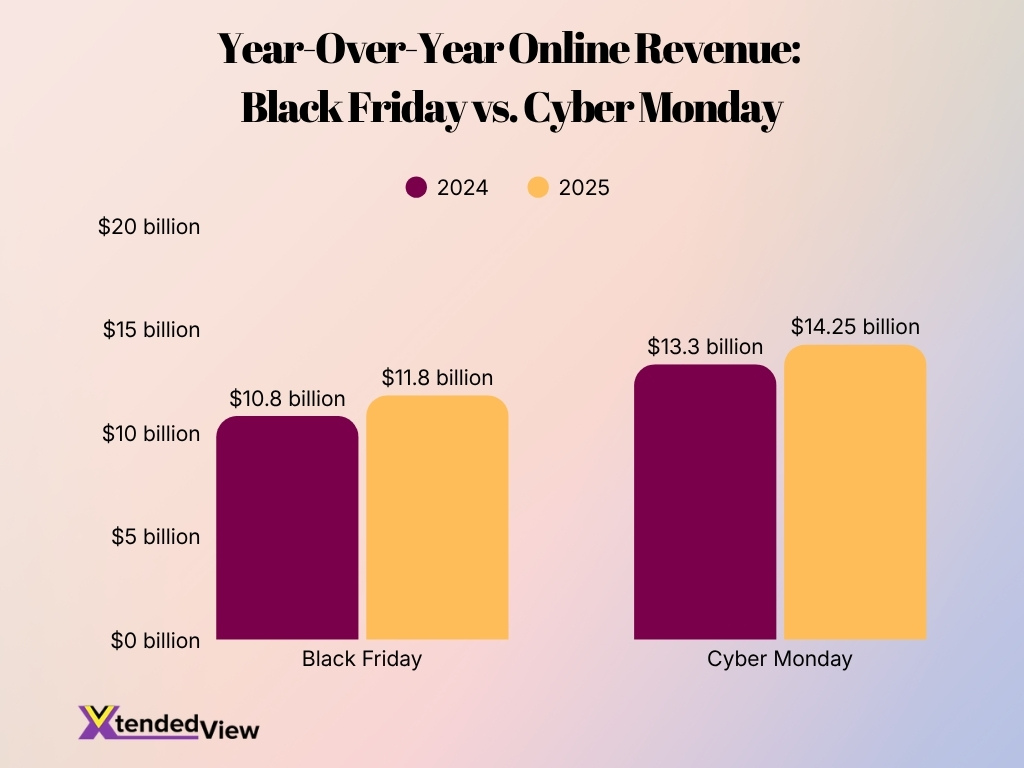
- Cyber Monday 2025 generated $14.25 billion in U.S. online sales, making it the largest online shopping day of the year and growing 7.1% year over year.
- Black Friday 2025 reached a record $11.8 billion in online sales, up 9.1% from the previous year.
- Cyber Week 2025 produced $44.2 billion in total online spending, representing 7.7% annual growth.
- During Cyber Monday 2025, shoppers spent $16 million per minute between 8 p.m. and 10 p.m. EST.
- Cyber Monday sales exceeded Black Friday sales by approximately $2.45 billion in 2025.
- Smartphones accounted for 57.5% of Cyber Monday online sales in 2025.
- More than 202.9 million shoppers participated across the five-day Cyber Week period in 2025.
Recent Developments
- U.S. holiday online spending reached a record $257.8 billion during the 2025 holiday season, up 6.8% year over year.
- Retailers increasingly launched promotions before Thanksgiving, reducing dependence on a single shopping day.
- AI-driven traffic to retail websites surged by 670% year over year during Cyber Monday 2025.
- Black Friday online revenue grew faster than Cyber Monday revenue in 2025, posting 9.1% growth versus 7.1%.
- Ten separate days generated more than $5 billion in online sales during the 2025 holiday season.
- Retailers increasingly adopted AI-powered shopping assistants to improve product discovery and personalization.
- Mobile commerce continued gaining share, becoming the dominant shopping channel during Cyber Week.
- BNPL spending surpassed $1 billion on Cyber Monday 2025, highlighting growing consumer demand for flexible payments.
- Global AI-influenced online purchases reached $9.3 billion during Cyber Week 2025.
Black Friday vs Cyber Monday: Total Sales and Revenue Statistics
- Cyber Monday 2025 generated $14.25 billion in U.S. online sales revenue.
- Black Friday 2025 generated $11.8 billion in U.S. online sales revenue.
- Cyber Monday revenue exceeded Black Friday revenue by 20.8% in 2025.
- Black Friday online sales increased 9.1% year over year in 2025.
- Cyber Monday online sales increased 7.1% year over year in 2025.
- Cyber Week generated $44.2 billion in online revenue during 2025.
- Black Friday 2024 online sales reached approximately $10.8 billion.
- Cyber Monday 2024 sales were approximately $13.3 billion, based on 2025 growth rates.
- Combined Black Friday and Cyber Monday online sales exceeded $26 billion in 2025.
Black Friday vs Cyber Monday: Which Shopping Event is Bigger?
- Cyber Monday remained the largest online shopping day in the United States during 2025.
- Cyber Monday generated $2.45 billion more revenue than Black Friday in 2025.
- Black Friday recorded stronger annual growth, rising 9.1%, compared with Cyber Monday’s 7.1%.
- Black Friday remains larger when combining both online and physical store activity.
- Cyber Monday remains exclusively digital, concentrating more spending into online channels.
- Cyber Monday was identified as the biggest e-commerce day of the entire 2025 holiday season.
- Black Friday’s online sales reached a record level for the fourth consecutive year in 2025.
- Retailers increasingly treat both events as part of a broader Cyber Week strategy rather than isolated shopping days.
- Consumer participation across Cyber Week reached 202.9 million shoppers, showing that both events continue to attract massive audiences.
Black Friday vs Cyber Monday Online vs In-Store Traffic Statistics
- Black Friday 2025 hit a record $11.8 billion in online sales, marking a 9.1% increase from last year.
- Cyber Monday 2025 generated $14.25 billion in digital revenue, up 7.1% year-over-year.
- Physical in-store foot traffic on Black Friday declined by 3.6% as more shoppers shifted to digital channels.
- Over 87.3 million people shopped online on Black Friday compared to 81.7 million in-store visitors.
- Mobile devices dominated Cyber Monday, driving 57.5% of all sales for a total of $8.2 billion.
- A massive 75.9 million consumers made online purchases strictly during the Cyber Monday event.
- Total digital spending across the entire five-day Cyber Week reached a staggering $44.2 billion.
- Buy Now, Pay Later adoption surged, driving $1.03 billion in Cyber Monday online spending alone.
- Artificial intelligence shopping assistants directly influenced $3 billion in digital sales during Black Friday.
Black Friday vs Cyber Monday Shopping Preferences Statistics
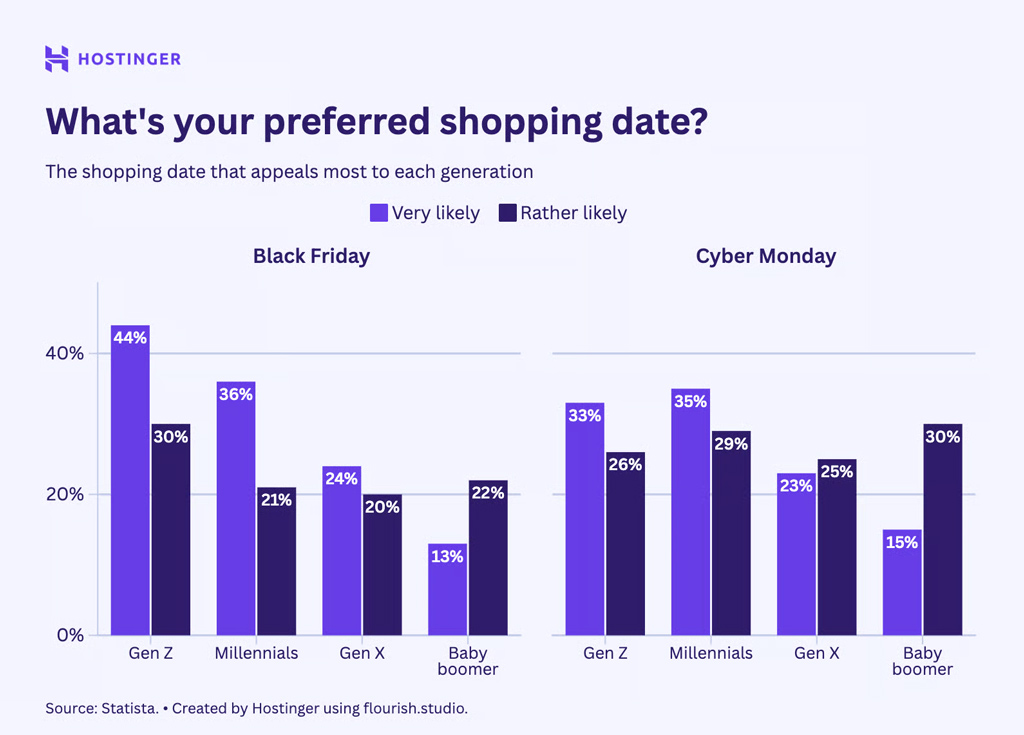
- Gen Z shows the strongest Black Friday interest, with 44% very likely and 30% rather likely to shop.
- Millennials are highly engaged in both events, with 36% very likely for Black Friday and 35% for Cyber Monday.
- Gen X displays similar interest levels, with 24% very likely for Black Friday and 23% for Cyber Monday.
- Baby Boomers prefer Cyber Monday, with 30% rather likely compared to 22% for Black Friday.
- Black Friday attracts more very likely shoppers among Gen Z (44%) than any other generation.
- Cyber Monday records its highest very likely participation among Millennials (35%).
- Baby Boomers have the lowest very likely Black Friday interest at just 13%.
- Rather likely that Cyber Monday participation peaks among Baby Boomers, reaching 30%.
- Gen Z is 11 percentage points more likely to prefer Black Friday (44%) over Cyber Monday (33%).
- Millennials show the most balanced shopping behavior, with only a 1-point difference between Black Friday (36%) and Cyber Monday (35%).
Mobile vs Desktop Shopping Statistics for Black Friday and Cyber Monday
- Smartphones accounted for 57.5% of Cyber Monday online sales in 2025, marking the highest mobile share recorded for the event.
- Mobile devices generated 55.5% of Black Friday online sales in 2025, up from approximately 54.3% in 2024.
- Consumers spent more than $8.2 billion via smartphones on Cyber Monday 2025.
- Mobile shopping revenue on Black Friday 2025 exceeded $6.5 billion, setting a new record.
- Desktop users continued to deliver higher average order values despite lower traffic volumes.
- During Cyber Week 2025, mobile traffic represented nearly 74% of retail website visits.
- Desktop traffic contributed approximately 26% of visits during Cyber Week 2025.
- Mobile conversion rates remained lower than desktop conversion rates despite generating most retail traffic.
- Electronics shoppers showed a stronger preference for desktop purchases due to product comparison behavior.
- Mobile wallet adoption continued to rise, helping reduce checkout friction during both shopping events.
Average Consumer Spending Statistics: Black Friday vs Cyber Monday
- Average Black Friday spending per shopper reached approximately $390 in 2025.
- Cyber Monday shoppers spent an average of $330 to $350 per person exclusively online.
- The average consumer planned to spend roughly $902 on holiday gifts and seasonal purchases in 2025.
- More than 55% of consumers increased their overall holiday budgets due to anticipated discounts.
- Gen Z shoppers allocated over 70% of their total holiday budgets to online purchases.
- Households earning above $100,000 annually spent nearly 200% more during Cyber Week than lower-income households.
- Electronics orders generated the highest average value at $215 per transaction across both shopping days.
- Consumers utilizing Buy Now, Pay Later services recorded 20% higher basket values than standard shoppers.
- Nearly 68% of shoppers divided their total spending evenly across both Black Friday and Cyber Monday.
Average Discount Rates: Black Friday vs Cyber Monday Statistics
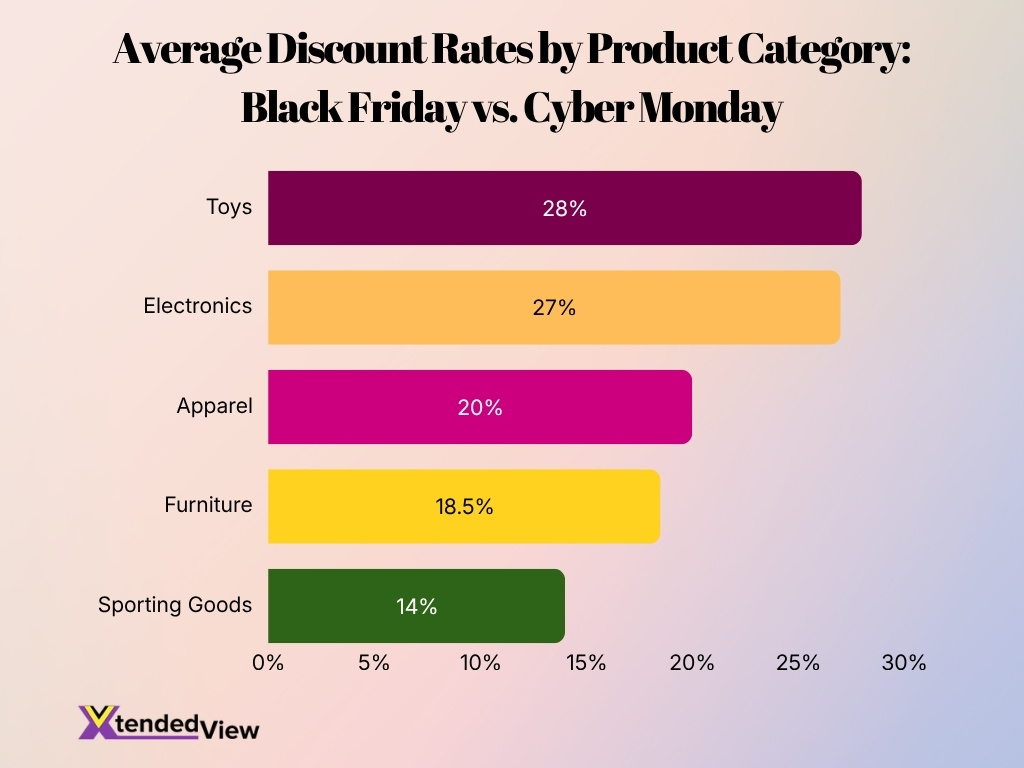
- Electronics discounts averaged between 24% and 30% during Black Friday 2025.
- Toys recorded average discounts of approximately 28% during Cyber Week 2025.
- Apparel discounts frequently exceeded 20% during both shopping events.
- Furniture discounts averaged between 15% and 22% across major online retailers.
- Sporting goods promotions averaged roughly 10% to 18% during Cyber Week.
- Black Friday generally offered deeper discounts on physical products than Cyber Monday.
- Cyber Monday often provided stronger discounts on software, subscriptions, and digital services.
- Retailers increasingly extended discounts throughout November, reducing the gap between Black Friday and Cyber Monday pricing.
- More than 80% of major retailers launched promotions before Thanksgiving in 2025.
- Dynamic pricing technologies helped retailers adjust discounts in real time based on demand patterns.
Top-Selling Product Categories: Black Friday vs Cyber Monday Statistics
- Electronics dominated Cyber Monday 2025, driving $3.7 billion in online spend with a 12.8% year-over-year increase.
- Smart TVs recorded competitive Black Friday discounts averaging 23% off listed prices, maintaining their status as top-purchased items.
- Video game consoles experienced a massive 1,800% surge in online demand during the peak hours of Cyber Monday 2025.
- Computers and laptops ranked among the highest-grossing categories, benefiting from 23% discounts and a 1,200% sales spike.
- Toys generated strong holiday growth with 27% average markdowns, contributing $8.8 billion to overall seasonal online sales.
- Apparel consistently ranked as a top-five category, securing $2.6 billion in Cyber Monday sales, reflecting a 5.2% growth.
- Cosmetics and personal care products posted above-average growth, rising 9.3% year-over-year to reach $8.4 billion in spending.
- Home appliances benefited from aggressive retail promotions, with refrigerators seeing a staggering 1,700% increase in Cyber Monday demand.
- Sporting goods and fitness equipment maintained strong online demand, recording a 7.7% year-over-year growth, yielding $8.4 billion in sales.
- AI-enabled consumer electronics and shopping tools emerged as a major trend, with AI retail site traffic skyrocketing by 693.4% in 2025.
Peak Shopping Hours: Black Friday vs Cyber Monday Statistics
- Cyber Monday’s highest spending period occurred between 8 p.m. and 10 p.m. EST, generating roughly $16 million per minute.
- Black Friday generated $11.7 billion in online sales, experiencing its strongest activity during evening hours.
- Mobile traffic peaked during lunch and evening periods, accounting for a record 57.5% of all digital sales.
- Cyber Monday conversion rates typically increased by 15% during the afternoon and evening hours.
- Retail websites experienced traffic spikes of up to 30% immediately after promotional email campaigns were sent.
- Black Friday online traffic surged by 25% shortly after midnight as shoppers searched for limited-time deals.
- Peak shopping windows became longer in 2025, driving a record $14.25 billion in total Cyber Monday sales.
- More than 50% of Cyber Monday purchases occurred outside traditional business hours.
- Mobile app usage increased by 35% during evening shopping sessions across major retail platforms.
- AI-powered product recommendations contributed to a 693% increase in referral traffic during peak periods.
Black Friday and Cyber Monday Shopping Participation Statistics
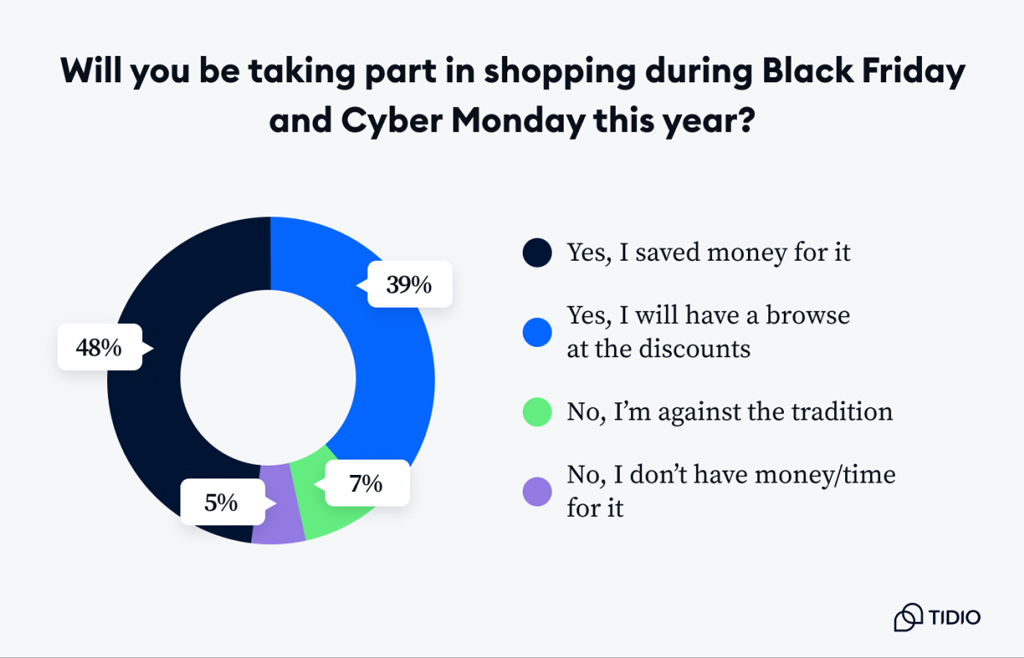
- 48% of respondents said they saved money specifically for Black Friday and Cyber Monday shopping.
- 39% plan to browse discounts and deals, showing strong interest in seasonal promotions.
- Only 7% said they are against the Black Friday and Cyber Monday tradition.
- Just 5% reported they lack the money or time to participate in the shopping events.
- A combined 87% of consumers intend to engage with Black Friday and Cyber Monday sales in some form.
- Consumers who actively budget for sales (48%) outnumber casual browsers (39%) by 9 percentage points.
- Less than 12% of respondents expressed negative or practical reasons for skipping the events.
- The data highlights strong consumer enthusiasm, with nearly 9 in 10 shoppers planning to participate.
Buy Now, Pay Later (BNPL) Usage Statistics on Black Friday and Cyber Monday
- BNPL spending on Cyber Monday 2025 exceeded $1 billion for the first time.
- Consumers used BNPL for approximately 8% of all online orders during Cyber Week 2025.
- BNPL orders increased more than 10% year over year during Cyber Week 2025.
- Average order values for BNPL purchases were higher than standard credit card transactions.
- Younger shoppers accounted for the largest share of BNPL adoption during Black Friday and Cyber Monday.
- Fashion, electronics, and furniture were among the most common BNPL categories.
- Nearly one-third of Gen Z shoppers reported using installment payment options during holiday shopping.
- Retailers offering BNPL options reported higher checkout completion rates than those without installment plans.
- Flexible payment methods became a major factor in managing inflation-related budget pressures.
- Analysts expect BNPL holiday spending to continue growing through 2026 as more merchants integrate installment solutions.
Cart Abandonment and Conversion Rate Statistics for Cyber Week
- Global cart abandonment averaged 70% during Cyber Week 2025.
- Mobile cart abandonment reached 85%, significantly outpacing desktop abandonment at 73%.
- Unexpected shipping costs caused 48% of consumers to abandon their carts midway.
- Cyber Monday conversions peaked at 6.1%, outperforming the 4.2% holiday average.
- One-click checkout reduced abandonment rates by 22% for participating retailers.
- Buy Now, Pay Later options reduced checkout abandonment among young consumers by 15%.
- Retargeting campaigns successfully recovered 8% to 12% of abandoned carts during the promotions.
- Returning visitors converted at 4.8%, exactly double the 2.4% rate of first-time shoppers.
- Personalized recommendations drove a 10% measurable reduction in overall cart abandonment.
- Mobile app users completed checkouts at a 54% higher rate than mobile web users.
Thanksgiving Weekend Shopping Trends Statistics
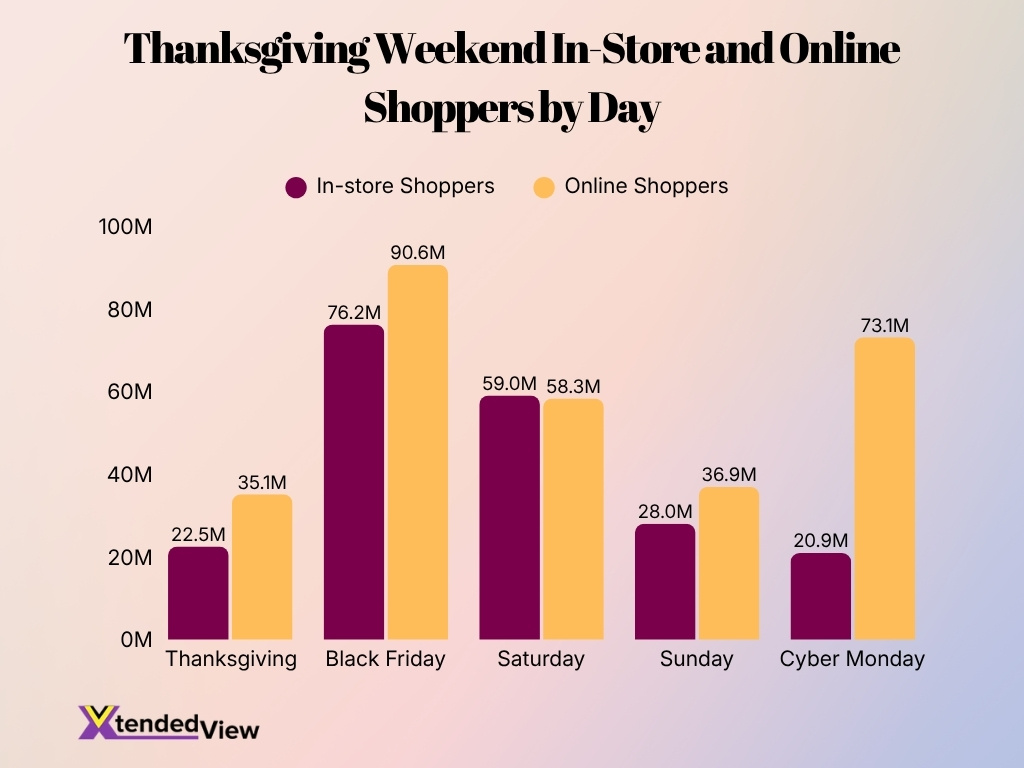
- Black Friday recorded the highest shopper traffic with 76.2 million in-store and 90.6 million online shoppers.
- Cyber Monday dominated digital commerce, attracting 73.1 million online shoppers versus 20.9 million in-store shoppers.
- Online shopping exceeded in-store shopping on 4 out of 5 days during the Thanksgiving weekend period.
- Thanksgiving Day saw 35.1 million online shoppers, significantly higher than the 22.5 million in-store shoppers.
- Saturday was the most balanced shopping day, with 59.0 million in-store and 58.3 million online shoppers.
- Sunday attracted 36.9 million online shoppers, compared to 28.0 million shoppers in stores.
- Black Friday online traffic surpassed in-store traffic by 14.4 million shoppers.
- Cyber Monday had the largest online shopping advantage, exceeding in-store traffic by 52.2 million shoppers.
- Thanksgiving weekend consumers consistently favored online shopping, highlighting the continued shift toward digital retail.
- Black Friday and Cyber Monday together generated over 163.7 million online shopping visits, the highest of any weekend shopping days.
Historical Year-Over-Year Growth Statistics for Black Friday and Cyber Monday
- Black Friday online sales grew from approximately $7.4 billion in 2019 to $11.8 billion in 2025.
- Cyber Monday online sales increased from approximately $9.4 billion in 2019 to $14.25 billion in 2025.
- Black Friday 2025 online revenue increased 9.1% year over year.
- Cyber Monday 2025 online revenue increased 7.1% year over year.
- Cyber Week online spending exceeded $44 billion in 2025, compared with roughly $29 billion in 2019.
- Mobile commerce’s share of Cyber Week revenue grew from less than 40% in 2019 to more than 55% in 2025.
- Pandemic-era shopping behavior accelerated long-term e-commerce adoption across all demographics.
- Online holiday spending has recorded annual growth in nearly every year since 2010.
- Cyber Monday has remained the largest online shopping day in the United States for over a decade.
- Retailers now distribute promotions across longer periods than they did five years ago, reducing reliance on a single sales day.
Black Friday vs Cyber Monday E-commerce Conversion Rate Statistics
- Average Cyber Monday conversion rates typically range between 4% and 6%.
- Black Friday conversion rates generally range between 3.5% and 5.5% across major retail sectors.
- Desktop conversion rates at 3.9% remain significantly higher than the 1.8% mobile conversion rates.
- Returning customers convert at up to 2.5 times higher rates than first-time visitors during both shopping events.
- Email marketing campaigns continue to generate Cyber Week conversion rates exceeding 4.2% across digital channels.
- Personalized recommendations can improve overall conversion rates by up to 15% during major shopping periods.
- Improving page-loading speeds by just 1 second correlates directly with up to a 5.9% increase in conversion performance.
- Apparel retailers typically achieve lower conversion rates of around 2% compared to electronics retailers at 3.2%.
- Loyalty program users consistently convert at 60% higher rates than non-members during the Cyber Week rush.
- AI-powered product discovery tools make shoppers 38% more likely to convert directly into paying customers.
Global Black Friday vs Cyber Monday Statistics
- Global online sales during Cyber Week reached $315 billion, representing a 6% year-over-year increase.
- Mobile devices accounted for a dominant 54.5% of all global e-commerce sales during Cyber Week.
- Global e-commerce sales experienced a 36% year-over-year increase over the 2025 Black Friday weekend.
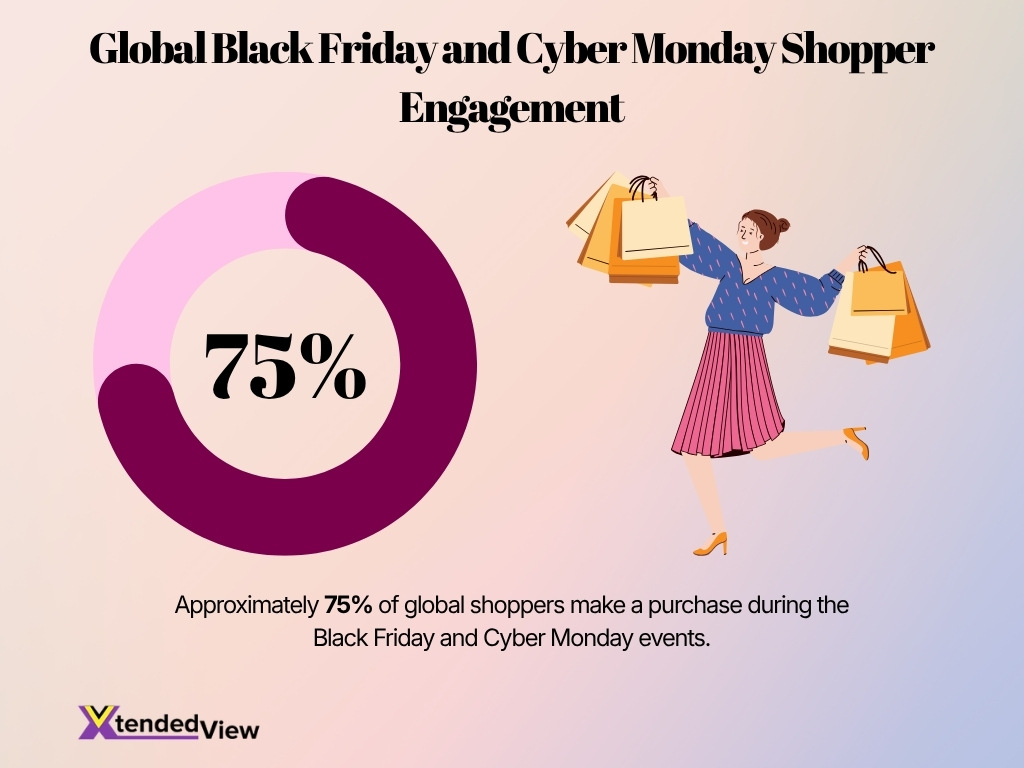
- Approximately 75% of global shoppers make a purchase during the Black Friday and Cyber Monday events.
- In the United Kingdom, total spending for the Black Friday weekend surged to £3.8 billion.
- The Asia-Pacific region recorded a notable 21% year-over-year uplift in weekend sales during 2025.
- Shoppers globally spent $14.25 billion on Cyber Monday 2025, making it the biggest online shopping day.
- Electronics drove significant global spending by accounting for $50.8 billion in overall holiday sales.
- Black Friday accounted for 31% of total weekend sales while Cyber Monday represented 22% of activity.
AI-Driven Shopping and Personalization Statistics
- AI-generated traffic to retail websites increased by 670% year over year during Cyber Monday 2025.
- AI-assisted shopping journeys influenced $13.5 billion in online purchases during Cyber Week 2025.
- Personalized product recommendations account for up to 35% of total ecommerce revenue at major retailers.
- Brands utilizing AI-driven dynamic pricing report a 13% increase in average order value during peak shopping periods.
- Nearly two-thirds of consumers (64%) plan to actively use AI chatbots for their online shopping throughout 2026.
- Retailers successfully scaling AI-led personalization observe profit margin boosts of up to 15%.
- Generative AI-powered shopping tools and assistants are forecast to influence over $73 billion in global online sales.
- Approximately 80% of retail organizations are currently using or actively piloting generative AI technologies.
- The global artificial intelligence in ecommerce market is officially projected to reach $74 billion by 2034.
Projected Future Sales Statistics for Black Friday and Cyber Monday
- Global Cyber Week sales are projected to exceed $336.6 billion with a 7% year-over-year growth.
- Cyber Monday online spending is expected to surpass $14.25 billion in the upcoming shopping cycles.
- U.S. Black Friday online sales are forecasted to reach up to $11.9 billion by 2025.
- Mobile commerce is expected to account for nearly 60% of global e-commerce sales by 2026.
- Buy Now, Pay Later (BNPL) transactions during Cyber Monday are projected to surpass $1.03 billion.
- AI-driven personalization is expected to increase mobile conversion rates by 10% to 15% during holiday sales.
- Social commerce is projected to account for over 20% of mobile commerce sales by 2026.
- AI-powered customer service agents are estimated to add a $60 billion boost to overall holiday sales.
Frequently Asked Questions (FAQs)
Cyber Monday 2025 generated a record $14.25 billion in U.S. online sales, making it the biggest online shopping day of the year.
U.S. shoppers spent $11.8 billion online on Black Friday 2025, up 9.1% year over year.
The five-day Cyber Week period generated a record $44.2 billion in online sales, representing 7.7% annual growth.
Mobile devices accounted for approximately 57.5% of Cyber Monday online sales, with shoppers spending more than $8.2 billion via smartphones.
A record 202.9 million consumers shopped online or in stores during the Thanksgiving-to-Cyber Monday shopping weekend in 2025.
Conclusion
Black Friday and Cyber Monday continue to evolve from isolated shopping events into a broader digital commerce season. While Cyber Monday remains the largest online shopping day, Black Friday continues to drive substantial online and in-store spending. Mobile commerce, AI-powered personalization, and Buy Now, Pay Later services now play central roles in shaping consumer behavior.
Looking ahead, retailers that invest in seamless omnichannel experiences, personalized recommendations, and flexible payment solutions will likely capture a larger share of holiday spending. As approaches, both shopping events remain essential benchmarks for measuring consumer confidence, ecommerce growth, and retail innovation.