


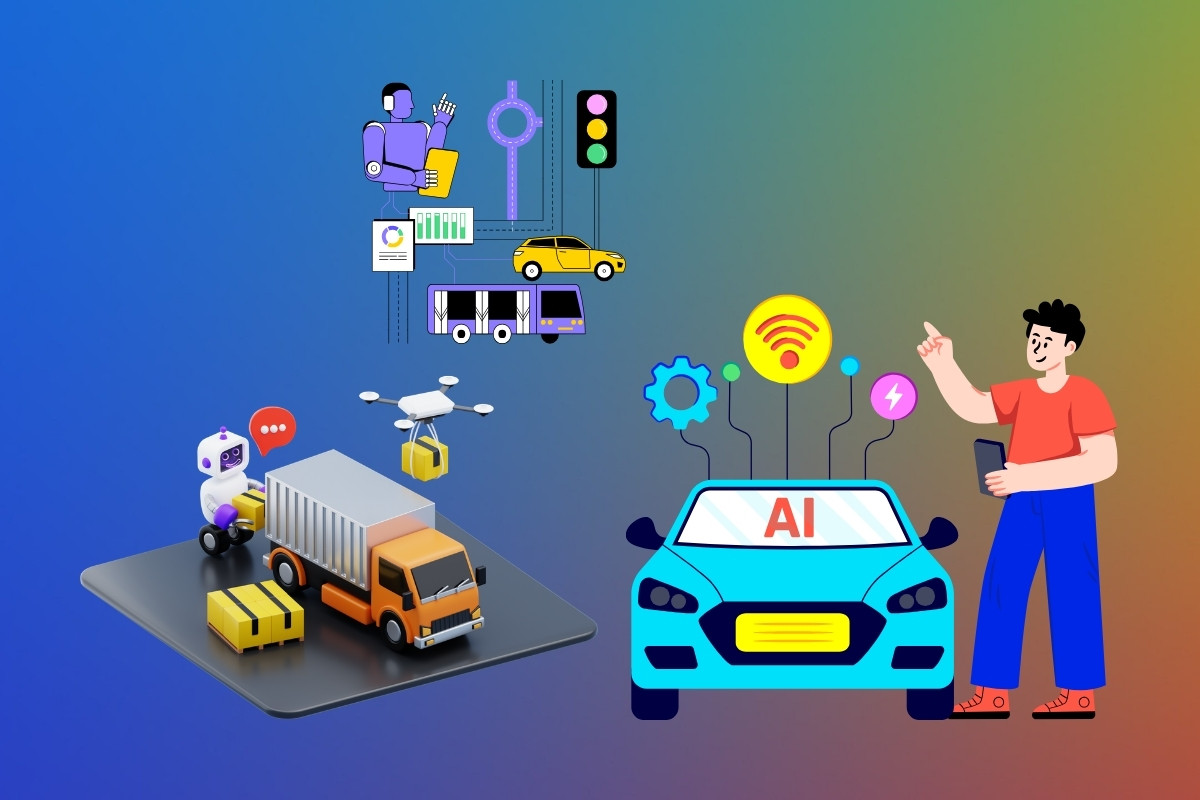
Artificial intelligence is becoming a core part of modern transportation, influencing how vehicles operate, freight moves, transit agencies plan service, and cities manage traffic. Transportation companies are using AI for route optimization, predictive maintenance, autonomous driving, traffic control, driver assistance, and real-time fleet management. These applications can reduce delays, improve fuel efficiency, strengthen safety, and help operators make faster decisions with large volumes of transportation data.
Autonomous trucks and robotaxis show how quickly AI is moving into commercial service, while public transit agencies and logistics providers are using AI to improve scheduling, maintenance, and asset utilization. The statistics in this article highlight the current scale of adoption, market growth, regional trends, safety outcomes, investment activity, and the practical impact of AI across transportation.
Editor’s Choice
- The broader global automotive and transportation AI segment generated about $40.58 billion in 2025, showing how large the market becomes when passenger vehicles, mobility technologies, and transportation systems all fall within the definition.
- One dedicated transportation-AI forecast values the market at $5.03 billion in 2026, up from $4.34 billion in 2025.
- A separate 2026 market model estimates AI in transportation at $2.92 billion, demonstrating how published totals vary substantially according to included technologies and applications.
- Driverless commercial trucks had completed nearly 440,000 fully driverless miles on one U.S. platform by the end of June 2026.
- One leading U.S. robotaxi operation reached approximately 500,000 paid trips per week in 2026 while operating a fleet of roughly 4,000 vehicles across more than 10 cities.
- A commercial autonomous freight company secured $200 million in new Series D financing in August 2026 as investors continued funding driverless middle-mile logistics.
- North America generated approximately 34.9% of global AI-in-transportation revenue in 2025 under one market definition, maintaining its position as the largest regional market.
Recent Developments
- In May 2025, a U.S. operator launched regular commercial driverless Class 8 truck deliveries between Dallas and Houston after completing more than 1,200 miles without a driver at launch.
- By late 2025, the same autonomous trucking network had expanded to a roughly 600-mile Fort Worth-to-El Paso lane and surpassed 100,000 driverless miles.
- Its driverless fleet reached 10 trucks in December 2025, marking an early step from demonstration-scale deployments toward repeat commercial operation.
- By January 2026, the platform had surpassed 250,000 driverless miles, nearly three times its cumulative total from early October 2025.
- By April 2026, cumulative driverless mileage exceeded 370,000 miles, while reported on-time performance remained at 100% and no collisions were attributed to the automated driving system.
- A second-generation autonomous trucking hardware system introduced in 2026 targets a 1 million-mile operating life and a reduction of more than 50% in autonomous-driving hardware costs.
- Its long-range lidar system was extended to 1 kilometer, giving the automated driving system more than 34 seconds of potential reaction time at highway speeds under stated operating assumptions.
- In April 2025, U.S. transportation regulators introduced a new automated-vehicle framework built around three stated principles: safety, removal of unnecessary regulatory barriers, and expanded commercial AV deployment.
- In June 2025, regulators streamlined an exemption pathway that can allow manufacturers to sell as many as 2,500 vehicles per year that do not fully conform to conventional vehicle design standards, provided they meet equivalent safety requirements.
- In August 2025, regulators issued the first demonstration exemption for a domestically built driverless vehicle under the expanded automated-vehicle exemption program.
AI in Transportation Market Size
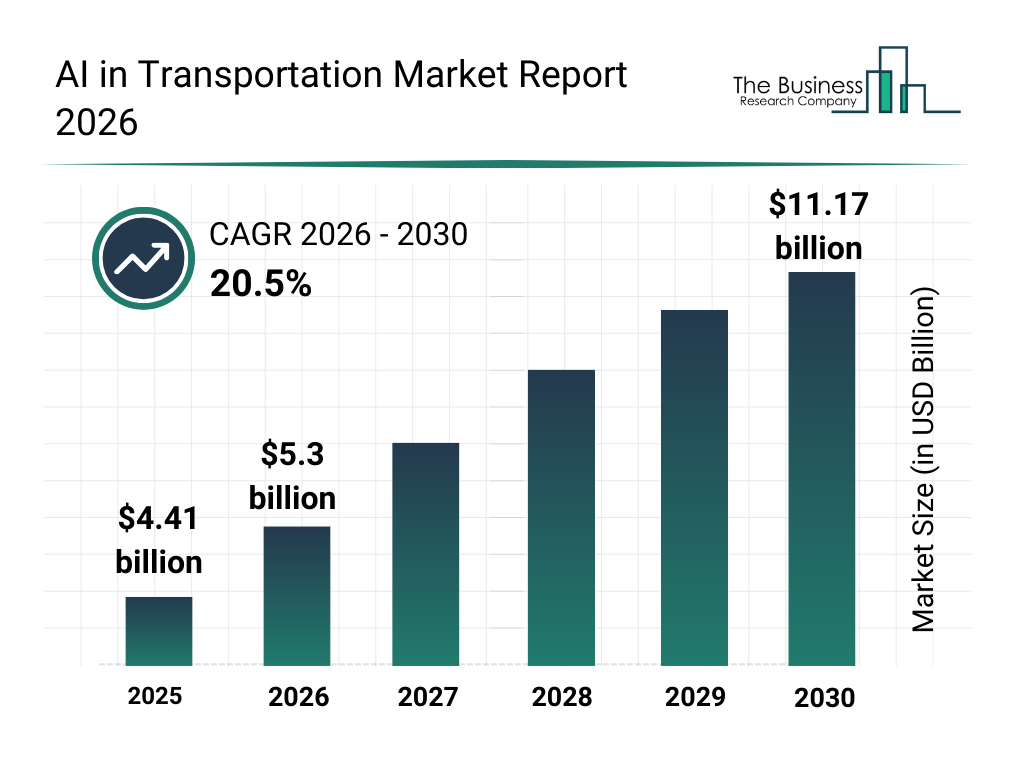
- The global AI in transportation market was valued at approximately $4.41 billion in 2025.
- The market is expected to reach $5.3 billion in 2026, representing strong year-over-year expansion.
- Between 2026 and 2030, the AI in transportation market is projected to grow at a robust 20.5% CAGR.
- At the stated growth rate, the market could increase to approximately $6.39 billion in 2027 and $7.70 billion in 2028.
- By 2029, the AI transportation market is estimated to approach $9.28 billion.
- The market is forecast to reach $11.17 billion by 2030, more than doubling its 2026 value in just four years.
- Overall, the market is projected to add roughly $5.87 billion in value between 2026 and 2030, highlighting rapid AI adoption across transportation.
AI in Transportation Market Growth Rate and Forecast
- One 2026 forecast expects the global transportation-AI market to grow at a 17.9% CAGR from 2026 through 2033, reaching $9.26 billion at the end of the period.
- Another projection calls for a 15.8% CAGR from 2026 to 2034, taking the market to $16.25 billion by 2034.
- A market model covering 2025 through 2030 expects a 19.9% CAGR and about $6.68 billion in incremental market expansion over the period.
- A 2026 industry forecast estimates a 20.5% CAGR through 2030, supported by connected vehicles, data-intensive transportation systems, and automated decision-making.
- Another long-range forecast expects a 21.05% CAGR between 2025 and 2032, taking global revenue from $4.99 billion to $18.93 billion.
- A separate 2025-2035 outlook projects a 22.8% CAGR, implying that industry revenue could multiply by roughly 7.9 times over the decade.
- The U.S. market is forecast to expand at about 23.5% annually from 2025 to 2035 in one country-level assessment, slightly ahead of the corresponding global growth benchmark.
- China has one of the strongest country outlooks, with projected annual growth of 24.5% between 2025 and 2035, supported by autonomous vehicle testing, smart logistics, and digital mobility investment.
- South Korea is expected to post the highest country-level CAGR from 2026 to 2033 within one broader automotive and transportation AI forecast, reflecting continued investment in connected mobility and advanced vehicle technology.
AI in Transportation Market Share by Region
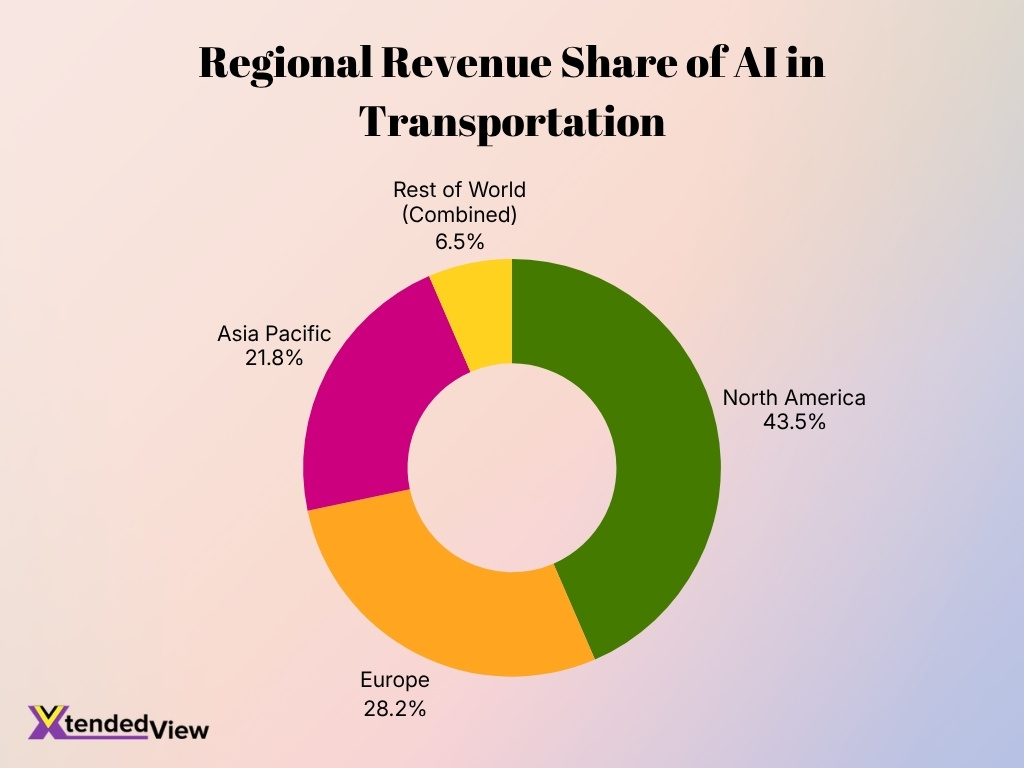
- North America leads the global AI in transportation market with a commanding 43.5% share, accounting for nearly half of the worldwide market.
- Europe ranks second with 28.2% of the total market, trailing North America by 15.3 percentage points.
- Asia Pacific holds a 21.8% market share, making it the third-largest regional market for AI in transportation in 2026.
- Together, North America and Europe control 71.7% of the global AI in transportation market, highlighting the strong concentration of adoption in these regions.
- The Rest of World accounts for just 6.5% of the market, considerably below the shares held by the three leading regions.
- The top three regions, North America, Europe, and Asia Pacific, collectively represent 93.5% of the global market in 2026.
AI Transportation Market by Application
- Autonomous trucks generated an estimated $1.46 billion in 2025, accounting for approximately 29.32% of the AI-in-transportation market under one application-based model.
- Traffic management represented about $1.26 billion, or 25.29% of the same 2025 market, as cities and road operators invested in adaptive signals, incident analysis, and real-time traffic coordination.
- Predictive maintenance generated approximately $906.97 million in 2025, giving it an 18.19% market share under the same segmentation.
- Logistics and supply-chain applications represented about $857.79 million, or 17.21% of 2025 transportation-AI revenue in that model.
- A separate application analysis assigns 26% of 2025 demand to semi-autonomous trucks, reflecting strong adoption of driver-assistance and partially automated long-haul functions.
- Truck platooning represented an estimated 18% of application demand in that segmentation, using AI and vehicle connectivity to coordinate closely spaced freight convoys.
- Precision mapping accounted for approximately 10% of application demand, supporting autonomous vehicle localization, routing, and high-definition road models.
- Machine-human interface applications contributed around 7%, covering systems that interpret driver inputs, vehicle alerts, and interaction between humans and automated functions.
- Another 2025 market assessment gives semi-autonomous trucks a much higher 45.3% share, underscoring how application results can shift when researchers use narrower freight-focused definitions of transportation AI.
AI Transportation Market by Technology
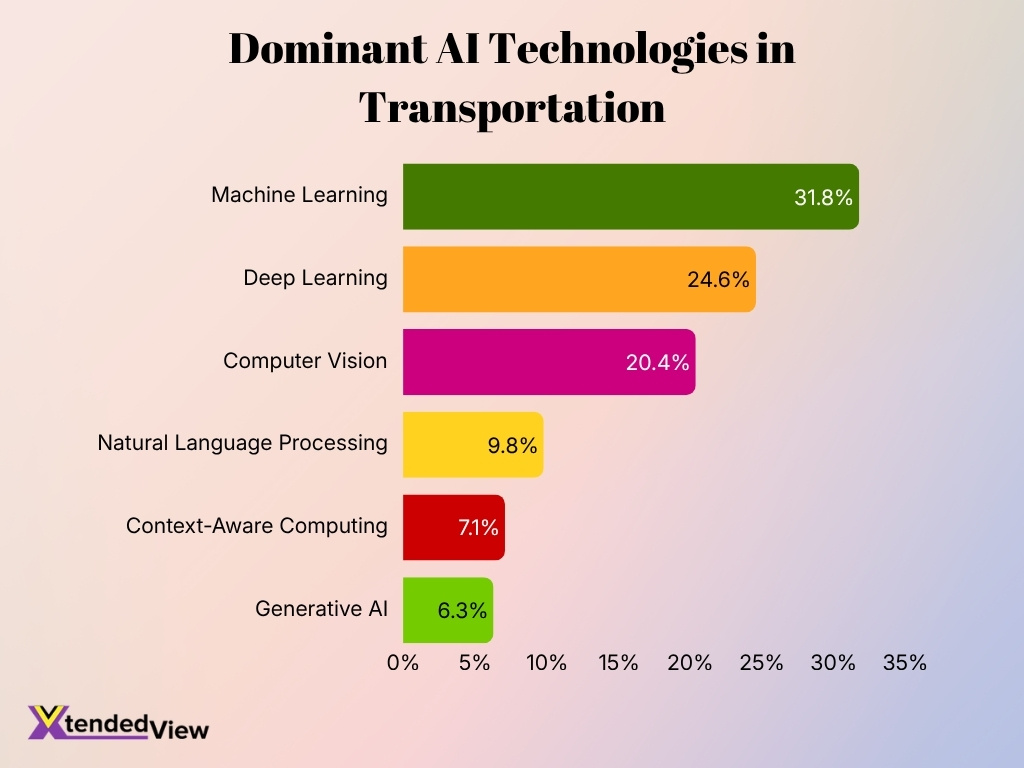
- Machine learning captured the largest share of the transportation AI technology market in 2025 at 31.8%. It supports traffic forecasting, predictive maintenance, fleet management, and route optimization.
- Deep learning accounted for 24.6% of transportation AI revenue in 2025, making it the second-largest technology category in one current market segmentation.
- Computer vision represented 20.4% of the market, reflecting demand for lane recognition, pedestrian detection, object identification, traffic-sign interpretation, and automated inspection.
- Natural language processing held a 9.8% share in 2025, supporting vehicle assistants, passenger-service automation, operational communications, and transportation data analysis.
- Context-aware computing accounted for another 7.1%, enabling AI systems to alter decisions according to traffic, weather, road conditions, vehicle behavior, and other environmental inputs.
- Generative AI represented approximately 6.3% of the 2025 market but ranks among the fastest-growing categories because operators can use it for simulation, synthetic training data, planning, and automated workflows.
- Within AI specifically applied to autonomous vehicles, machine learning held an estimated 35% share in 2025, while computer vision accounted for 30%, deep learning for 20%, sensor fusion and analytics for 10%, and NLP for 5%.
- A 2025 review covering 124 research papers found transportation machine learning applications concentrated around predictive maintenance, energy management, and system optimization, highlighting how AI use extends well beyond autonomous driving.
AI Adoption in Transportation
- A 2025 transportation leadership survey found 70% of companies had adopted AI solutions, an increase of 17 percentage points from the prior year.
- Among surveyed transportation executives already seeing operational gains, 36% reported improvements in fleet planning, 35% cited route optimization, and 34% reported better overall operational efficiency.
- Despite rising adoption, 84% of transportation executives said their industry still lagged other sectors in AI implementation.
- A 2025 transportation-management survey found 96% of respondents used generative AI somewhere in their operations. Its leading use cases were data entry at 41%, route or load optimization at 39%, freight forecasting at 35%, and automated load matching or capacity sourcing at 35%.
- Another 2025-2026 logistics study found that more than 40% of shippers expect logistics providers to offer AI-enabled services, indicating that AI capability is becoming a customer expectation rather than solely an internal technology decision.
- However, only about 10% of logistics service providers reported measurable financial impact from AI in the 2026 study, showing that broad experimentation has not yet translated into enterprise-scale returns for most operators.
- Nearly 70% of shippers remained in the exploration or pilot stage of AI adoption, while only 7% could identify measurable supply-chain improvements and just 1% had embedded AI in core logistics processes.
- AI maturity also varies geographically. About 31% of Asia-Pacific logistics providers reported embedding AI across core operations, compared with 14% in North America and 6% in Europe.
- Roughly 80% of logistics providers and shippers cited cost reduction and efficiency improvement as primary reasons for pursuing AI, while about half expect AI adoption to reshape workforce requirements.
Autonomous Vehicle and Self-Driving Car Adoption Statistics
- Autonomous vehicles had accumulated more than 360 million miles on U.S. roads by May 2026, up roughly 2.5 times from the mileage reported in June 2025.
- Commercial robotaxi services had delivered approximately 21 million rides in the U.S. by May 2026.
- One major driverless service had logged more than 220 million fully autonomous miles through March 2026, equivalent to more than 250 average human lifetimes of driving.
- By early 2026, global robotaxi operations had surpassed 700,000 fully autonomous rides per week across active commercial services.
- U.S. robotaxi operations accounted for more than 450,000 commercial rides per week by late 2025, while Chinese operations exceeded 250,000 weekly rides.
- One U.S. operator increased annual rides from approximately 4.66 million in 2024 to 14.9 million in 2025, representing more than a threefold increase in one year.
- The same fleet’s cumulative driverless mileage increased from approximately 77 million miles at the end of 2024 to 225 million miles at the end of 2025.
- California testing-permit holders collectively recorded more than 9 million AV testing miles during the 12 months ending Nov. 30, 2025.
- Fully autonomous Level 4 taxis are operating commercially in more than 20 cities worldwide in 2026, although Level 5 vehicles capable of driving everywhere without human intervention remain out of reach.
AI Transportation Market by Transportation Mode
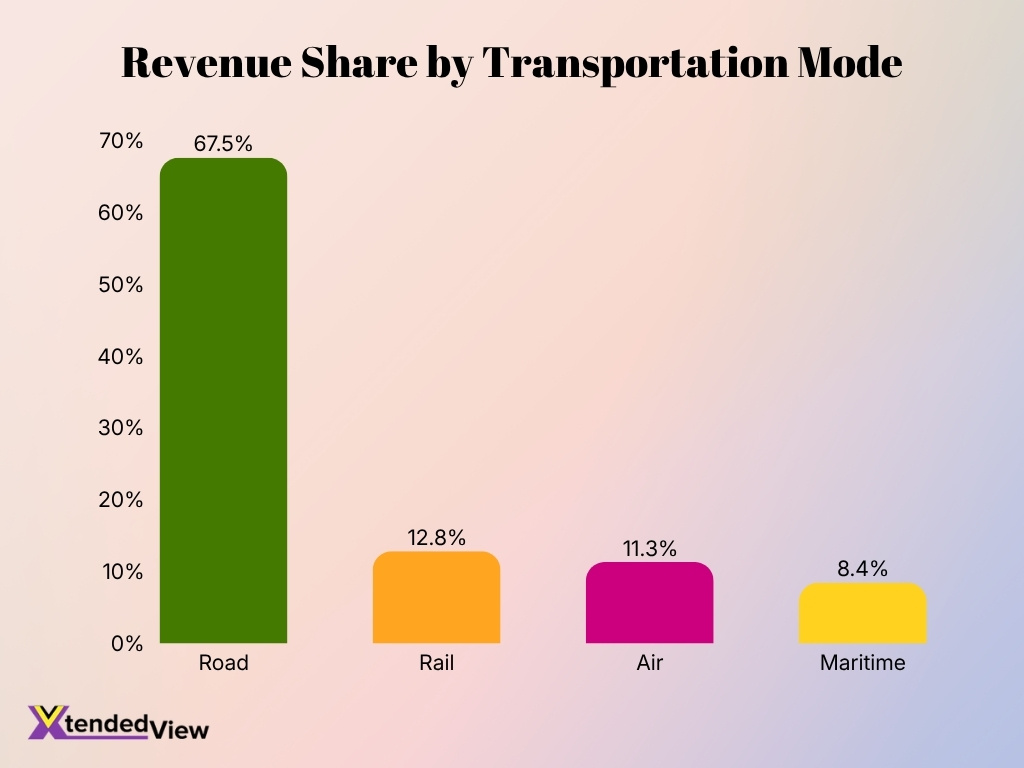
- Road transportation accounted for 67.5% of global AI-in-transportation revenue in 2025, making it the largest transportation-mode segment by a wide margin.
- Rail transportation represented 12.8% of 2025 market revenue, as operators expanded AI applications in train monitoring, scheduling, predictive maintenance, and asset management.
- Air transportation held an estimated 11.3% share in 2025 and is projected to become the fastest-growing transportation-mode segment through 2035.
- Maritime transportation accounted for the remaining 8.4% of the 2025 market, with AI increasingly supporting vessel routing, port operations, predictive maintenance, and cargo planning.
- AI adoption in road transportation benefits from an enormous addressable infrastructure base. The U.S. alone has more than 4 million miles of public roads, creating applications for automated driving, traffic analytics, road monitoring, and connected mobility.
- Autonomous road transport has moved well beyond experimental mileage. By May 2026, autonomous vehicles had accumulated more than 360 million miles on U.S. roads, about 2.5 times the total reported in June 2025.
- Commercial Level 4 robotaxi services now operate in more than 20 cities worldwide, and every commercial robotaxi service operating in 2026 uses electric vehicles.
- California autonomous vehicle permit holders logged more than 9 million testing miles on public roads between Dec. 1, 2024, and Nov. 30, 2025.
Autonomous Truck Statistics
- One commercial autonomous trucking operation exceeded 6 million cumulative commercial miles by June 30, 2026, including nearly 440,000 fully driverless miles.
- The same driverless network maintained 100% on-time performance and zero automated-driving-system-attributed collisions through nearly 440,000 driverless miles as of the end of June 2026.
- Driverless trucks serving one carrier were already averaging more than 4,000 miles per week per truck in early 2026, equivalent to an annualized rate exceeding 225,000 miles.
- The operator plans to have more than 200 driverless trucks working by the end of 2026, compared with 10 trucks in its initial driverless fleet in December 2025.
- Another autonomous trucking company reported 10 driverless trucks, more than 5,200 hours of paid driverless service and over 3 million autonomous miles as of Sept. 30, 2025.
- Those vehicles and customer trucks had completed more than 10,000 commercial loads by September 2025, showing that autonomous trucking activity increasingly includes revenue-producing work rather than testing alone.
- A middle-mile autonomous freight operator reported completing 60,000 fully driverless orders after launching freight-only operations in mid-2025.
- That operation had recorded more than 2,000 driverless operating hours and over 10,000 fully driverless public-road miles by January 2026, with some commercial routes extending as far as 400 miles.
- One autonomous trucking platform entered 2025 with an initial commercial order for 100 driverless trucks and had already accumulated more than 2.6 million autonomous miles in real-world conditions when the agreement was announced.
- Autonomous freight investment remains substantial. A commercial driverless trucking company secured $200 million in Series D financing in August 2026 as demand for automated freight capacity expanded in North America and Europe.
AI in Traffic Management and Congestion Reduction Statistics
- A 2025 Arizona field deployment reduced average intersection delay by 46%, cutting delay from 29.5 seconds to 13.7 seconds per vehicle.
- At the same intersection, average cross-traffic delay fell 54%, from 26.8 seconds to 12.4 seconds, while pedestrian waiting time declined 22%.
- The Arizona pilot saved an estimated 322 hours of vehicle delay in one week at a single intersection. Projecting similar performance to 170 intersections showed the potential for substantial countywide time savings.
- A California AI traffic controller deployed in August 2025 reduced total time spent in traffic by approximately 30% at a major intersection, saving drivers a combined 91 hours during the evaluated period.
- The California system ran traffic simulations as frequently as 10 times per second, allowing signal timing to respond continually to cars, buses, bicycles, and pedestrians approaching the intersection.
- AI-driven traffic analytics and adaptive control in New Jersey reduced corridor travel delays by approximately 10% to 30% across targeted road sections.
- A Toronto simulation covering 12 signalized intersections reduced total vehicle time by about 19%, from roughly 2,303 hours to 1,878 hours compared with the city’s existing signal plan.
- In the same Toronto simulation, total queue time fell from 1,171 hours to 901 hours, while virtual queue time dropped from about 202 hours to only 1.8 hours.
- A study combining AI-controlled signals with connected and autonomous vehicles produced travel-time reductions of 18.85% to 29.61%, delay reductions of 60.02% to 73.74%, and fuel-use reductions of 9.15% to 27.41%.
- A 2025 field study in Jakarta found that an AI- and IoT-based traffic-management system improved overall traffic flow by approximately 15% by adjusting signals in response to live conditions.
AI Route Optimization and Navigation Statistics
- The 2026 U.S. National Freight Strategic Plan estimates AI-enabled optimization could reduce logistics costs by 15% to 20% in some supply chains while improving inventory levels by 35% to 65%.
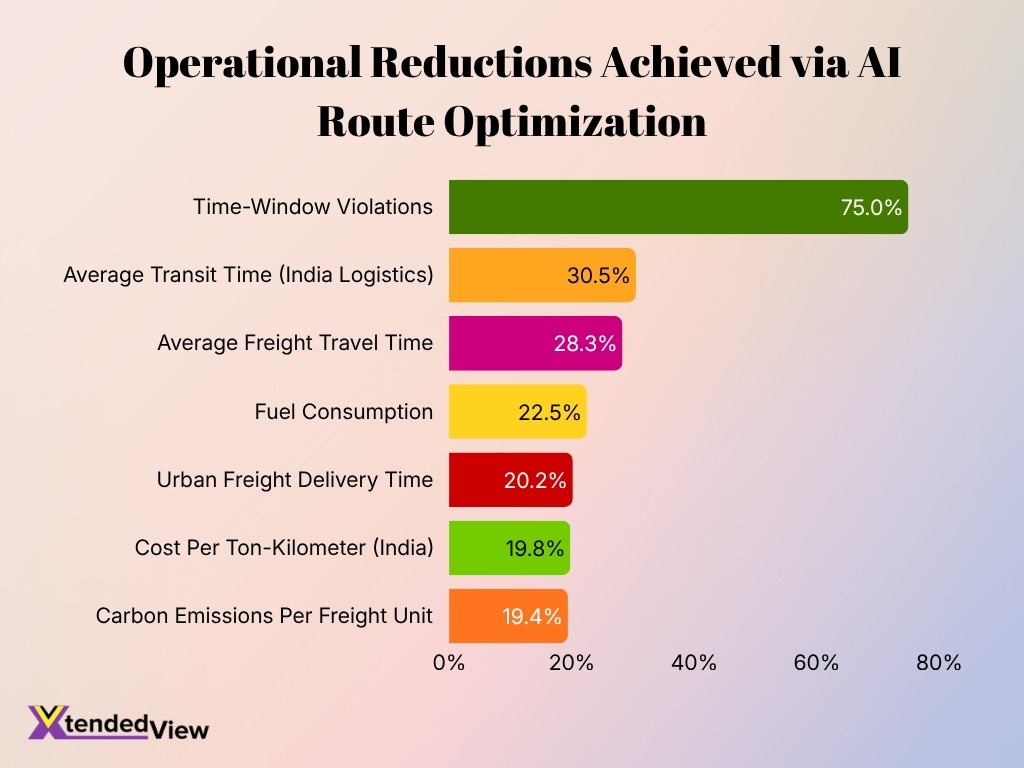
- A 2026 reinforcement-learning study reduced average urban freight delivery time by 20.2%, from 65.3 minutes to 52.1 minutes.
- The same AI routing model cut average fuel consumption by 22.5%, reducing usage from 0.120 liters per kilometer to 0.093 liters per kilometer.
- Time-window violations in that experiment fell 75%, from 12 violations to three, while vehicle-capacity compliance reached 100%.
- Traffic-incident avoidance improved from 78% to 94%, while the delivery-completion rate increased from 96% to 99%.
- A separate 2026 freight-routing study reduced average freight travel time by 28.3%, raised on-time performance to 92.1%, lowered the congestion index by 15.7%, and cut carbon emissions per freight unit by 19.4%.
- Under stable traffic conditions, the same model produced a 22.6% shorter travel time than a commercial routing benchmark and reduced unit transportation cost by 18.9%.
- A large-scale industrial route-optimization study published in 2026 found AI-generated routes were 10.3% more efficient in hours per haul and 11.6% more efficient in miles per haul than manually created routes.
- A 2025 last-mile routing study generated 22.4% more high-quality routes than a leading benchmark and 24.1% more than routes produced by couriers, after incorporating factors such as turn angles, backtracking, and driver preferences.
- In an analysis of India’s logistics system, average transit time declined 30.5%, from 82 hours to 57 hours; cost per ton-kilometer fell 19.8%, and delivery reliability rose from 72% to 88% following logistics digitization and AI-supported optimization.
Predictive Maintenance and Transportation Asset Management Statistics
- A 2026 aviation study found that an AI-based reliability-centered maintenance framework achieved 95.4% fault-detection accuracy across modeled aircraft systems.
- The same aviation research reported that AI-enhanced predictive maintenance reduced false alarms by 22%, helping maintenance teams focus on faults with a higher likelihood of requiring intervention.
- AI-supported maintenance strategies extended modeled aircraft component life cycles by approximately 18%, demonstrating the potential financial value of better timing for inspections and replacement.
- A 2026 U.S. public-transit survey found that 41% of responding agencies either use or expect to use AI or machine learning for maintenance. Four agencies already used such tools, five had systems in development or procurement, and four planned future deployment.
- Among agencies without AI maintenance tools, 58% expressed interest in adopting them, indicating that predictive maintenance remains an active expansion area for transit systems.
- An AI predictive-maintenance trial covering 326 transit buses increased maintenance productivity by 75% and reduced material costs by 24%. The system evaluated sensor data daily and generated prioritized repair plans.
- In that bus program, 50 of the 326 vehicles were sent to maintenance depots according to repair plans produced by the predictive system, showing how AI can turn diagnostic data into specific maintenance actions.
- An earlier transit-bus predictive-maintenance deployment cut breakdowns by 8.08% per 10,000 kilometers and lowered oil consumption by 31.8% compared with pre-deployment performance. The benchmark remains relevant because recent federal transportation guidance continues to cite the project when evaluating predictive maintenance.
- A U.S. rail-transit predictive model demonstrated the ability to forecast as much as 35% of signal-equipment failures one month in advance, offering operators time to intervene before a service disruption occurs.
AI in Public Transportation and Transit Automation Statistics
- A 2026 survey of 32 transit respondents found that 50% use or expect to use AI for back-office functions such as document processing, accounting, information retrieval, and administrative automation.
- Operations ranked close behind, with 47% of transit respondents using or expecting to use AI for dispatching, vehicle assignment, bus control, disruption response, or routing.
- Among agencies without operational AI tools, 71% said they were interested in using AI or machine learning in the future.
- Customer support represented another major application: 44% of surveyed agencies used or expected to use AI for functions such as virtual agents, feedback processing, trip information, and automated customer assistance.
- Among agencies without customer-support AI, 57% expressed interest in adoption, while one transit virtual agent can interact with customers in as many as 19 languages for scheduling, cancellations, estimated arrival times, and payments.
- Safety and security systems accounted for 38% of current or planned transit AI use. Four surveyed agencies already had tools deployed, one had a system under development or procurement, and seven planned future systems.
- Interest in public-transit safety AI remains particularly strong: 85% of respondents without existing safety or security AI said they were interested in using such systems.
- Across all surveyed functions, customer support and customer analytics had the highest number of agencies with AI already deployed, at five agencies each. Maintenance and safety followed with four current users each.
- A broader 2025 public-transportation survey found 95% of organizations had researched, piloted, or implemented AI, but only 8% reported active use with measurable or transformative benefits.
- U.S. riders completed 8.1 billion public-transit trips in 2025, up 6% year over year. That expanding ridership base increases the operational value of AI tools used for demand forecasting, dispatching, passenger information, and capacity management.
AI in Fleet Management, Logistics, and Freight Transportation
- More than 40% of shippers in 2026 considered a logistics provider’s AI capabilities when selecting partners, although fewer than 10% viewed AI as a mandatory selection requirement.
- About 40% of logistics providers had progressed beyond AI pilots by 2026, but only around one in 10 had scaled AI across their core operating processes.
- Nearly 80% of logistics providers and shippers identified cost reduction and operating efficiency as their main reasons for adopting AI.
- Almost 70% of shippers remained in exploration or pilot stages, while just 7% reported measurable supply-chain improvements and only 1% had integrated AI into core logistics processes.
- Asia-Pacific logistics providers led scaled adoption in 2026, with 31% reporting AI embedded in core operations, compared with 14% in North America and 6% in Europe.
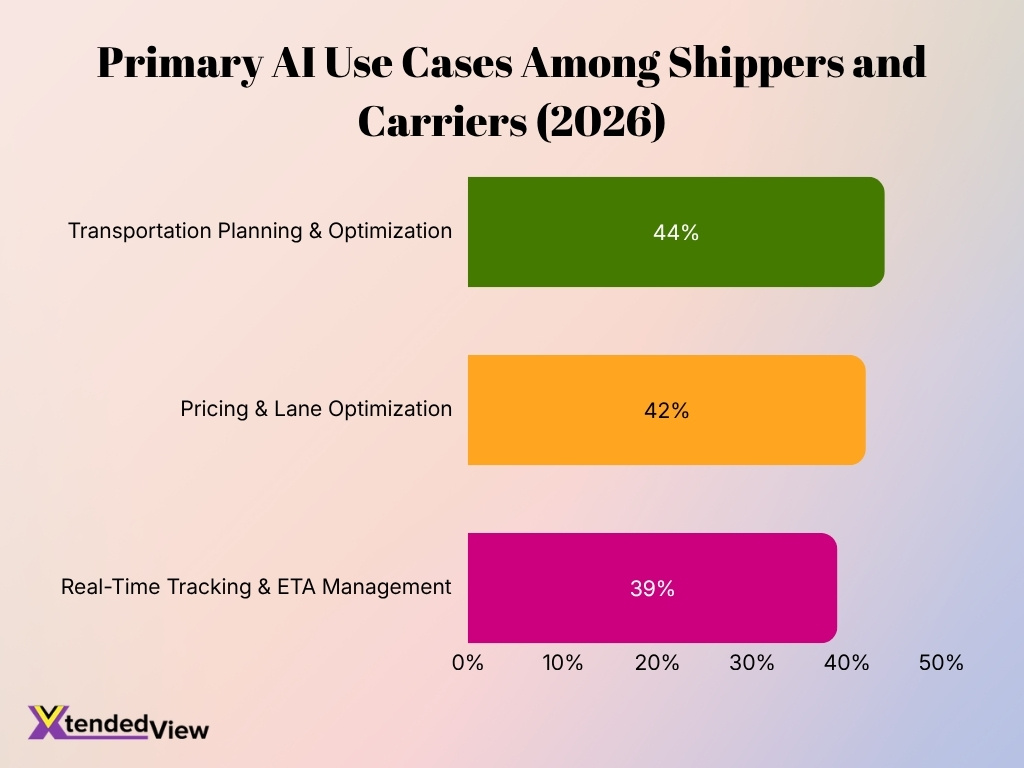
- A 2026 transportation-management survey found 44% of shippers already used AI for transportation planning and optimization, making planning one of the most common practical use cases.
- Among carriers and logistics providers, 42% used AI for pricing and lane optimization, while 39% used it for real-time tracking and estimated-arrival-time management.
- Despite expanding use, roughly 25% of shippers reported no AI use in their transportation management systems, and another 18% did not have a transportation management system at all. Only 1% reported advanced autonomous decision-making capability.
- More than half of shippers and carriers identified poor or inconsistent data as a leading obstacle to transportation AI performance, highlighting data quality as a larger near-term challenge than algorithm availability.
- In a 2026 study of 500 transportation and logistics providers, 70% reported implementing AI-based logistics tools. The research also recorded a 30.5% reduction in average transit time after logistics digitization and AI-supported optimization.
AI for Transportation Safety and Driver Assistance Statistics
- Automatic emergency braking reduces police-reported front-to-rear crashes by approximately 50%, making it one of the most established crash-avoidance technologies in the vehicle fleet.
- Front automatic emergency braking appeared on about 32% of registered U.S. vehicles in 2024 and is projected to reach 55% of the registered fleet by 2029 as newer vehicles replace older models.
- Front crash-prevention technology, including warning and braking systems, is projected to rise from 38% fleet penetration in 2024 to 60% in 2029.
- Blind-spot monitoring is projected to increase from 35% of the registered fleet in 2024 to 57% by 2029, while lane-departure warning is expected to grow from 33% to 56%.
- Automatic emergency braking with pedestrian detection is projected to rise from 26% penetration in 2024 to 50% by 2029, reflecting growing emphasis on vulnerable-road-user protection.
- A July 2026 independent assessment found that one large Level 4 driverless fleet experienced 68% fewer police-reportable crashes per vehicle mile than comparable human drivers in San Francisco, Phoenix, Los Angeles and Austin.
- Across more than 220 million fully autonomous miles through March 2026, that fleet recorded 94% fewer crashes causing serious or fatal injuries than the corresponding human benchmark.
- The same 2026 safety dataset showed 82% fewer injury-causing crashes and 82% fewer crashes involving airbag deployment than expected from human drivers traveling comparable roads and distances.
- Injury-causing crashes involving vulnerable road users were substantially lower in that dataset: 93% fewer involving pedestrians, 84% fewer involving cyclists and 84% fewer involving motorcyclists.
- A peer-reviewed 2025 analysis of 56.7 million driverless miles found a 96% reduction in injury-reported vehicle-to-vehicle intersection crashes and a 91% reduction in intersection crashes involving airbag deployment compared with matched human benchmarks.
AI Transportation Investment and Companies Using AI
- One autonomous-driving company raised $16 billion in February 2026, valuing the business at $126 billion after the financing round. The capital supports continued expansion of its autonomous ride-hailing network.
- Another autonomous-driving developer secured an oversubscribed $750 million Series C round in January 2026, together with additional milestone-based investment linked to a robotaxi deployment partnership.
- That January financing package totaled approximately $1 billion, including about $250 million in milestone-based capital connected with a planned deployment of at least 25,000 AI-powered robotaxis.
- An autonomous middle-mile freight company raised $200 million in Series D funding in August 2026, providing capital for commercial expansion as demand for driverless freight services grows in North America and Europe.
- In September 2025, a strategic investor signed a letter of intent to evaluate an additional $500 million investment in a developer of machine-learning-based autonomous-driving technology.
- Global autonomous-vehicle venture investment exceeded $19 billion by April 2026, already representing the highest annual funding level in more than a decade at that point in the year. One $16 billion transaction accounted for most of the total.
- By comparison, approximately $9 billion in autonomous-vehicle investment was spread across 94 deals in 2021, illustrating how 2026 capital has shifted toward fewer, larger and more established companies.
- One U.S. autonomous-trucking operator ended the second quarter of 2026 with nearly $1.2 billion in cash and short-term investments after raising $215 million in net proceeds through an equity program during the quarter.
- That trucking company expects approximately $150 million in 2026 capital expenditures as it scales toward more than 200 driverless trucks and an estimated $80 million annualized transportation-service revenue run rate.
- Another major mobility company has committed more than $10 billion toward expanding its autonomous-vehicle network and partnerships, with plans to deploy 120,000 driverless vehicles across at least 15 cities.
Frequently Asked Questions (FAQs)
About 50% of transportation respondents are actively deploying AI or looking to scale existing AI deployments.
In a 2026 transportation-management survey, 44% of shippers said they already use AI for transportation planning and optimization.
More than 700,000 fully autonomous robotaxi rides per week were being completed globally by early 2026.
Only about 10% of logistics service providers had scaled AI across core operations in 2026, although roughly 40% had moved beyond pilot programs.
A 2026 study of 500 transportation and logistics providers found that 70% had implemented AI-based logistics solutions, while 30% remained non-users.
Conclusion
AI in transportation has moved from limited pilots into commercial operations across autonomous vehicles, freight networks, fleet management, predictive maintenance, public transit, traffic management, and road safety. The statistics show that adoption is accelerating, but maturity still varies widely across transportation sectors. Autonomous fleets now accumulate millions of commercial miles, while many logistics companies and transit agencies continue to test AI through pilots or individual operational use cases. At the same time, measurable improvements in routing, maintenance productivity, congestion reduction, crash prevention, and fleet efficiency are giving operators clearer evidence of where AI can create value.
Investment in autonomous transportation also continues to rise as companies scale robotaxi networks, driverless trucking fleets, and supporting infrastructure. Going forward, the strongest transportation AI deployments will likely be those that combine reliable data, measurable safety gains, lower operating costs, and clear improvements in service performance.
