



Digital picture frames have evolved from simple slideshow devices into connected smart displays that help families, businesses, and healthcare providers share visual content in real time. They now support remote photo sharing, cloud synchronization, and smart home integration, making them useful for everything from keeping seniors connected with loved ones to displaying branded content in hotels, retail stores, and offices. As consumer demand shifts toward connected home devices and digital gifting, the market continues to expand. Explore the statistics below to understand the latest market trends, growth drivers, and regional performance shaping the industry.
Editor’s Choice
- The global digital picture frame market reached approximately $2.63 billion in 2026, up from $2.41 billion in 2025, reflecting continued demand for connected smart displays.
- Industry forecasts project the market will reach $4.82 billion by 2032, expanding at a 10.37% CAGR between 2026 and 2032.
- Another market assessment estimates the digital photo frame segment at $70.68 million in 2026, compared with $68.10 million in 2025, highlighting steady year-over-year growth.
- Wi-Fi-enabled models continue to dominate new product launches as consumers increasingly prefer cloud-based photo sharing and smartphone integration.
- Residential households remain the largest end-user segment, while hospitality, retail, healthcare, and corporate offices continue to increase commercial deployments.
- North America maintains a leading market position due to high smart home adoption and strong consumer spending on connected electronics.
- AI-powered photo organization, touchscreen displays, higher-resolution IPS panels, and app-based remote sharing represent the most influential product innovations entering the market in 2025 and 2026.
Recent Developments
- During 2026, manufacturers accelerated the rollout of AI-assisted image management, allowing automatic photo selection and smarter slideshow personalization.
- Connected digital frames increasingly integrate with cloud platforms, enabling users to upload photos instantly from smartphones regardless of location.
- Premium models introduced throughout 2025 expanded support for unlimited cloud storage without recurring subscription fees.
- Several newly released premium frames now feature 1600 × 1200 displays or higher, improving image sharpness compared with earlier generations.
- Larger displays continue gaining popularity, with manufacturers introducing 15.6-inch premium models designed for both home décor and commercial environments.
- USB-C connectivity, expanded internal storage, SD card compatibility, and Wi-Fi have become common features across mid-range and premium products launched during 2025.
- Manufacturers increasingly position digital picture frames as part of broader smart home ecosystems instead of standalone consumer electronics.
- New commercial deployments focus on hospitality, senior living communities, healthcare facilities, and retail digital displays, creating additional revenue opportunities beyond household use.
- Product differentiation now emphasizes software experiences, including family sharing, cloud synchronization, mobile apps, and personalized content rather than hardware specifications alone.
Digital Photo Frames Market Size Trends
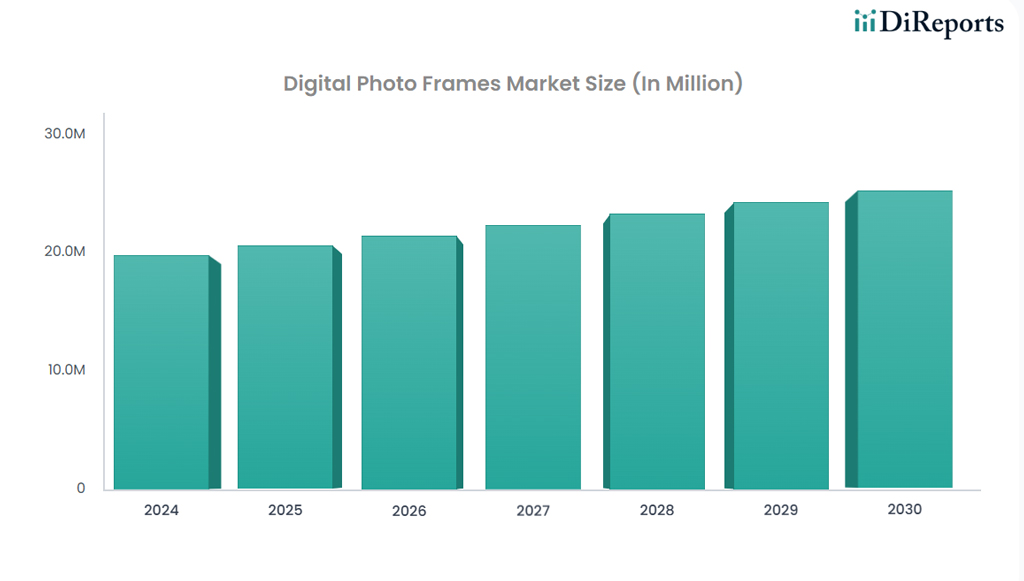
- The global digital photo frames market was valued at 19.78 million in 2024, providing a strong base for future market expansion.
- In 2025, the market increased to 20.59 million, reflecting steady year-over-year growth as consumer demand for smart home devices continued to rise.
- The market reached 21.45 million in 2026, surpassing the 21 million mark and demonstrating consistent adoption across residential and commercial applications.
- By 2027, the market size climbed to 22.35 million, representing an increase of 2.57 million compared to 2024.
- In 2028, the industry expanded further to 23.29 million, highlighting sustained momentum driven by connected and WiFi-enabled digital frames.
- The market grew to 24.27 million in 2029, adding nearly 4.5 million in value since 2024, indicating healthy long-term growth.
- By 2030, the global digital photo frames market is projected to reach 25.30 million, marking an overall increase of 5.52 million from 2024.
- Across the 2024–2030 period, the market shows a consistent upward trajectory, with annual gains of approximately 0.8 to 1.0 million, reflecting stable demand and a positive industry outlook.
Digital Picture Frame Growth Rate and CAGR Statistics
- The digital picture frame market is forecast to grow at a 10.37% CAGR between 2026 and 2032 according to one leading industry forecast.
- Another market analysis projects a 3.98% CAGR from 2026 through 2032 for the digital photo frame segment.
- Tech-focused industry forecasts estimate approximately 3.2% CAGR during the 2025,2030 period.
- An additional forecast projects a 10.2% CAGR between 2026 and 2035, supported by smart home adoption and commercial applications.
- Another research firm estimates the market could expand at 12.8% CAGR through 2032, reflecting optimistic expectations for connected display devices.
- Growth continues to accelerate as consumers increasingly expect cloud connectivity, smartphone integration, and automatic content synchronization.
- Expansion of IoT ecosystems and smart home adoption remains one of the strongest long-term catalysts supporting digital picture frame sales.
- Commercial installations across healthcare, hospitality, education, and retail contribute additional recurring demand beyond seasonal consumer purchases.
- Analysts expect premium connected devices to outpace basic offline frames in growth throughout the forecast period.
Revenue Statistics
- Global market revenue increased from approximately $2.41 billion in 2025 to $2.63 billion in 2026.
- Industry revenue could approach $4.82 billion by 2032 if current growth trends continue.
- The U.S. digital photo frame market alone is estimated at $195.6 million in 2025, making it one of the world’s largest national markets.
- China is forecast to reach approximately $174.1 million by 2032, supported by a projected 5.4% CAGR.
- Revenue increasingly comes from premium connected devices offering higher-resolution displays and advanced software features rather than entry-level hardware.
- Cloud-enabled ecosystems encourage higher average selling prices by adding remote sharing, family collaboration, and smart home functionality.
- Business customers continue expanding revenue opportunities through installations in hotels, retail environments, healthcare facilities, and offices.
- Seasonal gifting remains an important contributor to annual consumer sales, especially during holiday shopping periods in North America and Europe.
- Premium product launches priced above traditional digital frames continue lifting industry revenue despite relatively modest unit growth.
Digital Picture Frame Display Technology Statistics
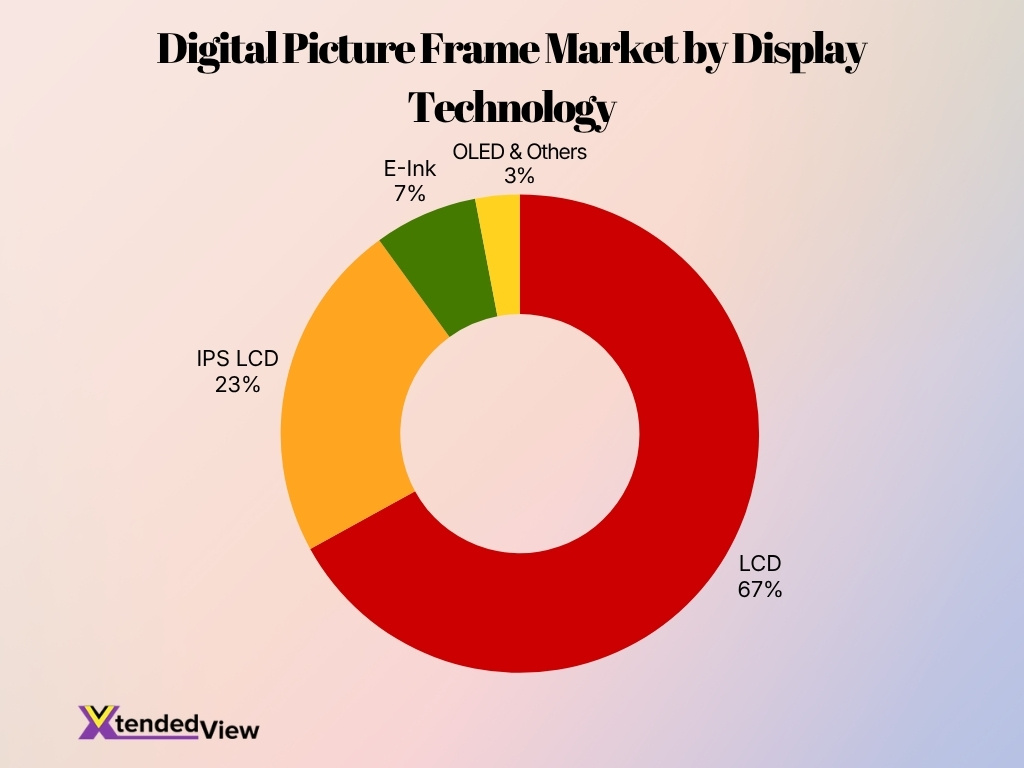
- LCD technology dominates the digital picture frame market with a 67% market share, making it the most widely used display technology due to its affordability, availability, and reliable image quality.
- IPS LCD accounts for 23% of the market, reflecting strong demand for wider viewing angles, improved color accuracy, and enhanced visual performance in premium digital picture frames.
- E-Ink displays represent 7% of the market, highlighting their niche appeal for ultra-low power consumption and paper-like readability, particularly in specialized applications.
- OLED and other display technologies hold a combined 3% market share, indicating that while they offer superior contrast and vibrant colors, they remain limited by higher production costs and lower adoption.
- Together, LCD and IPS LCD control 90% of the market, demonstrating that traditional LCD-based technologies continue to dominate the digital picture frame industry.
- Alternative display technologies, including E-Ink, OLED, and others, collectively account for just 10% of the market, showing that advanced and specialty display options remain a relatively small segment compared to conventional LCD solutions.
Regional Digital Picture Frame Market Share Statistics
- North America remains the dominant leading region, capturing approximately 34.45% of global market share due to extensive smart home connectivity.
- The United States represents a massive individual national market, generating an estimated $195.6 million in revenue during 2025.
- Asia-Pacific consistently records the fastest regional growth with a 5.28% CAGR as disposable incomes rise across major economies.
- China is projected to steadily expand at a 5.4% CAGR through 2032, easily outperforming several globally mature markets.
- European market demand remains incredibly strong, with connected home device adoption surpassing 40% across several major economies.
- Regional market acceleration increasingly depends on digital infrastructure, driving cloud-connected frames to a rapid 5.55% global CAGR.
- Emerging markets continue to benefit immensely from a 5.6% annual rise in household income and broader IoT electronics integration.
- Commercial demand from hospitality and healthcare organizations contributes significantly to regional growth, advancing at a 4.22% CAGR.
- Asia-Pacific leverages its position as holding over 60% of electronics manufacturing to swiftly narrow the revenue gap with North America.
Digital Picture Frame Statistics by Type and Connectivity
- Improved multimedia frames held 52.4% of the market in 2025, supported by demand for Wi-Fi, cloud synchronization, touchscreen controls, video playback, and app connectivity.
- Simple multimedia frames represent the faster-growing product category, with a projected 6.4% CAGR, as buyers seek lower-priced devices that still support photos, audio, and video.
- The home Wi-Fi digital picture frame segment reached an estimated $1.21 billion in 2025 and is forecast to rise to $1.31 billion in 2026.
- Home Wi-Fi frame revenue could reach $2.28 billion by 2032, representing a projected 9.44% CAGR from 2026 onward.
- One major photo-sharing ecosystem reported 28 million app downloads, showing the scale that app-connected frames have achieved beyond individual hardware brands.
- The same ecosystem has facilitated more than 2.5 billion photo transfers, illustrating how remote sharing now drives frame usage rather than local memory cards alone.
- Its premium service has reached 500,000 subscribers, indicating that some users will pay for cloud backup, remote management and larger transfer batches.
- Modern Wi-Fi frames can receive new photos in less than 60 seconds, narrowing the gap between taking an image and displaying it in another household.
- Privacy has become a product differentiator; one widely used platform states that app-to-frame communication uses end-to-end encryption, preventing the platform and third parties from viewing transferred photos and videos.
Digital Picture Frame Market by Screen Size Statistics
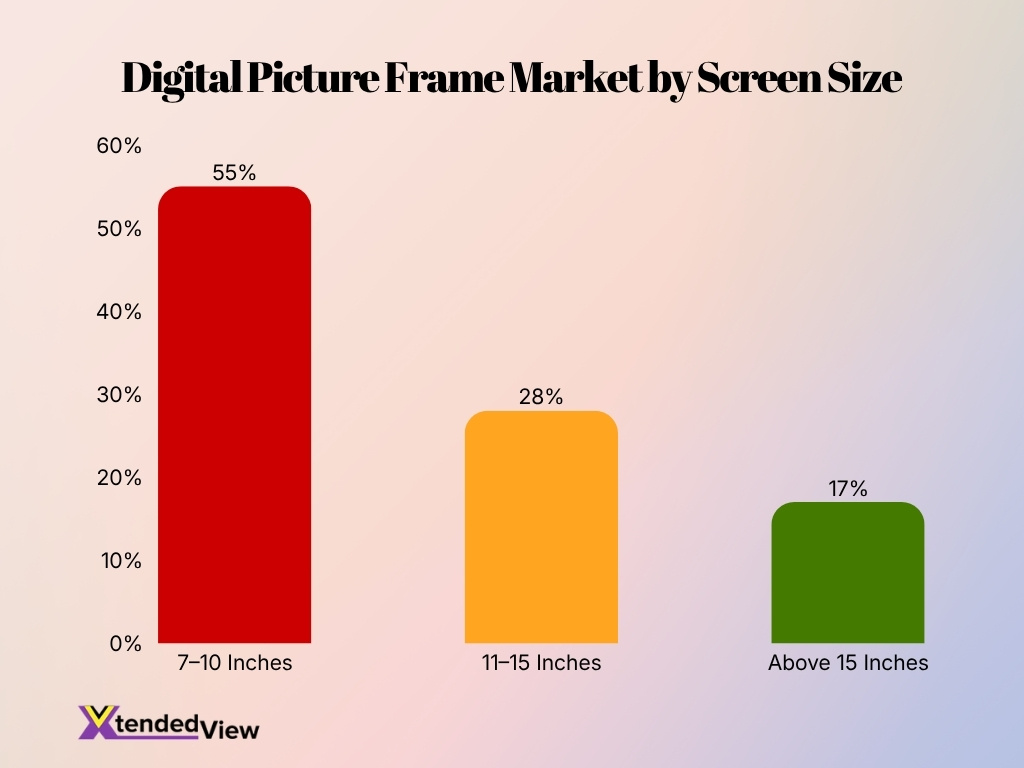
- 7–10 inch digital picture frames dominate the market with a 55% share, making them the most popular screen size due to their affordability, compact design, and suitability for home use.
- The 11–15 inch segment accounts for 28% of the market, reflecting strong demand from consumers seeking larger displays for enhanced photo and video viewing experiences.
- Digital picture frames larger than 15 inches hold a 17% market share, indicating a niche but growing preference for premium, large-format displays in commercial settings and luxury households.
- Together, 7–15 inch models represent 83% of the total market, highlighting that small and mid-sized frames remain the preferred choice among most buyers.
- The 38 percentage point gap between the 7–10 inch (55%) and 11–15 inch (28%) segments underscores the strong consumer preference for compact digital picture frames.
- With only 17% of the market, above 15-inch frames continue to serve a specialized audience, including businesses, digital signage users, and consumers looking for gallery-style displays.
Digital Picture Frame Adoption Statistics by Application
- Residential buyers accounted for 64.3% of digital photo frame market demand in 2025.
- Commercial applications across healthcare, hospitality, and retail represented 35.7% of the 2025 market.
- Healthcare facilities are projected to experience application expansion at a 4.22% CAGR from 2026 to 2031.
- Family-sharing platforms make high-volume events practical by supporting up to 100 photos in one transfer.
- Centralized systems allow 1 sender to distribute the exact same photo collection to multiple devices at once.
- Child-focused smart frames have expanded into active communication devices utilizing 7-inch displays.
- Digital art applications utilize screens as large as 27 inches for premium subscription-based galleries.
Smart Digital Picture Frame Consumer Demographics and Usage Statistics
- U.S. smartphone ownership reached 90% of adults in the latest broad adoption benchmark, giving most consumers the hardware needed to upload photos through a frame app.
- In 2025, smartphone ownership reached 97% among adults in households earning $100,000 or more, compared with 82% among those earning below $30,000. This gap may affect access to app-dependent frame features.
- Smartphone ownership stood at 96% among college graduates and 84% among adults with a high school education or less in 2025.
- Urban and suburban adults reported smartphone ownership rates of 91% and 93%, respectively, compared with 87% among rural adults.
- Cellphone ownership remained high among Americans age 65 and older at 95% in 2025, expanding the potential audience for family-managed connected frames.
- Among adults age 50 and older, 71% purchased technology in 2025, showing continued willingness among older consumers to invest in connected devices.
- Consumers age 50 and older spent an estimated $94.5 billion on technology in 2025, averaging about $756 per person for the year.
- Replacement needs drove 52% of older adults’ technology purchases, while only 16% said they purchased primarily because they wanted a new technology product.
- However, 64% of adults age 50 and older said technology products did not feel designed with their age group in mind, underscoring the value of simple setup, large controls, and remote family management.
- One major frame ecosystem reports a 4.9 out of 5 App Store rating, suggesting that streamlined mobile sharing can earn strong user approval across a broad customer base.
Digital Picture Frame Distribution Channel Statistics
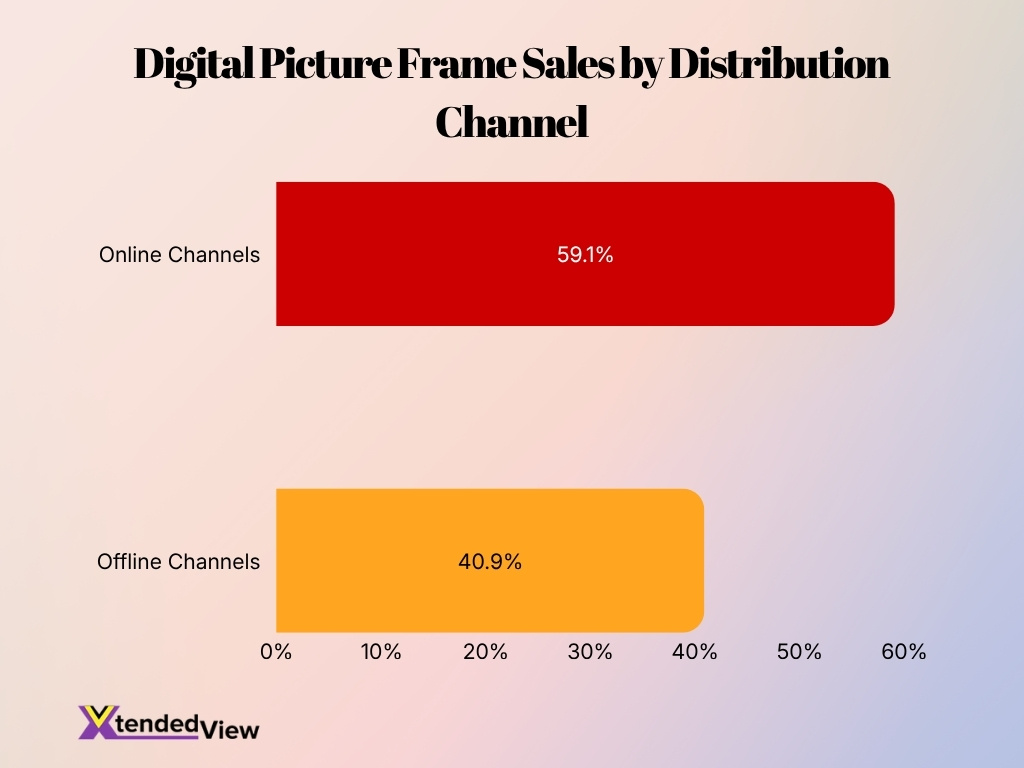
- Online channels generated 59.1% of market sales in 2025, giving e-commerce a clear lead over physical retail.
- Based on that reported split, offline channels accounted for approximately 40.9% of 2025 sales.
- Online digital frame sales are projected to expand at a 4.92% CAGR through the forecast period, faster than the broader market estimates published by several researchers.
- Another market assessment valued the offline segment at $630.8 million in 2024, showing that electronics stores, department stores, and specialty retailers still generate substantial revenue.
- The global market is expected to add $126.4 million between 2025 and 2030, with online product discovery and direct-to-consumer sales supporting that increase.
- Direct online sales let brands sell several screen sizes, colors and frame finishes without requiring stores to hold every product variation in inventory. One current product line offers four styles and eight colors for its updated model.
- App-based ecosystems also direct buyers to regional resellers across North America, Europe, Asia-Pacific and Australia, combining online discovery with local fulfillment.
- Physical retail remains relevant for shoppers who want to inspect brightness, viewing angles, frame materials and touchscreen response before purchasing. This need becomes more important as products move from 10-inch tabletop devices to 15-inch and larger displays.
- Online promotions can materially change purchasing decisions; one 10-inch frame received a 38% seasonal discount, demonstrating the role of holiday pricing in this gift-oriented category.
Household Usage Statistics
- 91% of U.S. households had a broadband internet subscription during the 2020 to 2024 measurement period, creating a large addressable base for Wi-Fi-enabled frames.
- 95.5% of U.S. households had a computer during the same period, supporting browser- and email-based photo uploads in addition to smartphone apps.
- Earlier national data found smartphones in 90% of households, desktop or laptop computers in 81%, and tablets in 64%, showing that households commonly have several devices capable of sending images.
- Broadband access reached 91% of urban households but 87% of rural households, creating a modest connectivity gap for cloud-dependent frames.
- Homeowners reported a 92% internet subscription rate, compared with 87% among renters, which may influence connected-home product adoption.
- Households that included a person with a disability had broadband access 84% of the time, compared with 92% for households without a disabled member.
- Among households earning at least $150,000, 82% had a desktop or laptop, smartphone, tablet and home broadband connection. The share fell to 29% among households earning less than $25,000.
- A standard 10-inch frame can hold more than 8,000 photos, while a newer 16GB model can store as many as 16,000, reducing the need for households to delete older images frequently.
- Frames can continue displaying previously downloaded photos without an active Wi-Fi connection, although internet access remains necessary for setup and new remote transfers.
- Some platforms automatically replace the oldest images after storage fills, allowing households to maintain a continually refreshed collection without manual file management.
Brand Performance Statistics
- Public companies and private frame manufacturers rarely disclose audited unit sales by brand, so current brand performance is better measured through platform reach, product capacity, ratings, and distribution.
- One frame-sharing platform increased from 22 million recorded app downloads to 28 million, a gain of 6 million downloads between its published company and subscription metrics.
- The same platform’s reported sharing volume increased from 2.2 billion to 2.5 billion photos and videos, adding roughly 300 million transfers between published updates.
- The platform works with approximately 350 brand holders worldwide, illustrating how software ecosystems can reach consumers through many hardware labels rather than one frame manufacturer.
- Its premium offering has attracted 500,000 paid subscribers, providing a recurring-revenue benchmark for cloud backup and remote frame-management services.
- One prominent hardware line doubled storage from 8GB to 16GB between its original and second-generation 10-inch models, increasing estimated capacity from 8,000 to 16,000 photos.
- The same second-generation model raised resolution from 1280 by 800 to 1920 by 1200, while increasing processing speed from 1.5GHz to 2GHz.
- A leading premium 9.7-inch model earned a top overall position in a 2025 comparative test because of its image quality, family-sharing functions and unlimited cloud storage.
- An 11-inch challenger differentiated itself with 32GB of internal storage, 2K resolution and support for SD cards, USB-A and USB-C, showing how smaller brands compete through hardware value.
- Large-display brands compete in a different segment; tested digital art frames reached 27 inches, while mainstream family-photo products generally remained within the 10- to 15-inch range.
Primary Uses of Digital Picture Frames Statistics
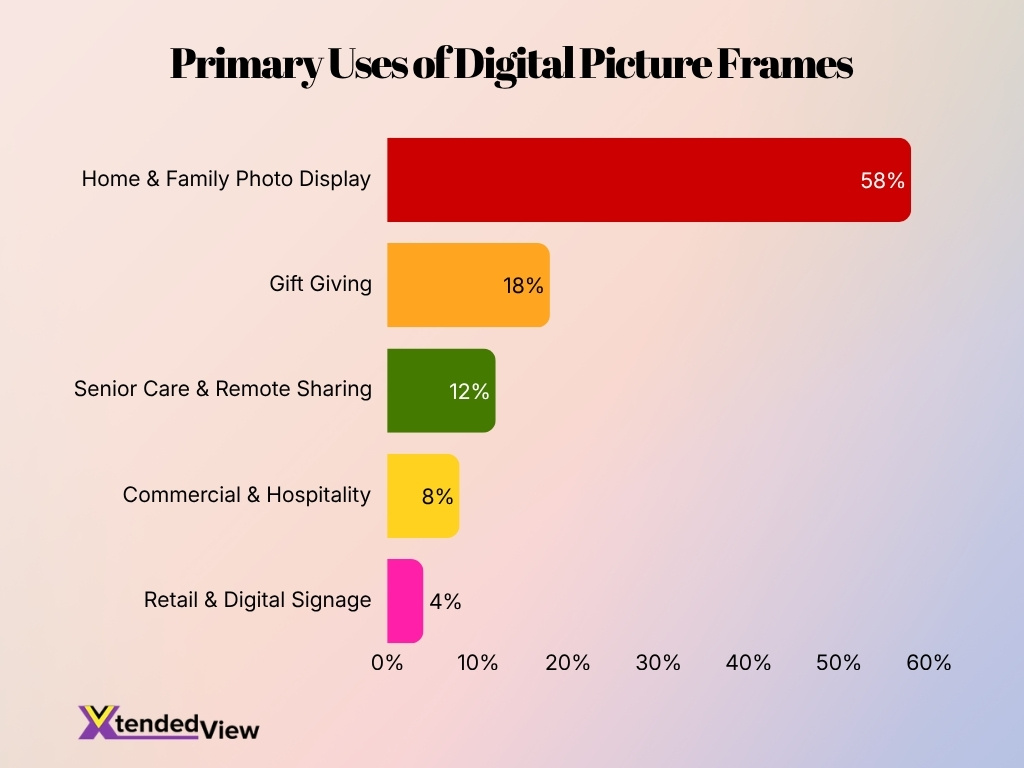
- Home & Family Photo Display is the largest use case, accounting for 58% of digital picture frame usage, highlighting strong demand for personal photo sharing and home décor.
- Gift Giving represents 18% of the market, making it the second most common use case as digital picture frames remain a popular gift for family members and special occasions.
- Senior Care & Remote Sharing contributes 12%, reflecting the growing adoption of connected digital frames that enable families to share photos remotely with older adults.
- Commercial & Hospitality applications account for 8%, demonstrating the increasing use of digital picture frames in hotels, offices, and business environments for visual displays.
- Retail & Digital Signage holds the smallest share at 4%, indicating that while commercial advertising is a growing segment, consumer and family-focused applications continue to dominate the market.
- Together, Home & Family Photo Display (58%), Gift Giving (18%), and Senior Care & Remote Sharing (12%) make up 88% of all primary use cases, emphasizing the market’s strong focus on personal and family-oriented experiences.
Pricing Statistics
- Mainstream 10-inch Wi-Fi frames typically sell for $100 to $200.
- Models with larger screens or higher resolution commonly exceed $200.
- A premium 9.7-inch frame carries a listed price of roughly $199.
- Entry-level models increasingly offer 32GB of internal storage to stay competitive.
- Larger 15-inch models command higher prices for Full HD resolution and extra materials.
- Premium digital art frames feature screen sizes reaching up to 27 inches.
- One notable frame platform has converted 500,000 users into paid subscribers.
- Seasonal holiday discounts can cut digital frame prices by more than one-third.
Consumer Buying Behavior Statistics
- 10- to 15-inch models offer the strongest balance of visibility, placement, and price.
- Current models feature resolutions from 1280-by-800 up to sharper 2K displays.
- High-resolution 2K displays are primarily utilized on 11- and 12-inch frames.
- A 2025 U.S. survey found that 53% of respondents cited price as a major barrier.
- In the same survey, 33% of consumers expressed strong privacy concerns.
- About 23% of homeowners worried about potential device malfunctions.
- A significant 64% of respondents described energy efficiency as an important consideration.
- Only 17% of smart-home users identified themselves as early adopters.
Top Challenges Facing the Digital Picture Frame Market
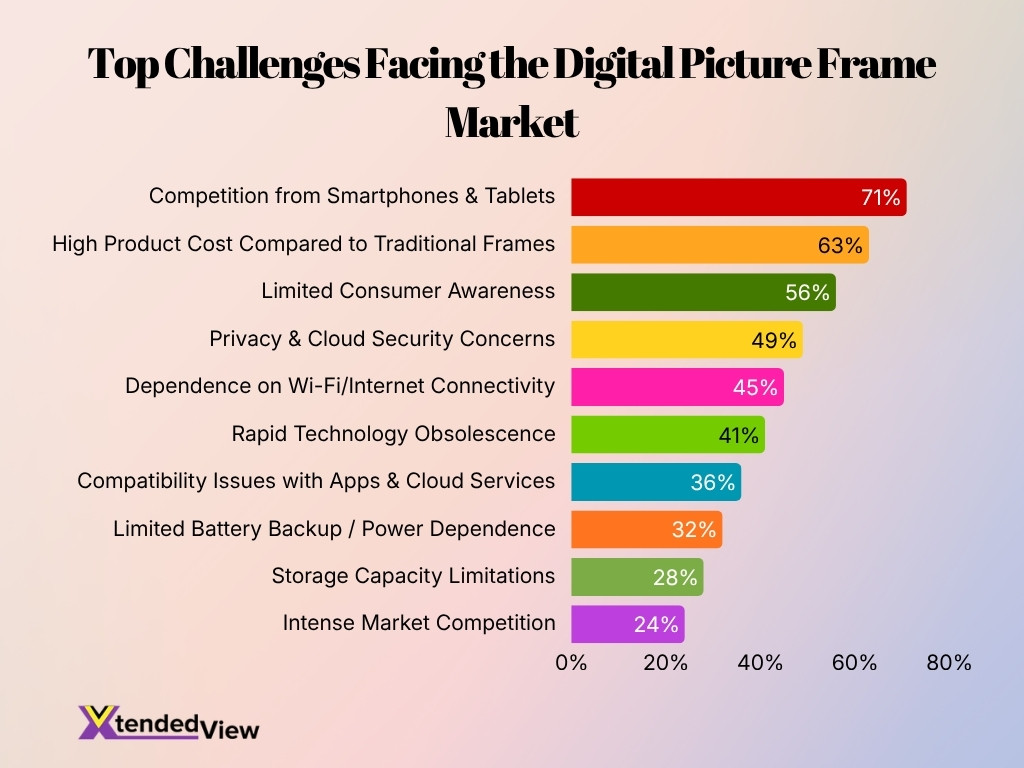
- Competition from smartphones and tablets is the biggest challenge, with 71% of manufacturers and consumers reporting that multifunctional mobile devices reduce the need for dedicated digital picture frames.
- High product costs compared to traditional photo frames remain a significant barrier, cited by 63% of respondents, making affordability a key concern for wider consumer adoption.
- Limited consumer awareness affects market growth, with 56% reporting that many potential buyers are still unfamiliar with the features and benefits of modern digital picture frames.
- Privacy and cloud security concerns influence purchasing decisions for 49% of users, highlighting the importance of secure photo storage and data protection.
- Dependence on Wi-Fi and internet connectivity is a challenge for 45% of respondents, as many smart frame features require a stable online connection to function effectively.
- Rapid technology obsolescence concerns 41% of manufacturers and consumers, reflecting worries about devices becoming outdated as display and smart technologies evolve.
- Compatibility issues with apps and cloud services impact 36% of respondents, indicating that seamless integration across platforms remains an area for improvement.
- Limited battery backup and reliance on continuous power affect 32% of users, reducing portability and flexibility in certain usage scenarios.
- Storage capacity limitations are reported by 28% of respondents, showing that onboard memory constraints can restrict the number of photos and videos stored locally.
- Intense market competition is identified by 24% of respondents, as manufacturers compete through pricing, product features, and ecosystem integration to attract customers.
Future Outlook
- A conservative forecast expects the digital picture frame market to add $126.4 million from 2025 to 2030, expanding at a 3.2% CAGR.
- Another forecast projects the market will rise from $64.5 million in 2025 to $82.1 million by 2032, representing a 3.5% CAGR.
- A separate estimate places the market at $866.4 million in 2025 and forecasts $1.32 billion by 2031, reflecting a much faster 7.9% CAGR under a broader market definition.
- The wide gap among forecasts means readers should compare scope and methodology rather than treat any single valuation as a definitive industry total.
- North America is expected to generate 45.9% of forecast market growth through 2030, supported by connected households, online retail access and strong smart-home spending.
- The broader smart-home market is forecast to grow from $147.52 billion in 2025 to $848.47 billion by 2034, creating a larger ecosystem in which connected frames can integrate with calendars, speakers, lighting and home-control platforms.
- Artificial intelligence will likely shift from a promotional feature to a standard function as manufacturers automate photo selection, cropping, duplication control and slideshow personalization.
- E-ink, low-power displays and battery-operated frames may expand wall-mounted adoption by reducing power-cord dependence and creating a more traditional framed-print appearance.
- Commercial growth will come from healthcare, senior living, hospitality, offices and retail environments that need remotely updated visual content without the complexity of full digital-signage systems.
- Future winners will likely combine simple setup, clear privacy controls, long software support and subscription-free core functions rather than competing on screen specifications alone.
Frequently Asked Questions (FAQs)
The global digital picture frame market is projected to reach $4.82 billion by 2032, growing from $2.63 billion in 2026.
The market is forecast to expand at a 10.37% CAGR between 2026 and 2032, according to one of the latest global market forecasts.
The U.S. digital photo frame market is estimated at $195.6 million in 2025, making it one of the largest national markets worldwide.
North America is expected to account for 45.9% of global digital picture frame market growth through 2030.
The global digital photo frame market is forecast to grow by $126.4 million between 2025 and 2030, at a 3.2% CAGR.
Conclusion
Digital picture frames have evolved into connected smart displays that serve households, healthcare providers, hospitality businesses and commercial environments alike. Growing demand for Wi-Fi connectivity, cloud sharing, AI-powered photo management and smart-home integration continues to drive market expansion despite competition from smartphones and multifunction displays. While pricing, privacy and software support remain important buying considerations, long-term forecasts indicate steady industry growth through the next decade. Companies that deliver intuitive user experiences, dependable connectivity and strong privacy protections will be best positioned to capture future demand.
