
The smartphone market remains one of the world’s largest consumer technology industries, connecting billions of people to digital services, mobile payments, entertainment, and artificial intelligence tools. Smartphone sales also shape industries such as e-commerce and mobile banking, where consumers increasingly rely on mobile devices to shop, pay, and access financial services.
As vendors race to add AI capabilities and premium features, understanding the latest smartphone sales data reveals where the market is heading and which brands are winning the competition. Explore the latest statistics and trends shaping the global smartphone industry.
Editor’s Choice
- Global smartphone shipments reached approximately 1.26 billion units in 2025, up nearly 2% from the previous year.
- The worldwide smartphone market generated more than $608 billion in revenue in 2025.
- Apple accounted for around 25% of global smartphone shipments in Q4 2025, its highest quarterly share on record.
- Samsung shipped 61.2 million smartphones in Q4 2025, representing 18.2% of the global market.
- Global smartphone shipments increased 2.6% year over year in Q3 2025, reaching 322.7 million units.
- More than 94% of global smartphone shipments in 2025 came from the top 10 manufacturers.
- The smartphone market is projected to surpass $1 trillion in annual value by 2033, driven by premium devices and AI-powered features.
Recent Developments
- Omdia expects global smartphone shipments to decline by 7% in 2026 due to rising memory costs and weaker consumer demand.
- IDC forecasts a 0.9% decline in smartphone shipments during 2026, following growth in 2025.
- AI-enabled smartphones emerged as one of the fastest-growing categories in 2025, especially in devices priced above $250.
- Samsung’s Galaxy Z Fold 7 became the company’s fastest-selling foldable device in Western Europe during 2025.
- Apple recorded nearly 3% shipment growth in Q3 2025, driven by strong demand for the iPhone 17 lineup.
- India’s smartphone shipments increased 7% year over year in Q2 2025, reaching 39 million units.
- Africa’s smartphone shipments grew 3% in the first quarter of 2026, despite expectations of a weaker full-year market.
- The Middle East and Africa emerged as key growth regions during 2025, supported by financing models and rising digital adoption.
- Premium smartphones continued gaining momentum as consumers increasingly upgraded to AI-capable devices.
Global Smartphone Sales Overview
- Around 1.26 billion smartphones were shipped worldwide in 2025.
- The global smartphone market grew for the second consecutive year in 2025 after rebounding from the slowdown experienced in 2022 and 2023.
- Smartphone shipments rose 2.3% year over year in Q4 2025, totaling 336.3 million units.
- Global smartphone shipments reached 322.7 million units in Q3 2025, reflecting a 2.6% increase from the previous year.
- Apple and Samsung together accounted for more than 43% of worldwide smartphone shipments in late 2025.
- The global smartphone market value stood at approximately $608.85 billion in 2025.
- The average smartphone replacement cycle exceeded 40 months in several mature markets, contributing to slower industry growth.
- More than 6.9 billion people worldwide now own a smartphone, representing the majority of the global population.
- The smartphone industry remains one of the largest consumer electronics sectors, accounting for hundreds of billions of dollars in annual sales.
Global Smartphone Shipment Trends Since 2019
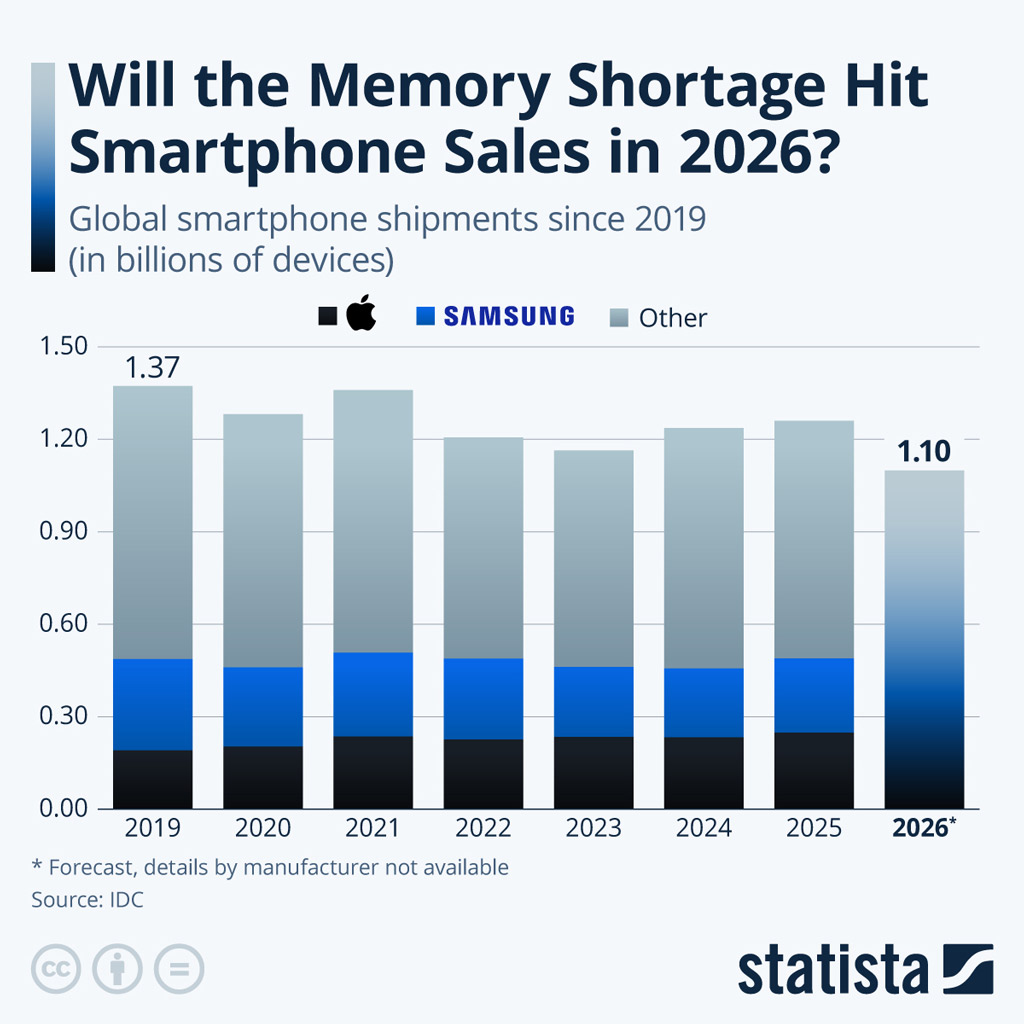
- Global smartphone shipments reached 1.37 billion devices in 2019, the highest level shown in the chart.
- Shipments declined to approximately 1.28 billion units in 2020, reflecting a year-over-year slowdown.
- The market rebounded to around 1.36 billion devices in 2021, nearly matching 2019 levels.
- Global smartphone shipments fell to about 1.20 billion units in 2022, reversing the previous year’s recovery.
- Shipments dropped further to approximately 1.16 billion devices in 2023, marking the lowest actual level in the period.
- The market recovered to roughly 1.23 billion smartphones in 2024, showing renewed growth.
- Smartphone shipments increased again to around 1.25 billion units in 2025, continuing the recovery trend.
- 2026 shipments are forecast to decline sharply to 1.10 billion devices, the lowest figure on the chart.
- The chart indicates that Apple, Samsung, and other manufacturers collectively account for global smartphone shipments.
- IDC notes that 2026 manufacturer-specific shipment details are unavailable because the figures are forecast estimates.
Historical Smartphone Sales Trends
- Global smartphone shipments fell to a decade low in 2023, marking one of the weakest years for the industry.
- Smartphone sales recovered in 2024, growing between 4% and 7% depending on the research methodology.
- Global shipments increased by 2% in 2025, reaching their highest annual level since 2021.
- Around 20.4 billion smartphones were sold globally between 2009 and 2025.
- Smartphone sales crossed 1 billion units annually for the first time in 2013.
- The industry reached its historic peak of approximately 1.56 billion units in 2018 before entering a multi-year slowdown.
- The COVID-19 pandemic accelerated replacement cycles and created a temporary demand surge in 2020 and 2021.
- The market entered a correction phase in 2022 and 2023 due to inflation, supply chain disruptions, and economic uncertainty.
- The rise of AI smartphones in 2025 and 2026 is creating a new replacement cycle across premium devices.
Regional Smartphone Sales Breakdown
- Asia-Pacific captured a dominant 47.9% revenue share of the global smartphone market in 2025.
- China’s smartphone shipments experienced a 2% year-over-year decline in Q2 2025 amid fragile demand.
- India shipped 48 million smartphone units in Q3 2025, achieving its highest quarterly volume in five years.
- India’s smartphone market recorded a solid 9% year-over-year growth during Q2 2025.
- Africa’s smartphone shipments increased by 3% to reach 19.9 million units in the first quarter of 2026.
- The Middle East and Africa posted an impressive 14% year-over-year shipment growth in Q3 2025.
- North America saw an 8% year-over-year growth in Q1 2025, heavily driven by premium device upgrades.
- Japan maintained strong momentum with a 15% year-over-year growth in Q3 2025.
- Latin America and Europe recorded a steady 4% year-over-year growth in Q2 2025.
Smartphone Sales by Vendor
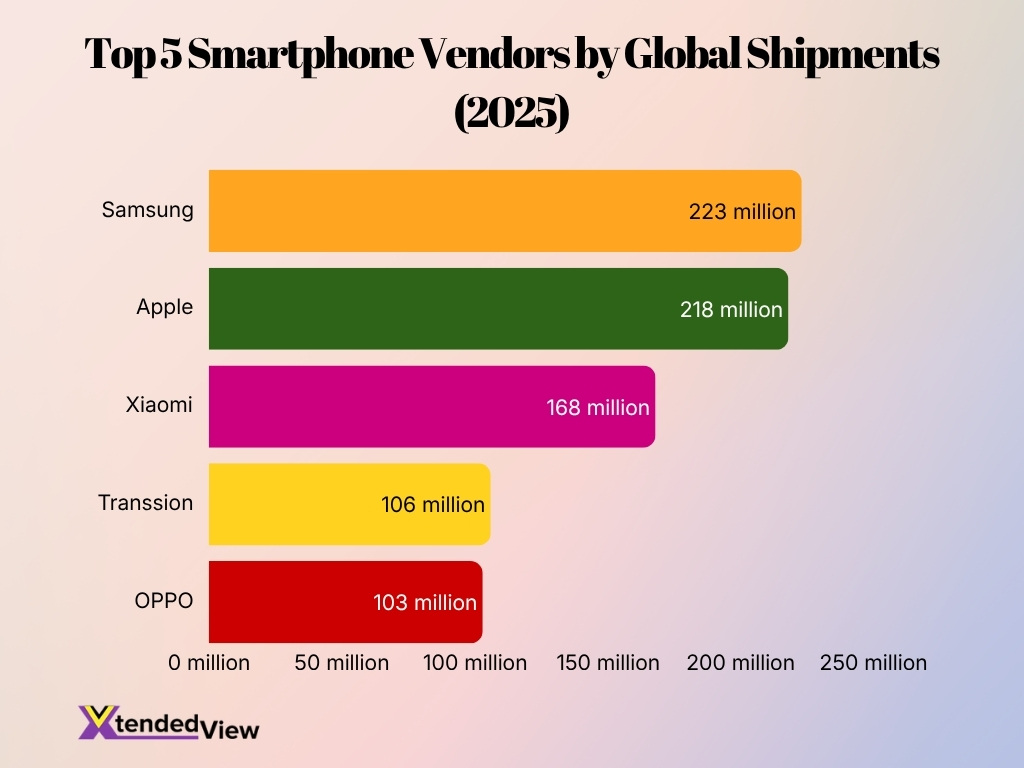
- Samsung shipped approximately 223 million smartphones in 2025, retaining the top position globally.
- Apple delivered around 218 million iPhones in 2025, narrowing the gap with Samsung to fewer than 5 million units.
- Xiaomi ranked third with nearly 168 million smartphone shipments worldwide in 2025.
- Transsion shipped more than 106 million smartphones in 2025, driven by strong demand in Africa and emerging markets.
- OPPO rounded out the top five with roughly 103 million units shipped during 2025.
- The top five smartphone vendors collectively accounted for more than 70% of global shipments in 2025.
- Apple recorded the strongest growth among premium smartphone vendors in late 2025, helped by demand for AI-ready iPhones.
- Chinese smartphone manufacturers increased their combined market share to over 50% of global shipments in 2025.
- Smaller vendors outside the top five continued losing share as the market consolidated around a handful of global brands.
Smartphone Sales by Operating System
- Android maintained a dominant position with approximately 71% of global smartphone shipments in 2025.
- iOS accounted for around 28% of worldwide smartphone shipments during 2025.
- Android powers more than 3.9 billion active devices globally, making it the world’s largest mobile operating system.
- iOS remained particularly strong in North America, where it captured over 57% of the smartphone market.
- In Japan, iOS represented nearly 68% of smartphone users, one of Apple’s strongest regional performances.
- Android dominated markets such as India, Africa, and Latin America with market shares exceeding 85% in several countries.
- Huawei’s HarmonyOS surpassed 1 billion cumulative installations across smartphones and connected devices by 2025.
- Android devices represented nearly 95% of smartphone shipments in India during 2025.
- The growth of AI features has encouraged both Android and iOS vendors to prioritize on-device generative AI capabilities.
Smartphone Sales by Price Segment
- Smartphones priced above $600 accounted for nearly 25% of global shipments in 2025, their highest share on record.
- Premium smartphone sales grew by approximately 8% year over year in 2025, outpacing the overall market.
- Devices priced below $200 represented more than 40% of worldwide smartphone shipments in 2025.
- The ultra-premium category above $1,000 generated more than one-third of total smartphone revenue globally.
- Apple’s iPhone lineup captured over 70% of global premium smartphone sales in 2025.
- Mid-range smartphones priced between $200 and $400 remained the largest category in emerging markets.
- AI-enabled smartphones increasingly entered the $400 to $800 price range, helping manufacturers boost margins.
- The average selling price of premium smartphones exceeded $900 in North America during 2025.
- Consumers in developed markets continued upgrading toward higher-priced devices with longer replacement cycles.
Smartphone Sales by Online vs Offline Channels
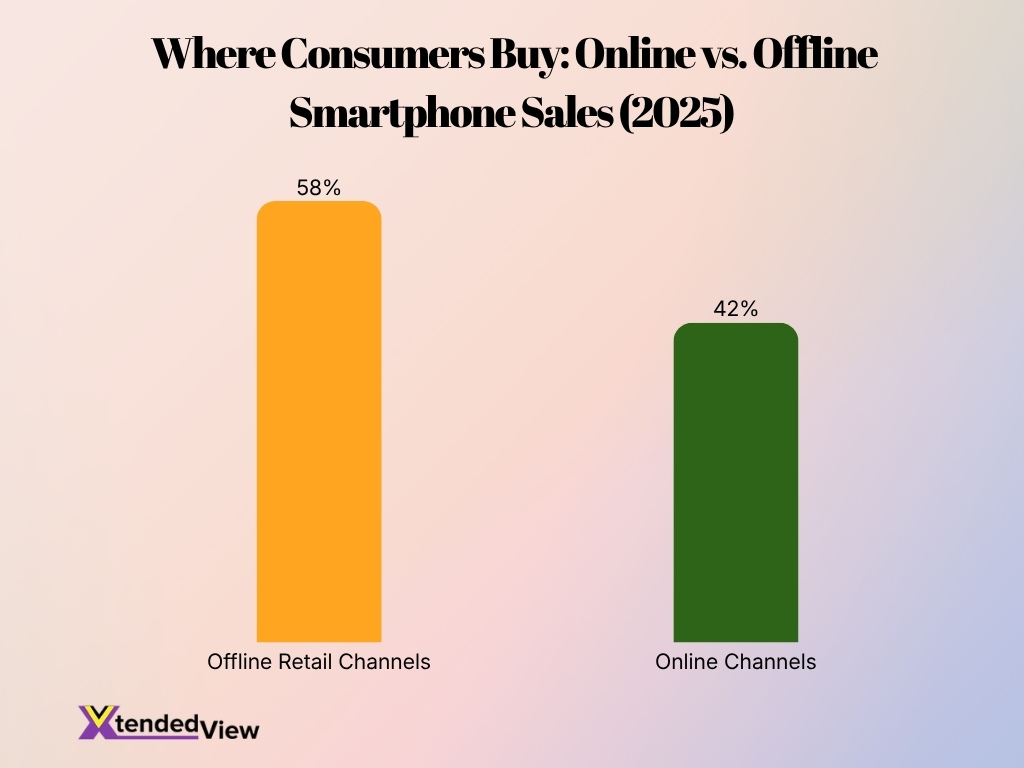
- Offline retail channels accounted for approximately 58% of global smartphone sales in 2025.
- Online smartphone sales represented roughly 42% of worldwide shipments, continuing a multi-year expansion.
- India recorded one of the world’s highest online smartphone sales shares, with nearly 50% of devices sold through e-commerce channels.
- Amazon and Flipkart remained dominant online smartphone sales platforms in India during 2025.
- Offline channels continued to dominate premium smartphone sales due to in-store demonstrations and financing options.
- More than 70% of smartphone sales in the United States still occurred through carrier stores and physical retailers.
- Direct-to-consumer online sales increased as brands invested in their own websites and digital storefronts.
- Southeast Asia recorded strong growth in social commerce and live-stream shopping for smartphones during 2025.
- Omnichannel purchasing strategies became increasingly common, with consumers researching online before buying in physical stores.
Smartphone Sales by Device Type (5G vs 4G and Others)
- Global 5G smartphone shipments exceeded 830 million units in 2025, accounting for roughly two-thirds of all smartphones sold.
- 5G devices represented approximately 67% of worldwide smartphone shipments in 2025.
- Shipments of 4G smartphones continued declining and accounted for roughly 31% of total sales in 2025.
- More than 2.5 billion people worldwide now use a 5G smartphone.
- China remained the world’s largest 5G smartphone market, representing over one-third of global 5G shipments.
- Nearly 85% of smartphones sold in China during 2025 supported 5G connectivity.
- North America recorded one of the highest 5G adoption rates, with more than 90% of smartphone shipments featuring 5G capability.
- Entry-level 5G smartphones priced below $200 gained significant momentum in India and Southeast Asia during 2025.
- Analysts expect 5G smartphones to exceed 75% of global shipments by 2027.
Smartphone Sales by Form Factor (Foldable vs Non-Foldable)
- Global foldable smartphone shipments reached approximately 19.3 million units in 2025, a record for the category.
- Foldable smartphones represented around 1.5% of total smartphone shipments worldwide in 2025.
- Samsung retained the leading position in foldable smartphones with nearly 45% market share.
- Chinese brands such as Huawei, Honor, and Xiaomi collectively captured more than 40% of foldable shipments during 2025.
- The average selling price of foldable smartphones remained above $1,000 in 2025.
- Book-style foldables generated a larger share of revenue despite lower shipment volumes than clamshell models.
- Analysts project foldable smartphone shipments to surpass 30 million units by 2027.
- Non-foldable smartphones still represented more than 98% of all smartphones sold globally in 2025.
- Improved durability and lower prices are expected to accelerate foldable adoption during the next several years.
World’s Top 5 Smartphone Brands by Market Share (January 2026)
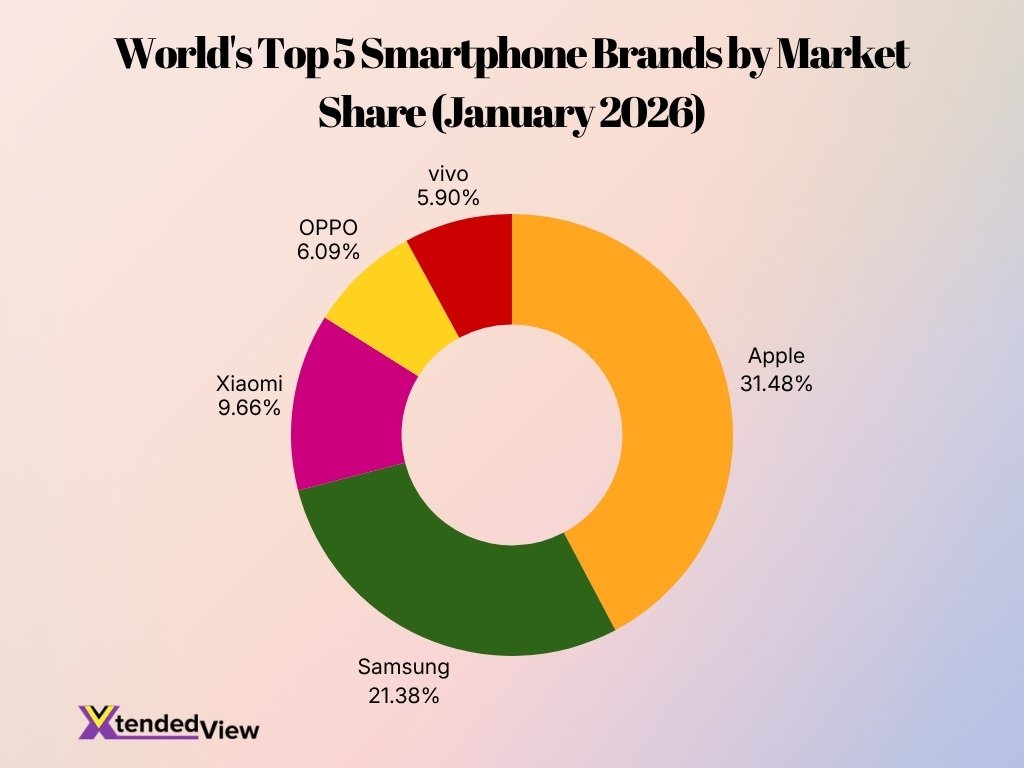
- Apple led the smartphone market with a 31.48% market share, making it the top smartphone brand in January 2026.
- Samsung ranked second with a 21.38% market share, remaining Apple’s closest competitor.
- Apple held a 10.10 percentage point lead over Samsung, highlighting its strong market position.
- Xiaomi secured the third position with a 9.66% share of the global smartphone market.
- OPPO accounted for 6.09% of the market, placing it in fourth place among leading smartphone brands.
- Vivo rounded out the top five with a 5.90% market share in January 2026.
- The top two brands, Apple and Samsung, together controlled 52.86% of the smartphone market.
- The top five smartphone brands collectively captured 74.51% of the total market share.
- Chinese smartphone brands (Xiaomi, OPPO, and vivo) together represented 21.65% of the market.
- The data shows that Apple and Samsung continued to dominate the smartphone industry, while Chinese manufacturers maintained a significant combined presence.
Top-Selling Smartphone Brands
- Samsung remained the world’s largest smartphone vendor in 2025, shipping approximately 223 million units globally.
- Apple ranked second with around 218 million iPhone shipments in 2025, its highest annual total since 2021.
- Xiaomi retained third place with nearly 168 million smartphones shipped worldwide.
- Transsion surpassed 100 million annual shipments for the first time, driven by growth in Africa and South Asia.
- OPPO shipped more than 103 million smartphones in 2025, maintaining a top-five position globally.
- Chinese smartphone manufacturers collectively accounted for over 50% of global smartphone shipments during 2025.
- Samsung led smartphone sales in Europe and Latin America, while Apple dominated North America and Japan.
- Apple generated more smartphone revenue than any other brand despite shipping fewer devices than Samsung.
- Premium smartphone demand helped Apple and Samsung capture the majority of industry profits in 2025.
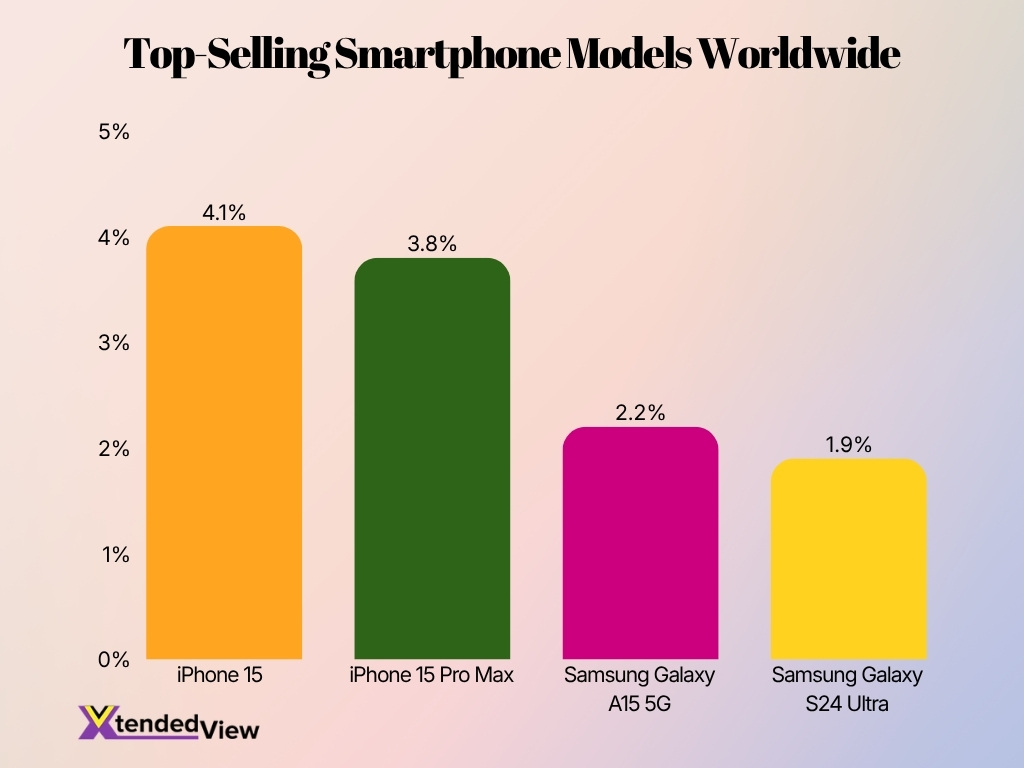
Top-Selling Smartphone Models
- The iPhone 15 became the world’s best-selling smartphone with a 4.1% global market share during the first half of 2025.
- The iPhone 15 Pro Max ranked as the second-best-selling smartphone globally by capturing 3.8% of total sales in early 2025.
- Apple’s Pro-series devices generated a massive 50% of all iPhone sales worldwide throughout the year 2025.
- Samsung’s Galaxy A15 5G emerged as a top-selling Android device, securing 2.2% of overall global shipment volume.
- The Galaxy S24 Ultra ranked among the top premium smartphones by taking 1.9% of the worldwide market sales in 2025.
- Xiaomi’s Redmi 13 series became a hugely popular budget family with over 15 million units shipped across Asia and Europe.
- Apple’s top smartphone models accounted for an impressive 20% of total global smartphone sales during 2025.
- Premium smartphones priced above $800 generated 60% of industry revenue despite representing just an 18% unit share.
- Foldable models like the Galaxy Z Flip series achieved record volumes exceeding 10 million total units sold during 2025.
Average Selling Price of Smartphones
- The global smartphone average selling price reached approximately $480 in 2025, up from around $460 in 2024.
- Premiumization helped push smartphone average selling prices to their highest level on record.
- The average selling price of smartphones in North America exceeded $790 in 2025.
- Foldable smartphones maintained an average selling price above $1,000 globally.
- Apple’s iPhone average selling price remained above $900, substantially higher than most Android competitors.
- Devices priced above $600 generated nearly 60% of global smartphone revenue in 2025.
- Entry-level smartphone prices remained under $200 across much of Africa and South Asia.
- AI-enabled features encouraged consumers to upgrade to higher-priced devices in 2025 and early 2026.
- Analysts expect smartphone average selling prices to continue rising through 2027 because of AI capabilities and premium components.
Revenue from Smartphone Sales
- Global smartphone industry revenue exceeded $608 billion in 2025.
- Smartphone revenue is projected to surpass $630 billion in 2026.
- Apple captured more than 45% of worldwide smartphone revenue in 2025 despite shipping fewer devices than Samsung.
- The premium smartphone segment generated more than two-thirds of industry profits during 2025.
- Smartphones priced above $1,000 represented less than 10% of unit sales but generated nearly one-third of global smartphone revenue.
- Global smartphone app and services ecosystems generated hundreds of billions of dollars in additional revenue beyond device sales.
- The smartphone market is expected to grow at a compound annual rate exceeding 6% through 2033.
- North America remained the highest-revenue smartphone region due to strong premium device demand.
- AI-powered smartphones are expected to create new revenue opportunities through subscription services and on-device AI applications.
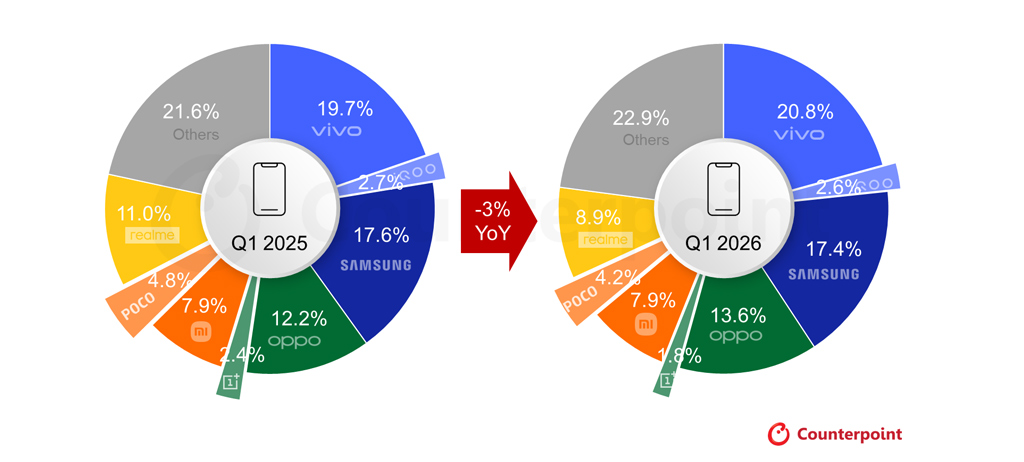
India’s Smartphone Market Share by Brand
- vivo remained the market leader with a 20.8% share in Q1 2026, up from 19.7% in Q1 2025.
- Samsung held the second-largest market share at 17.4%, a slight decline from 17.6% a year earlier.
- OPPO recorded the strongest growth among the top brands, increasing its share from 12.2% to 13.6%.
- Xiaomi maintained a stable market share of 7.9% in both Q1 2025 and Q1 2026.
- realme experienced the largest decline among major brands, dropping from 11.0% to 8.9%.
- POCO’s market share fell from 4.8% in Q1 2025 to 4.2% in Q1 2026.
- OnePlus saw its market share decrease from 2.4% to 1.8% year over year.
- iQOO reported a slight decline, moving from 2.7% to 2.6% in Q1 2026.
- The Others category expanded from 21.6% to 22.9%, indicating stronger competition from smaller smartphone brands.
- India’s overall smartphone market shipments declined by 3% year over year during Q1 2026 despite gains by leading brands.
Refurbished and Second-Hand Smartphone Sales
- The global refurbished smartphone market shipped approximately 309 million units in 2025.
- Refurbished smartphone sales grew by around 5% year over year during 2025.
- The second-hand smartphone market generated more than $72 billion in revenue in 2025.
- Apple devices accounted for nearly half of all refurbished smartphone sales globally.
- The average selling price of refurbished smartphones increased by about 6% in 2025 because of strong demand for premium devices.
- Trade-in programs became one of the primary drivers of refurbished smartphone supply in North America and Europe.
- Emerging markets increasingly adopted refurbished smartphones because of affordability and sustainability concerns.
- The refurbished smartphone market is expected to exceed 400 million annual shipments by the end of the decade.
- Environmental regulations and right-to-repair initiatives are expected to further boost second-hand smartphone sales.
Future Trends in Smartphone Sales and Shipments
- IDC expects global smartphone shipments to decline by around 0.9% in 2026, reflecting slower consumer spending.
- Omdia forecasts a steeper 7% decline in 2026 shipments due to rising memory prices and economic pressures.
- AI smartphones are projected to account for more than 30% of global smartphone shipments by 2027.
- Foldable smartphone shipments are expected to surpass 30 million units by 2027.
- 5G smartphones should represent more than 75% of global shipments by 2027.
- The smartphone market is forecast to exceed $1 trillion in value by 2033.
- Premium devices will likely continue outpacing the broader market because consumers keep their phones longer and upgrade less frequently.
- On-device artificial intelligence, satellite communication, and generative AI assistants are expected to become standard smartphone features.
- Sustainability initiatives, including repairability and refurbished devices, will increasingly shape consumer purchasing decisions.
Frequently Asked Questions (FAQs)
Global smartphone shipments reached approximately 1.25 to 1.26 billion units in 2025, representing about 2% year-over-year growth.
The global smartphone market was valued at around $599 billion to $608 billion in 2025.
Apple led the global smartphone market in 2025, capturing around 25% of Q4 shipments, while Samsung held approximately 18% of the annual market share.
IDC estimated that more than 370 million GenAI smartphones would ship in 2025, accounting for roughly 30% of global smartphone shipments.
The global smartphone market is projected to grow at a 4.3% to 7.3% CAGR through the early-to-mid 2030s, depending on the forecast methodology.
Conclusion
The smartphone industry entered the year with renewed momentum after recovering from several challenging years. However, shipment growth remains uneven across regions and vendors, and analysts expect economic pressures to slow demand in the near term. At the same time, artificial intelligence, premium devices, and foldable designs are creating new opportunities for manufacturers and consumers alike.
Although annual shipment growth may moderate, smartphones continue to generate hundreds of billions of dollars in revenue and remain central to digital life worldwide. Companies that successfully combine AI capabilities, premium experiences, and affordability will likely define the next phase of smartphone growth.