
Google Pay remains one of the world’s most widely used digital payment platforms, serving consumers across retail, e-commerce, transportation, bill payments, and peer-to-peer transfers. Its influence is especially visible in India, where it plays a central role in the Unified Payments Interface (UPI) ecosystem, while also supporting contactless payments and online checkout experiences in several international markets. As digital commerce continues to expand, Google Pay statistics provide valuable insights into payment behavior, fintech innovation, and mobile wallet adoption. Explore the latest figures to understand how Google Pay is shaping the future of digital payments.
Editor’s Choice
- Google Pay processed approximately 7.5 billion UPI transactions in December 2025, accounting for 34.64% of total UPI transaction volume.
- Google Pay represented 34.25% of the total UPI transaction value in December 2025.
- In November 2025, Google Pay processed 7.03 billion transactions, maintaining its position as India’s second-largest UPI application.
- Google Pay held roughly 35% of India’s UPI market share by transaction volume during late 2025.
- UPI accounted for approximately 49% of global real-time payment transaction volume in 2025, making Google Pay a major participant in the world’s largest instant-payment ecosystem.
- India’s UPI network processed more than 208.8 billion annual transactions in 2025, creating the largest transaction environment for Google Pay globally.
- October 2025 recorded a new UPI high of 20.7 billion monthly transactions, highlighting the scale of platforms such as Google Pay.
Recent Developments
- Google Pay maintained its position as the second-largest UPI application throughout 2025 with more than one-third of transaction volume.
- In October 2025, Google Pay processed approximately 716.5 crore (7.165 billion) transactions through the UPI network.
- Google Pay’s UPI market share stood at 35.2% in October 2025, slightly lower than September’s 35.4%.
- During November 2025, Google Pay controlled 34.4% of UPI transaction volume and an identical share of transaction value.
- Google Pay and PhonePe together accounted for roughly 81% of all UPI transactions in India during 2025.
- UPI Autopay transaction volume doubled year over year in 2025, creating additional recurring-payment opportunities for Google Pay users.
- NPCI continued expanding UPI internationally during 2025, increasing potential cross-border use cases for Google Pay.
- UPI crossed 640 million daily transactions globally, surpassing Visa’s daily transaction count and strengthening the ecosystem in which Google Pay operates.
- Google continued integrating payment experiences with Android services, helping maintain Google Pay’s relevance across mobile commerce and contactless payments.
General Google Pay Statistics
- Google Pay is available across multiple regions and supports both online and in-store contactless payments through NFC-enabled devices.
- Google Pay remains one of the two dominant applications in India’s UPI ecosystem, alongside PhonePe.
- Google Pay processed more than 7 billion monthly UPI transactions during several months of 2025.
- The platform consistently maintained between 34% and 35% market share in India’s UPI transaction ecosystem during late 2025.
- Google Pay benefits from Android’s massive global smartphone footprint, giving it access to billions of potential users.
- UPI, Google Pay’s largest payment rail, handled more than 250 billion annual transactions globally by 2025.
- Google Pay is widely used for person-to-person transfers, QR-code payments, utility bills, retail purchases, and merchant payments.
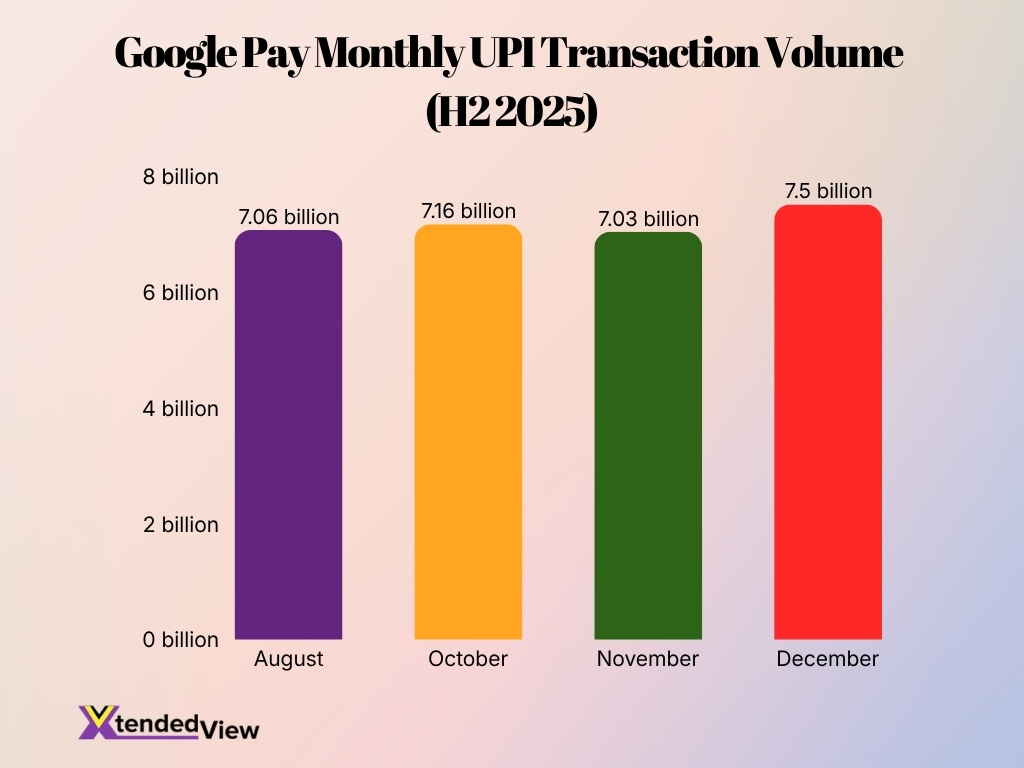
- In August 2025, Google Pay processed approximately 7.06 billion UPI transactions worth ₹8.83 lakh crore.
- Google Pay continues to rank among the most recognized digital wallet brands in India and several international markets.
Google Pay Transaction Volume Statistics
- Google Pay processed approximately 7.5 billion transactions in December 2025.
- In November 2025, Google Pay recorded 7.03 billion UPI transactions.
- October 2025 transaction volume reached approximately 7.165 billion transactions.
- August 2025 transaction volume totaled around 7.06 billion transactions.
- September 2025 saw UPI process 19.63 billion transactions overall, with Google Pay contributing a substantial share.
- October 2025 established a record with 20.7 billion UPI transactions network-wide.
- UPI processed 59.3 billion transactions during Q3 2025, up from 44.4 billion in Q3 2024.
- Annual UPI transaction volume climbed to approximately 208.8 billion transactions in 2025, compared with nearly 140 billion in 2024.
- Google Pay maintained a transaction-volume share ranging between 34% and 35% throughout much of 2025.
Google Pay Transaction Value Statistics
- Google Pay processed transactions worth approximately ₹11.27 lakh crore ($131 billion) in December 2025.
- In November 2025, Google Pay handled transaction value totaling roughly ₹10.68 lakh crore, representing about 34.4% of UPI transaction value.
- October 2025 saw Google Pay facilitate payments worth approximately ₹10.48 lakh crore.
- During August 2025, transaction value on Google Pay reached around ₹8.83 lakh crore, reflecting continued growth in high-value digital payments.
- India’s UPI ecosystem processed over ₹260 lakh crore in transaction value during 2025, with Google Pay accounting for more than one-third of that total.
- Google Pay’s average monthly transaction value exceeded ₹10 lakh crore during the second half of 2025.
- The platform maintained a transaction-value share between 34% and 35% throughout most of 2025.
- UPI transaction value increased by more than 30% year over year in 2025, benefiting major apps such as Google Pay.
- Monthly UPI transaction value crossed ₹24 lakh crore in October 2025, setting a new ecosystem record.
- Compared with 2024, Google Pay’s annual transaction value increased significantly as consumer adoption expanded across merchant and peer-to-peer payments.
Global Google Pay Usage Statistics
- Google Pay serves users across North America, Europe, Asia-Pacific, the Middle East, and other international markets through mobile-wallet functionality.
- UPI represented around 49% of global real-time payment transaction volume in 2025, indirectly supporting Google Pay’s global transaction footprint.
- India’s UPI ecosystem handled roughly 640 million transactions daily in 2025.
- UPI overtook Visa as the world’s largest real-time payment system by daily transaction count.
- More than 500 million active users were associated with the UPI ecosystem, one of Google Pay’s largest user pools.
- UPI transactions exceeded 208.8 billion annually in 2025, up sharply from approximately 140 billion in 2024.
- The number of UPI payment partners increased to 684 institutions in 2025, broadening Google Pay’s banking connectivity.
- Several countries now support UPI-linked payment initiatives, helping expand future international usage opportunities for Google Pay.
- Global real-time payments growth continues to accelerate, with India leading worldwide transaction volumes and Google Pay benefiting from that trend.
Google Pay User Growth in the United States
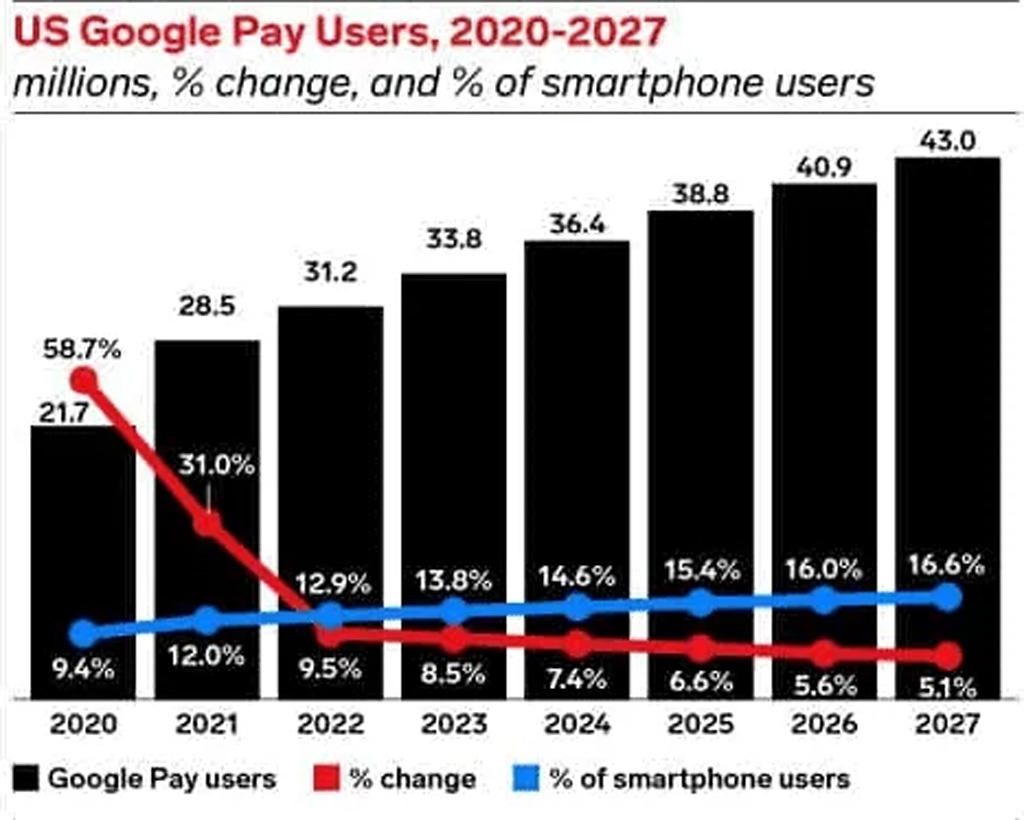
- Google Pay users nearly doubled, rising from 21.7 million in 2020 to 43.0 million in 2027.
- User growth peaked at 58.7% in 2020, before slowing steadily to 5.1% by 2027.
- 2027 is projected to be the first year Google Pay surpasses 43 million U.S. users.
- Google Pay added 21.3 million users between 2020 and 2027, highlighting sustained adoption.
- The largest annual user increase occurred between 2020 and 2021, when the user base grew to 28.5 million.
- Google Pay’s share of smartphone users is expected to climb from 9.4% in 2020 to 16.6% in 2027.
- More than 1 in 6 U.S. smartphone users are projected to use Google Pay by 2027.
- Smartphone penetration reached 15.4% in 2025, marking a significant adoption milestone.
- User growth rates fell below 10% after 2022, indicating a maturing market.
- Google Pay maintained positive year-over-year growth throughout the entire 2020–2027 period.
Google Pay User Demographic Statistics
- Millennials aged 25 to 40 form the largest demographic group by making up 45% of all Google Pay users.
- India accounts for a dominating 62% share of the platform’s 820 million global active users in 2025.
- The platform’s gender distribution shows that male users comprise 55% while female users account for 45%.
- An overwhelming 85% of the total user base falls entirely within the 18 to 45 age group.
- Gen Z demographic adoption experienced a massive 30% surge, primarily driven by peer-to-peer payments.
- Urban residents are responsible for generating 80% of all transaction volumes globally.
- Expanding smartphone access helped rural demographic adoption rates increase by 18% in emerging markets.
- Around 70% of users identify as frequent digital shoppers who rely on the app for e-commerce.
Google Pay Market Share Statistics
- Google Pay held approximately 34.6% of UPI transaction volume in December 2025.
- During November 2025, the platform maintained around 34.4% market share by transaction volume.
- Google Pay accounted for roughly 34.3% of total UPI transaction value in late 2025.
- The gap between Google Pay and the market leader remained below 15 percentage points during most of 2025.
- Google Pay and PhonePe together controlled more than 80% of India’s UPI market throughout 2025.
- The top three UPI applications collectively represented over 95% of all UPI transactions, with Google Pay remaining a key contributor.
- Google Pay’s market share remained relatively stable despite growing competition from BHIM, Paytm, and banking apps.
- The platform consistently ranked as the second-largest UPI application by both transaction volume and transaction value.
- Google’s share remained above one-third of the UPI ecosystem, demonstrating strong consumer loyalty.
- Compared with 2024, Google Pay’s market position showed only minor fluctuations despite rapid ecosystem growth.
UPI App Market Share Highlights
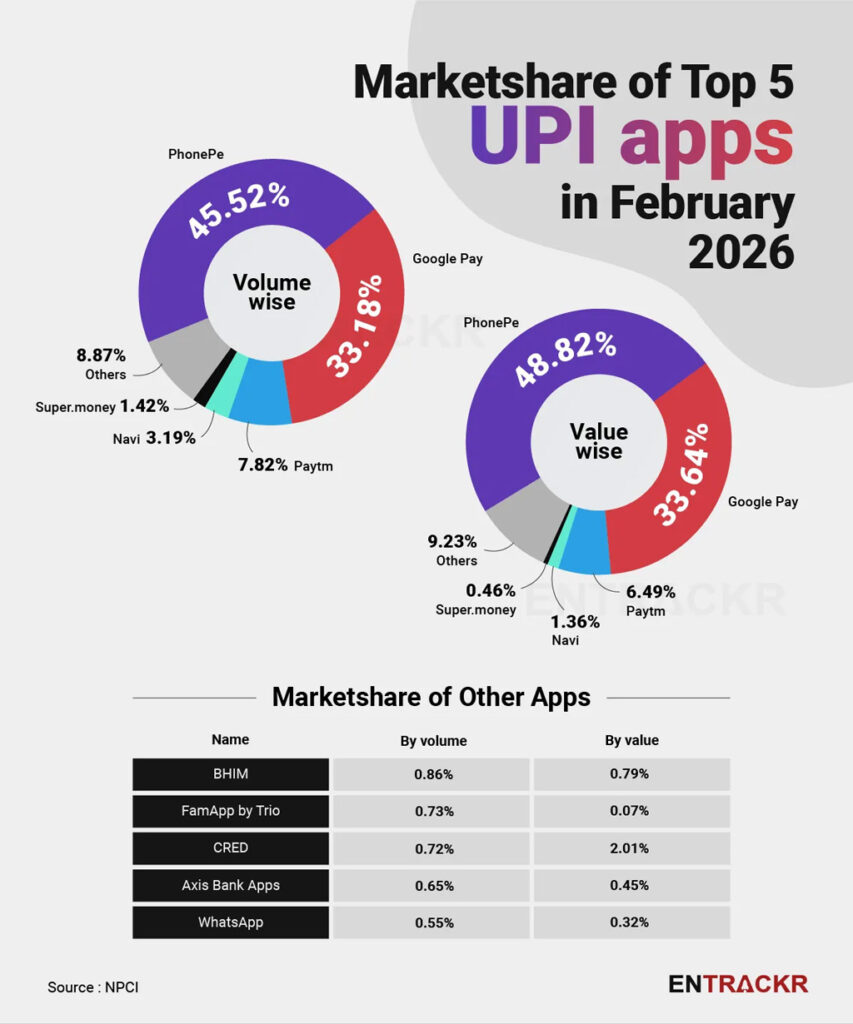
- PhonePe dominated UPI transactions with a 45.52% volume share and 48.82% value share, leading all competitors.
- Google Pay secured the second position with 33.18% by volume and 33.64% by value of total UPI transactions.
- PhonePe and Google Pay together accounted for 78.70% of transaction volume and 82.46% of transaction value.
- Paytm captured 7.82% of UPI volume and 6.49% of transaction value, ranking third among UPI apps.
- Navi held 3.19% of transaction volume but only 1.36% of transaction value, indicating smaller average transaction sizes.
- Super.money recorded a modest 1.42% volume share and 0.46% value share in the UPI ecosystem.
- The Others category represented 8.87% of volume and 9.23% of value, showing continued fragmentation beyond the top apps.
- Among smaller apps, CRED generated the highest value share at 2.01% despite accounting for only 0.72% of transaction volume.
- BHIM contributed 0.86% of UPI volume and 0.79% of transaction value, outperforming several other smaller apps.
- WhatsApp Pay remained a minor player with just 0.55% volume share and 0.32% value share of UPI transactions.
Merchant Acceptance Statistics for Google Pay
- Over 82% of in-store merchants across India accept Google Pay through UPI QR codes.
- UPI merchant transactions surpassed 143.8 billion in 2025, driving a vast Google Pay network.
- Over 90% of organised retail merchants in major Indian cities support UPI-based payments.
- Around 731 million QR codes power the most widely accepted merchant payment method on Google Pay.
- Small and medium businesses account for nearly 85% of all Google Pay merchant transactions.
- Grocery stores and restaurants lead merchant categories with a 27% share of total Google Pay usage.
- Merchant acceptance in Tier-2 and Tier-3 cities witnessed a massive 34% year-on-year growth in 2025.
- Contactless NFC payments on Android devices saw a 6.6% global growth in merchant acceptance.
- Micro-merchant digital payments surged as average transaction ticket sizes dropped to just ₹592.
- Google Pay strengthened its ecosystem by processing over 7 billion monthly transactions via UPI platforms.
Google Pay UPI Statistics in India
- Google Pay processed approximately 7.5 billion UPI transactions in December 2025.
- The platform controlled 34.64% of total UPI transaction volume in December 2025.
- Google Pay accounted for 34.25% of UPI transaction value during the same month.
- UPI processed over 208.8 billion transactions during 2025, representing one of the fastest-growing payment systems globally.
- Monthly UPI transactions surpassed 20 billion for the first time in 2025.
- Daily UPI transaction volume exceeded 640 million payments during late 2025.
- Google Pay remained India’s second-largest UPI application throughout 2025.
- Google Pay handled more than 7 billion monthly transactions across several consecutive months in 2025.
- UPI transaction value exceeded ₹260 lakh crore annually in 2025.
- Google Pay and PhonePe together represented more than four out of every five UPI transactions completed in India.
Google Pay Customer Distribution by Region
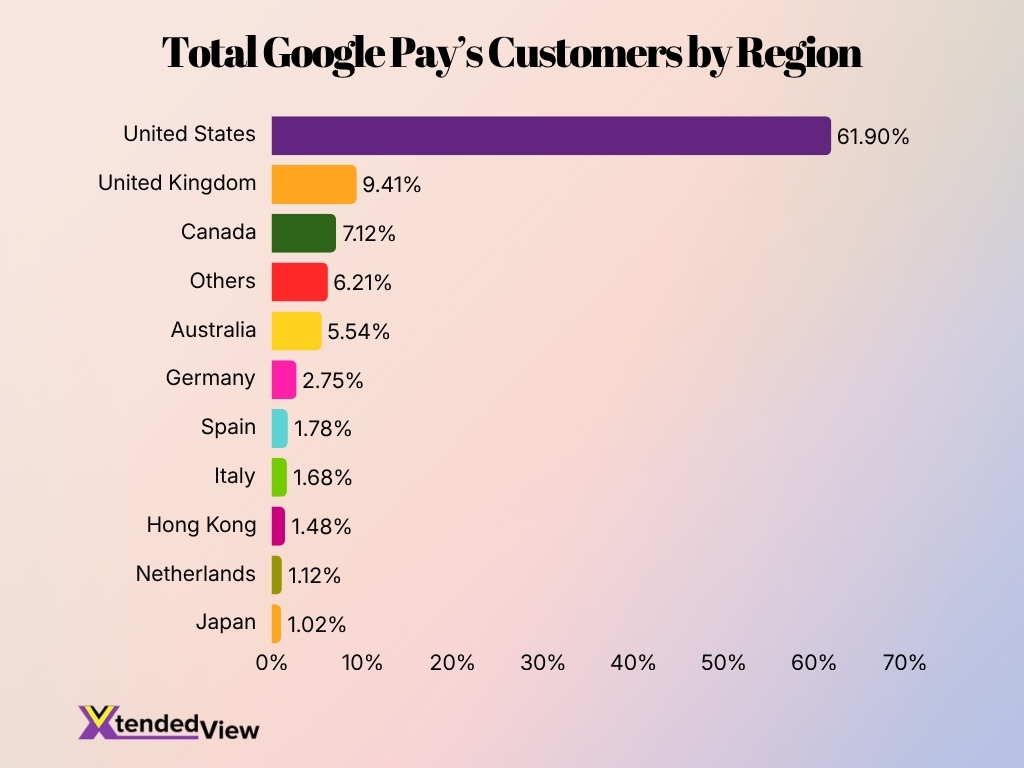
- The United States dominates Google Pay adoption, accounting for a massive 61.90% of all customers worldwide.
- The United Kingdom ranks second with 9.41%, holding a significant lead over other international markets.
- Canada contributes 7.12% of Google Pay’s customer base, making it the third largest market.
- Australia represents 5.54% of total Google Pay users, highlighting strong adoption in Oceania.
- Germany leads continental Europe with 2.75%, ahead of Spain at 1.78% and Italy at 1.68%.
- The top three markets, the United States, the United Kingdom, and Canada, collectively account for 78.43% of all Google Pay customers.
- Spain, Italy, Hong Kong, the Netherlands, and Japan each contribute less than 2% of the global customer base.
- Hong Kong holds 1.48%, while the Netherlands accounts for 1.12% of Google Pay customers.
- Japan records the smallest share among listed countries at 1.02% of total users.
- Other regions collectively contribute 6.21%, indicating a diverse but fragmented global user base.
Google Pay Revenue and Business Performance Statistics
- Google Pay reached 820 million active users globally as of 2025.
- The platform accounted for 18% of the global digital payments sector in 2025.
- India led Google Pay usage with $610 billion in transactions during 2025.
- Google Pay retained a 34.64% market share by transaction volume in India in December 2025.
- The platform recorded 7.5 billion transactions in India during December 2025.
- Google Pay held 34.25% of the overall transaction value in the Indian UPI ecosystem in December 2025.
- The Google Pay app achieved 5.2 billion installations worldwide by 2025.
- Over 6.4 million merchants globally integrated the payment platform in 2025.
- Artificial intelligence fraud detection stopped $1.4 billion in fraudulent transactions in 2025.
Google Pay Security and Authentication Statistics
- Google Pay’s AI systems actively prevent fraudulent transactions worth over ₹1,100 crore every single month.
- The UPI network witnessed fraud losses of ₹1,087 crore in FY24, representing just 0.5% of the total transaction value.
- India currently accounts for 46% of global digital payments, relying heavily on multi-layer authentication protocols.
- Over 95,402 UPI fraud cases were officially reported in FY23, emphasising the critical need for real-time threat detection.
- More than 80% of Fintech data breaches stem from organisations failing to comply with basic PCI security standards.
- Approximately 19% of online shoppers abandoned their checkout processes recently due to perceived security vulnerabilities.
- Over 2,193 companies globally utilise Google Pay as their trusted and secure mobile payment tool.
- Secure platforms like UPI Lite maintain a massive 99.9% success rate while safely handling small-ticket transactions.
Google Pay E-commerce and Online Shopping Statistics
- Google Pay controls 34.6% of India’s overall UPI volume, processing more than 7.1 billion transactions monthly.
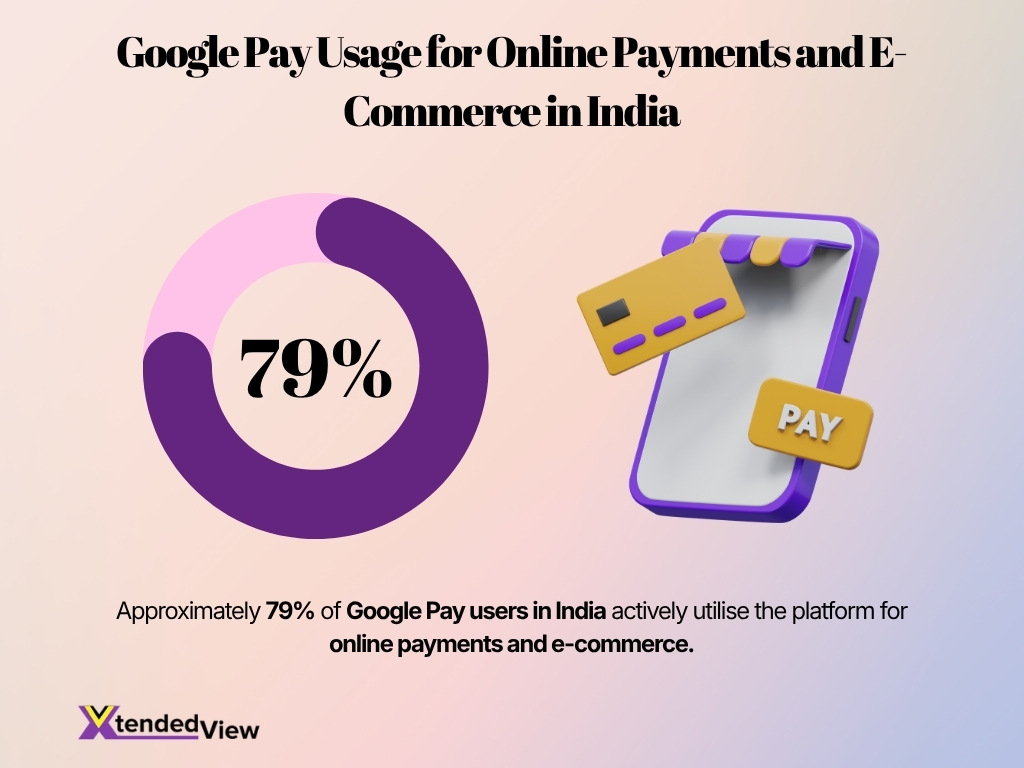
- Approximately 79% of Google Pay users in India actively utilise the platform for online payments and e-commerce.
- Digital wallets and UPI collectively account for over 80% of India’s retail digital payment volume across platforms.
- Google Pay commands 35% of the overall UPI transaction value, managing around ₹9.5 lakh crore in total payments.
- More than 60% of Indian consumers prefer shopping via mobile apps, directly boosting mobile-first payment models.
- Over 2,190 companies worldwide currently integrate Google Pay as their primary mobile checkout solution.
- Tier 2 and Tier 3 cities contribute nearly 50% of incremental e-retail orders, heavily relying on familiar UPI methods.
- Overall, UPI merchant transactions witnessed a massive 63% year-over-year volume growth, heavily fueled by e-commerce sales.
Competitor Statistics: Google Pay vs. Apple Pay vs. Samsung Pay
- Google Pay holds approximately 34% to 35% of the UPI market share in India.
- Apple Pay accounts for more than 90% of mobile-wallet transactions among eligible US iPhone users.
- Google Pay processed more than 7 billion monthly transactions in India alone during 2025.
- Apple Pay captured about 49% of all US mobile wallet users compared to 30.1% for Google Pay.
- Apple Pay represents approximately 54% of all mobile wallet in-store taps in the United States.
- Apple Pay had an estimated 65.6 million active users in the United States in 2025.
- Samsung Pay users have shown high engagement with an average of 7.3 transactions per month.
- Apple Pay is accepted at over 90% of all retail locations across the United States.
- Google Wallet had approximately 35 million active users in the United States during 2025.
Google Pay Technology and Innovation Statistics
- In 2025, Google Pay processed over 2.1 billion transactions, reflecting a 30% increase from the previous year.
- The platform reached 5.2 billion global downloads in 2025, solidifying its dominance in the mobile wallet space.
- AI fraud detection systems successfully blocked over ₹1,100 crore in fraudulent transactions every month.
- Google Pay captured an 18.3% global market share with over 820 million active users worldwide by 2025.
- Biometric authentication adoption on Google Pay-supported devices reached 72% in 2025 to strengthen user security.
- The Unified Payments Interface (UPI) handled 85.5% of India’s total digital payment volume during the second half of 2025.
- NFC contactless payments are now supported on 94% of Android devices, ensuring broad global compatibility.
- The platform supports seamless digital transactions across 60+ currencies, expanding international payment adaptability.
- Wearable device usage for contactless payments surged by 58% as smartwatches gained mainstream traction in 2025.
Google Pay Adoption by Industry
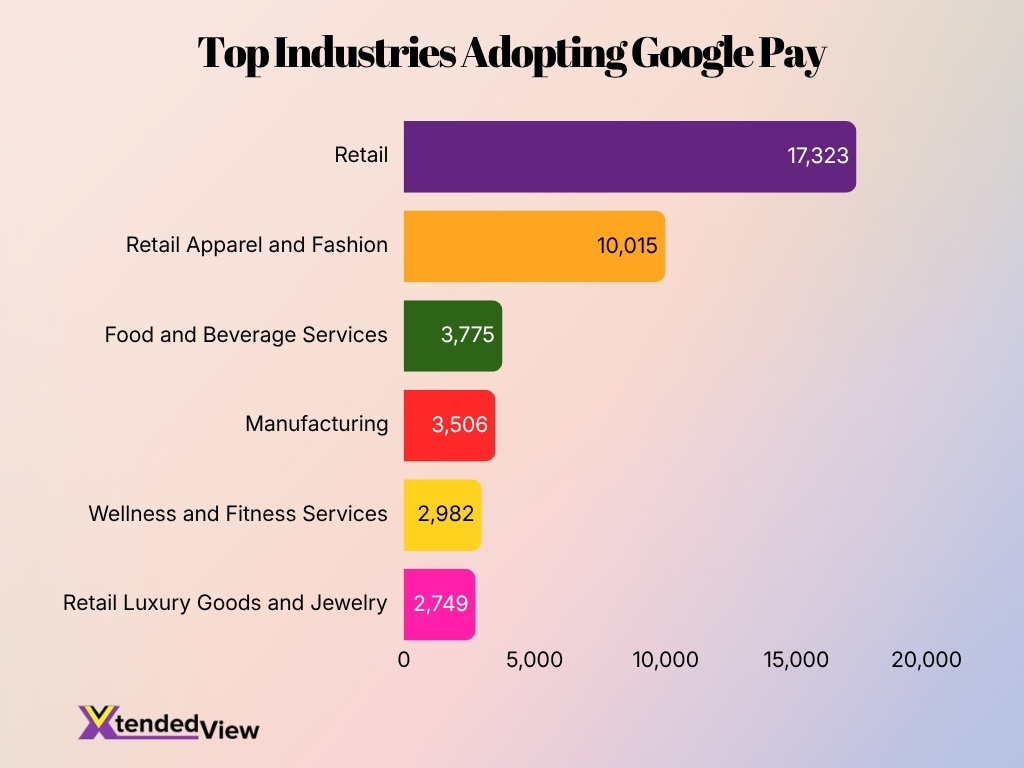
- Retail leads Google Pay adoption with 17,323 businesses, accounting for 16.8% of all tracked industry usage.
- Retail Apparel and Fashion ranks second with 10,015 businesses, representing 9.71% of Google Pay adoption.
- Food and Beverage Services account for 3,775 businesses and 3.66% of total Google Pay usage.
- Manufacturing contributes 3,506 businesses, making up 3.4% of industry adoption.
- Wellness and Fitness Services represent 2,982 businesses and 2.89% of Google Pay users.
- Retail Luxury Goods and Jewelry records 2,749 businesses, accounting for 2.67% of total adoption.
- The Retail sector alone has nearly 1.7 times more Google Pay adoption than Retail Apparel and Fashion.
- Combined, Retail and Retail Apparel and Fashion account for 26.51% of Google Pay adoption across the listed industries.
- All industries outside the top two categories individually contribute less than 4% of total Google Pay adoption.
- Consumer-facing sectors dominate Google Pay usage, with retail-related industries holding the largest share of adoption.
Google Pay Growth Trends and Future Statistics
- India’s digital payment market is projected to continue expanding at double-digit annual growth rates through the late 2020s.
- UPI transaction volume surpassed 208.8 billion transactions in 2025, up significantly from approximately 140 billion in 2024.
- Monthly UPI transactions crossed the 20-billion mark for the first time in 2025.
- Google Pay remains positioned to benefit from continued smartphone adoption across emerging markets.
- Cross-border UPI initiatives are expected to increase international payment opportunities over the next several years.
- Digital-wallet adoption continues to grow among younger consumers and first-time internet users.
- Merchant acceptance is expanding rapidly among small businesses and micro-enterprises.
- The recurring-payment market is expected to become a larger contributor to Google Pay transaction activity.
- Real-time payments are projected to remain one of the fastest-growing segments of global financial technology.
- Google Pay’s long-term growth outlook remains closely tied to UPI expansion, Android adoption, and increasing digital-commerce activity.
Frequently Asked Questions (FAQs)
Google Pay processed approximately 7.5 billion UPI transactions in December 2025, representing 34.64% of total UPI transaction volume.
Google Pay held a 34.4% market share by transaction volume and 34.4% by transaction value in November 2025.
Google Pay processed transactions worth approximately ₹8.83 lakh crore and handled 7.06 billion transactions in August 2025.
UPI accounts for approximately 49% of global real-time payment transaction volume, making it the world’s largest real-time payment system by transaction volume.
Google Pay controls roughly 35% to 36% of India’s UPI transaction market, consistently ranking as the country’s second-largest UPI application.
Conclusion
Google Pay continues to play a major role in the evolution of digital payments, particularly in India, where it consistently processes more than 7 billion transactions per month and maintains roughly one-third of the UPI market. The platform benefits from deep integration with Android devices, a large merchant network, and ongoing innovation in security, authentication, and real-time payments.
Looking ahead, growth opportunities remain strong. Rising smartphone penetration, expanding cross-border UPI initiatives, increasing merchant acceptance, and broader adoption of recurring digital payments should continue to strengthen Google Pay’s position. As digital commerce and real-time payment systems become even more central to everyday financial activity, Google Pay is likely to remain one of the most influential payment platforms globally.