



Online business continues to transform how companies sell products, deliver services, communicate with customers, and enter new markets. Retailers, software providers, consultants, creators, subscription businesses, and small companies increasingly depend on websites, mobile apps, digital marketplaces, social platforms, and online payment systems to generate revenue and manage customer relationships. These channels allow businesses to reach wider audiences, test new offers quickly, personalize marketing, and operate with lower geographic limitations.
The shift toward digital commerce accelerated further as artificial intelligence, mobile shopping, automated marketing, digital wallets, and faster fulfillment became more widely adopted. Consumers now expect convenient browsing, transparent pricing, secure payments, responsive websites, and simple checkout experiences across every device. The following statistics provide a detailed view of online business growth, consumer behavior, digital marketing, e-commerce revenue, payment trends, and the technologies shaping the global digital economy.
Editor’s Choice
- Global retail e-commerce sales reached approximately $6.42 trillion in 2025 and are forecast to climb to $6.88 trillion in 2026, reflecting continued online spending growth.
- The worldwide e-commerce market is projected to generate $3.88 trillion in direct market revenue in 2026, with continued expansion through 2030.
- The United States remains the world’s largest individual e-commerce market, generating more than $1.2 trillion in market revenue during 2026.
- Global retail e-commerce represented roughly 20.5% of total retail sales in 2025 and is expected to reach 21.1% in 2026.
- More than 75% of internet users made online purchases during 2024, highlighting the continued shift toward digital commerce.
- Digital wallets remained the leading online payment method worldwide in 2025, with their share projected to increase further by 2030.
- Asia continues to generate the highest regional e-commerce revenue, while India and the Philippines rank among the fastest-growing online commerce markets.
Recent Developments
- AI-powered shopping assistants and conversational search are changing how consumers discover products online throughout 2025 and 2026.
- Visitors arriving through AI search platforms converted at nearly 50% higher rates than traditional organic search visitors during early 2026.
- AI-referred orders on online storefronts increased by nearly 13 times year over year during the first quarter of 2026.
- Mobile commerce continues to gain share as consumers increasingly complete purchases through smartphones rather than desktop devices.
- Digital wallets strengthened their position as the preferred global online payment method throughout 2025.
- Retailers increasingly invest in AI-powered personalization, automated customer support, and predictive inventory planning to improve conversion rates and customer retention.
- Cross-border e-commerce remains one of the fastest-growing segments as logistics networks and localized payment options improve worldwide.
- Large marketplaces continue expanding beyond retail into payments, logistics, financing, and advertising, creating broader digital commerce ecosystems.
Online Business Growth Statistics
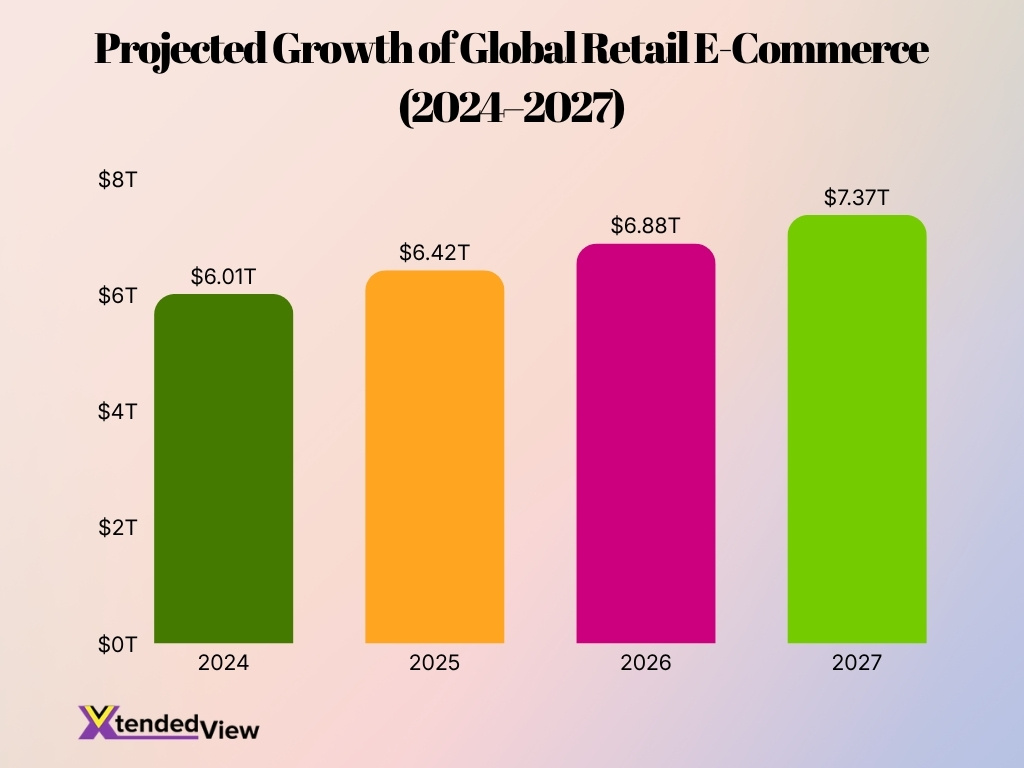
- Global retail e-commerce sales increased from $6.01 trillion in 2024 to $6.42 trillion in 2025.
- Worldwide online retail sales are forecast to reach $6.88 trillion in 2026, representing approximately 7.2% annual growth.
- Global e-commerce revenue is expected to exceed $7.37 trillion by 2027, demonstrating sustained long-term expansion.
- Worldwide e-commerce market revenue is projected to reach $5.05 trillion by 2030 within the tracked market definition.
- The number of global e-commerce users is forecast to exceed 4.1 billion by 2030.
- User penetration in the worldwide e-commerce market is expected to reach 54.3% during 2026.
- The average revenue per online shopper is projected to approach $1,100 per user globally in 2026.
- Online retail continues gaining a larger share of total retail sales each year, reducing the gap between physical and digital commerce.
- Seven countries are expected to exceed $100 billion in annual e-commerce sales during 2025, highlighting continued market expansion.
Global Online Business Statistics
- China, the United States, and Western Europe generated more than $5.17 trillion in combined e-commerce sales during 2025.
- China remains the world’s largest online commerce market by transaction value.
- The United States is expected to generate over $1.2 trillion in e-commerce market revenue during 2026.
- Asia continues to produce the highest regional e-commerce revenue globally.
- India ranks among the world’s fastest-growing e-commerce markets based on projected online sales growth.
- The Philippines also ranks among the fastest-growing global online retail markets.
- Global online shopping adoption continues expanding as internet usage approaches six billion users worldwide.
- Cross-border commerce continues expanding as businesses improve international fulfillment, localized websites, and regional payment support.
- Latin America’s online commerce market is projected to exceed $215 billion in 2026, growing faster than the global average.
E-Commerce Sales Statistics
- Global retail e-commerce sales reached approximately $6.42 trillion in 2025.
- Worldwide retail e-commerce sales are forecast to increase to $6.88 trillion in 2026.
- Global retail e-commerce sales are projected to exceed $7.88 trillion by 2028.
- Online retail is expected to account for 21.1% of total retail sales in 2026.
- By 2028, online commerce is forecast to represent 22.5% of global retail sales.
- The worldwide e-commerce market continues expanding despite slower overall retail growth.
- North America remains one of the highest-value online retail regions by average order value and consumer spending.
- Marketplace-led commerce continues driving a significant share of global online retail activity.
- Strong demand for mobile shopping, digital payments, and faster fulfillment continues supporting global sales growth.
Online Business Sales Channels
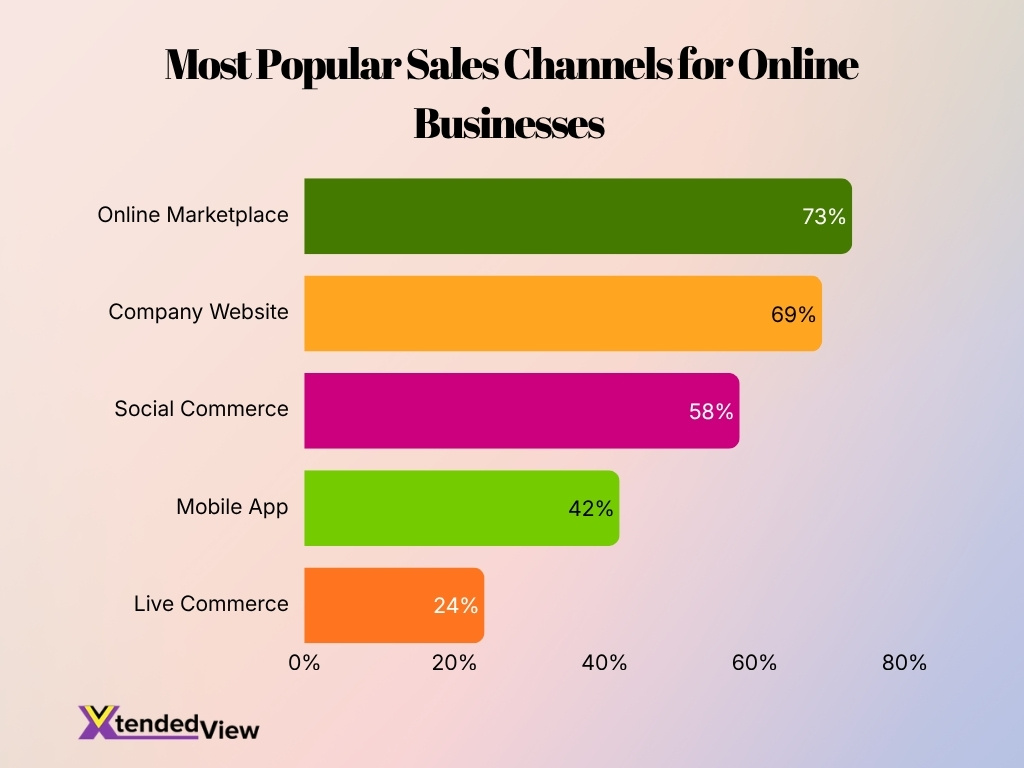
- Online marketplaces are the most widely used sales channel, adopted by 73% of online businesses.
- Company websites rank second, with 69% of businesses using their own sites to sell products or services.
- Social commerce is used by 58% of online businesses, highlighting the growing role of social media platforms in digital sales.
- Mobile apps support sales for 42% of businesses, indicating moderate adoption of app-based shopping experiences.
- Live commerce is the least-used channel at 24%, but it remains an emerging opportunity for interactive product promotion.
- The gap between online marketplaces and company websites is only 4 percentage points, showing that both channels are central to online selling.
- Online marketplaces are used by 49 percentage points more businesses than live commerce.
- The data suggests that successful online businesses increasingly rely on a multichannel sales strategy rather than a single platform.
Online Shopping Statistics
- About 75% of consumers purchase items online at least once a month globally.
- More than three billion people worldwide are projected to make an online purchase in 2026.
- Global retail e-commerce sales are officially projected to hit a massive $6.86 trillion in 2025.
- Asia remains the largest regional market by securing a massive 45.0% global revenue share in 2025.
- Digital wallets dominated the payments landscape by capturing 53% of all online transactions in 2025.
- By the year 2030, artificial intelligence is expected to seamlessly manage 80% of customer interactions.
- Mobile commerce is rapidly expanding and currently accounts for nearly 59% of total online retail sales.
- Approximately 79% of shoppers report that offering free shipping significantly encourages more online purchases.
- Global social commerce sales successfully surpassed $700 billion in 2025 as alternative shopping channels expanded.
Online Business Revenue Statistics
- Seasonally adjusted US retail e-commerce sales reached $326.7 billion in Q1 2026, up 2.7% from Q4 2025.
- US e-commerce revenue grew 9.8% year over year in Q1 2026, while total retail sales rose 3.9%.
- E-commerce generated 16.9% of adjusted US retail sales in the first quarter of 2026.
- On an unadjusted basis, consumers spent $302.3 billion online during Q1 2026.
- Global online consumer-goods revenue exceeded $4.12 trillion in 2024, adding more than half a trillion dollars in one year.
- Worldwide online consumer-goods spending increased 14.6% in 2024, showing that digital revenue grew faster than many mature retail categories.
- Online channels captured 17.3% of global consumer-goods revenue in 2024, compared with 12% in 2019.
- US digital advertising revenue reached $294.6 billion in 2025, representing 13.9% annual growth and a new industry record.
- Digital advertising revenue totaled $258.6 billion in 2024, up 14.9% from the previous year.
Online Business Growth Drivers
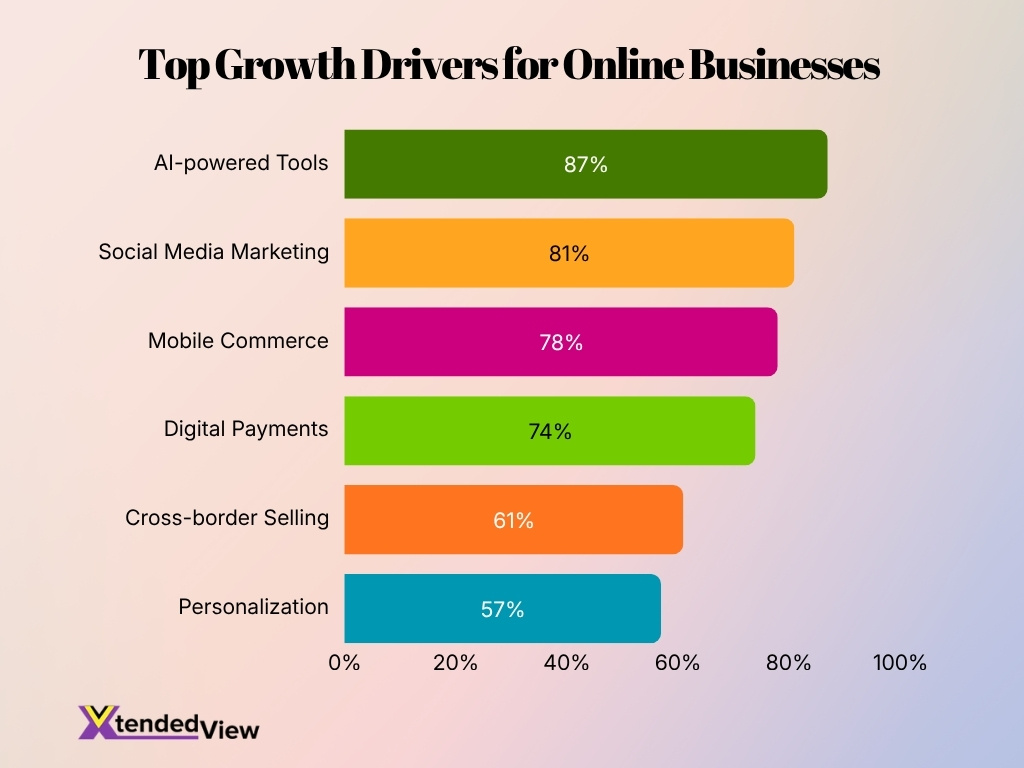
- AI-powered tools rank as the leading growth driver, with 87% of online businesses adopting them to automate operations, improve efficiency, and support faster decision-making.
- Social media marketing is used by 81% of businesses, highlighting its importance for increasing brand visibility, engaging customers, and generating online sales.
- Mobile commerce influences growth for 78% of online businesses, as consumers increasingly browse, compare, and purchase products through smartphones.
- Digital payments are adopted by 74% of businesses, reflecting the growing demand for fast, secure, and convenient online transaction options.
- Cross-border selling supports growth for 61% of online businesses, allowing companies to reach international customers and expand beyond domestic markets.
- Personalization is used by 57% of businesses, helping brands deliver more relevant product recommendations, marketing messages, and customer experiences.
- The data shows that technology-led strategies dominate online business growth, with the top four drivers each recording adoption rates above 70%.
Website Statistics for Businesses
- North American mobile devices generated 52.89% of web traffic in 2025, meaning businesses still needed to serve both mobile and desktop visitors effectively.
- Smartphones represented almost 87% of mobile handsets in use worldwide at the start of 2025.
- Global mobile phone users reached 5.78 billion in 2025, or 70.5% of the world’s population.
- A business website supported product discovery for 25.8% of adult internet users, placing brand-owned sites among the five leading discovery channels.
- Search engines introduced 32.8% of connected consumers to new brands and products, reinforcing the need for searchable website content.
- Search-led brand discovery increased from 30.6% in 2022 to 32.8% in 2024, a relative gain of 7.2%.
- The probability of a visitor bouncing rises 32% when loading time increases from one second to three seconds.
- In available performance benchmarks, 74% of websites achieved a good Largest Contentful Paint score on desktop, compared with 61.4% on mobile.
- E-commerce websites loading in under two seconds recorded an average 3.05% conversion rate, compared with 1.94% for sites taking three to four seconds.
Online Consumer Behavior Statistics
- More than 2.5 billion people bought consumer goods online in 2024, an increase of 200 million shoppers.
- The worldwide online buyer population grew 8.5% in one year, expanding faster than the internet user base.
- Close to 56% of online adults shop online every week, equivalent to roughly 1.7 billion weekly buyers.
- Around half of weekly online shoppers also purchase groceries online each week for routine household needs.
- US online channels accounted for more than one-third of consumer-goods spending in 2024.
- China generated 31.2% of consumer-goods spending online, placing it close behind the US.
- The typical adult internet user encountered brands through 5.8 different discovery sources.
- Online search drove brand discovery for 32.8% of users, while social media ads influenced 29.7%.
- Nearly 29% of consumers discovered brands through personal recommendations, keeping trust central to decisions.
Review Factors Influencing Consumer Trust
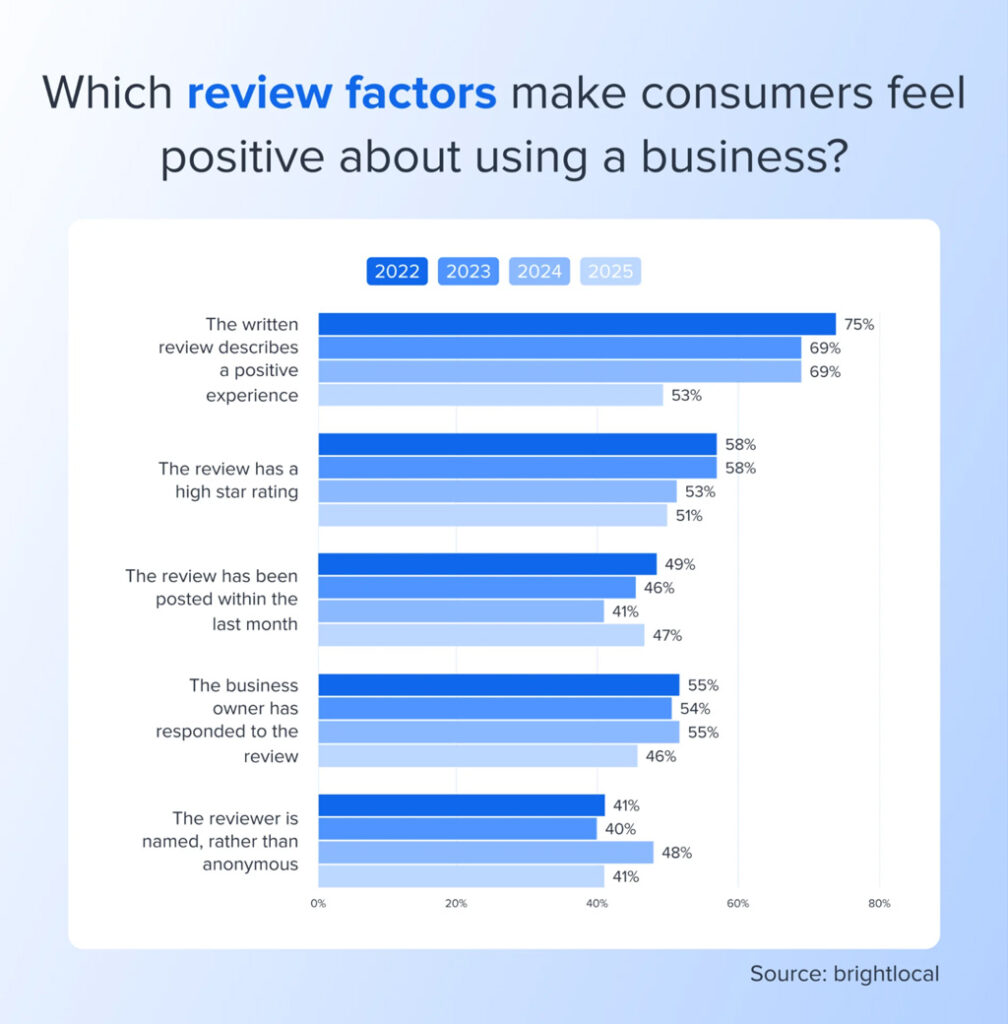
- A positive experience described in the written review remained the strongest influence, although its share declined sharply from 75% in 2022 to 53% in 2025.
- A high star rating consistently encouraged consumer confidence, but its impact gradually fell from 58% in 2022 and 2023 to 51% in 2025.
- The importance of a recent review posted within the last month dropped from 49% in 2022 to 41% in 2024, before recovering to 47% in 2025.
- A business owner’s response to a review influenced 55% of consumers in 2022 and 2024, but declined to 46% in 2025.
- Having a named reviewer rather than an anonymous reviewer was the least influential factor in most years, affecting 41% of consumers in 2022 and 2025.
- The value of reviewer identity peaked in 2024 at 48%, showing that transparency can still strengthen the credibility of online reviews.
- Overall, the data suggests that consumers prioritize review content and ratings more than reviewer identity, recency, or business responses.
- Most review factors weakened between 2022 and 2025, indicating that consumers may now evaluate businesses using a broader mix of online trust signals.
Digital Marketing Statistics for Online Businesses
- The global online population reached 5.56 billion in early 2025, giving digital businesses access to 67.9% of the world’s population.
- Internet usage added 136 million people during 2024, representing 2.5% annual growth.
- By July 2025, the online population had climbed further to 5.65 billion, with global penetration reaching 68.7%.
- Social media platforms counted 5.24 billion user identities at the start of 2025, up 206 million year over year.
- Social media user identities increased 4.1% annually, outpacing the 2.5% growth recorded for internet users.
- 62.8% of adult internet users named finding information as a leading reason for going online, supporting investment in educational and search-focused content.
- Search, television advertising, recommendations, social advertising, and business websites collectively formed the five leading brand-discovery channels in 2025 reporting.
- Social media users spent an average of 2 hours and 19 minutes per day across approximately 6.8 platforms in 2025.
- US creator-economy advertising spending was projected to reach $37 billion in 2025, up 26% year over year.
Online Advertising Statistics
- US internet advertising revenue reached a record $294.6 billion in 2025, adding about $36 billion to the previous year’s total.
- The market expanded 13.9% in 2025, following 14.9% growth in 2024.
- US digital advertising revenue surpassed $100 billion for the first time in 2018 and nearly tripled by 2025.
- Video, social advertising, and commerce media ranked among the main drivers of the 2025 revenue increase.
- Creator advertising spending reached an estimated $37 billion in 2025, making creators a core paid-media channel rather than a small experimental category.
- Creator advertising spending rose 26% year over year, almost twice the overall digital advertising market’s growth rate.
- Social media ads introduced 29.7% of adult internet users to brands and products, ranking fourth among global discovery sources.
- Traditional television ads remained close to search, influencing 32.3% of consumers, which shows why many online businesses still combine digital and broad-reach media.
- Digital audio advertising spending was projected to exceed $12.16 billion in 2025 and reach $14.84 billion by 2029.
Top Online Business Categories Worldwide
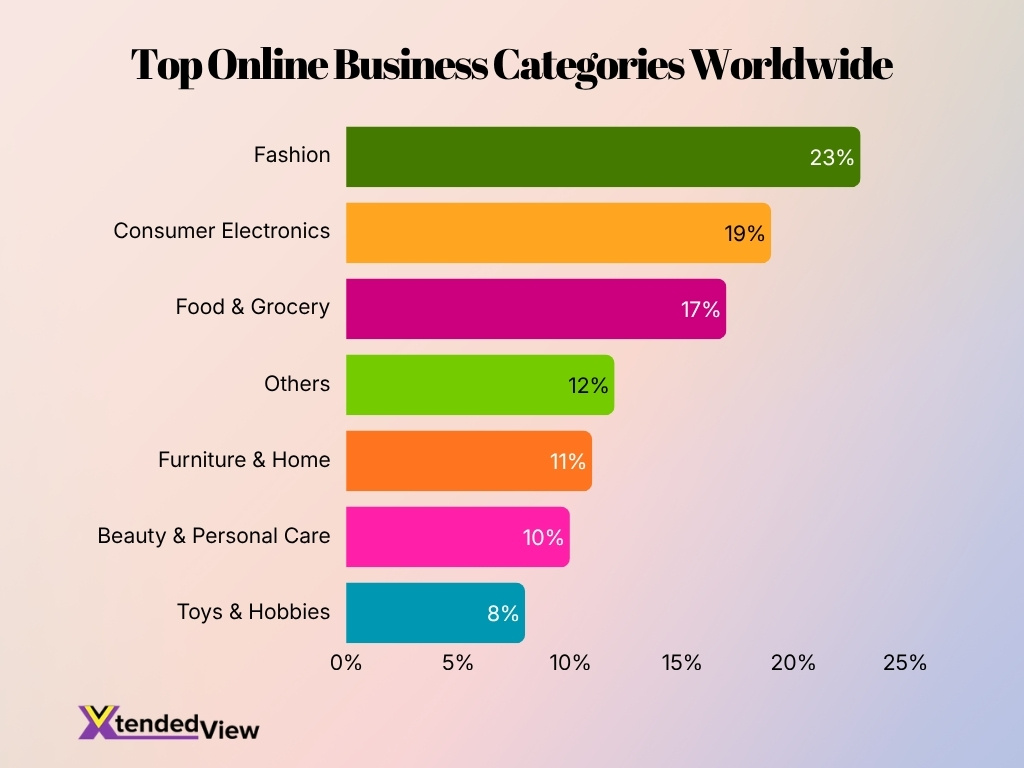
- Fashion leads the global online business market with a 23% share, making it the largest product category in 2026.
- Consumer electronics accounts for 19% of the market, reflecting strong demand for smartphones, computers, accessories, and smart devices.
- Food and grocery products represent 17%, showing the continued expansion of online grocery shopping and rapid delivery services.
- The combined share of fashion, consumer electronics, and food and grocery reaches 59%, meaning these three categories dominate online product sales.
- Furniture and home products hold an 11% market share, supported by growing consumer interest in home improvement and online interior shopping.
- Beauty and personal care contribute 10%, driven by skincare, cosmetics, grooming products, and influencer-led online purchasing.
- Toys and hobbies account for 8%, making them the smallest individually listed category in the dataset.
- Other product categories collectively represent 12%, highlighting the diversity of smaller and specialized online business segments.
Social Media Marketing Statistics
- Global social media user identities reached 5.24 billion at the beginning of 2025, representing approximately 63.9% of the world’s population.
- Social media users increased by 206 million year over year, reflecting 4.1% annual growth in 2025.
- Internet users spent an average of 2 hours and 19 minutes per day on social media platforms during 2025.
- The average social media user actively used 6.8 platforms every month, encouraging businesses to adopt multichannel marketing strategies.
- 29.7% of internet users discovered new brands through social media advertisements, making paid social one of the leading digital discovery channels.
- 23.4% of consumers found brands through recommendations and comments on social platforms, highlighting the influence of social proof.
- Social commerce continues expanding rapidly, with several markets recording double-digit annual growth in online purchases made directly through social platforms.
- Creator-led marketing continues gaining momentum, with US creator advertising spending reaching approximately $37 billion in 2025.
- Short-form video remains one of the highest-performing content formats for product discovery and customer engagement across social platforms.
Email Marketing Statistics
- Global email users reached approximately 4.6 billion in 2025 and are projected to approach 4.9 billion by 2028.
- Businesses send nearly 400 billion emails every day, making email one of the world’s largest digital communication channels.
- The average email open rate increased to 43.46% in 2025, up from 42.35% in 2024.
- 63% of marketers now use AI tools to improve email campaigns through automation and personalization.
- 91% of email marketers use personalization techniques to improve customer engagement.
- Mobile devices accounted for 41.6% of all email opens in 2025, ahead of desktop email clients.
- Automated email campaigns generated 37% of e-commerce email sales from only 2% of total email volume, demonstrating the effectiveness of behavioral automation.
- Abandoned cart, welcome, and browse abandonment emails produced 87% of all automated orders for e-commerce brands.
- Industry estimates continue to place average email marketing ROI between $36 and $42 for every $1 spent, depending on campaign quality and industry.
Small Business Online Presence Statistics
- 99% of US small businesses used at least one technology platform in 2025, unchanged from 2024 and up from 93% in 2022.
- 58% of small businesses used four or more technology platforms in 2025.
- The share of small businesses using at least six platforms increased from 28% in 2024 to 32% in 2025.
- Meanwhile, the share using no more than three platforms fell from 54% to 42%, marking a 12-percentage-point annual decline.
- 46% of small businesses used technology for marketing and promotions in 2025, making it their most common customer-facing application.
- 28% used technology to process sales, while another 28% used it to communicate with customers and prospects.
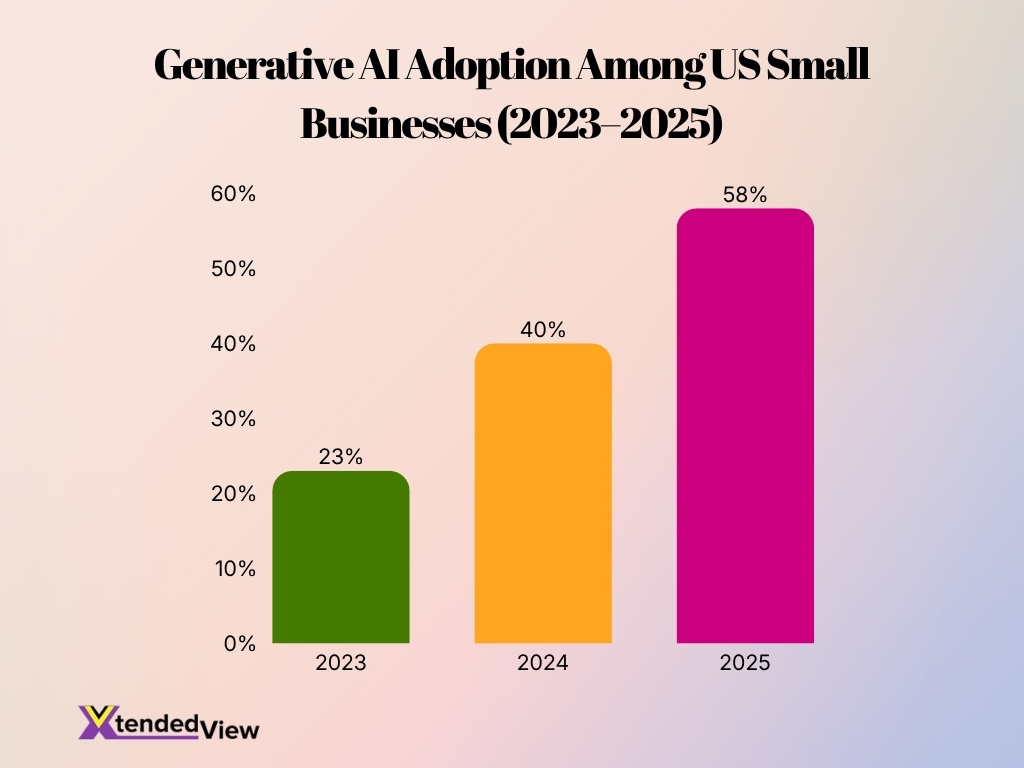
- Generative AI adoption among small businesses reached 58% in 2025, up from 40% in 2024 and 23% in 2023.
- 84% of small businesses planned to increase their use of technology platforms, indicating continued investment in digital operations.
- Among small businesses using AI, 82% increased their workforce during the previous year, challenging the idea that adoption always reduces headcount.
Mobile Commerce Statistics
- The global mobile commerce market size was valued at $2,239.11 billion in 2025 and is projected to reach $2,416.46 billion in 2026.
- The Asia Pacific region dominated the global mobile commerce market, holding a 42.66% share in 2025.
- North America accounted for 37.21% of global mobile commerce spend in 2025.
- The mobile retailing segment held the largest market share in 2025, accounting for 43.78% of the revenue.
- Smartphones captured 64.84% of mobile commerce activity by device type in 2025.
- Mobile web payments commanded 38.51% of the mobile commerce turnover by payment mode in 2025.
- Global smartphone subscriptions reached 6.8 billion in 2025, equaling 84% of the world’s population.
- Apple Pay and Google Pay processed a combined $1.2 trillion in 2025, representing a 28% year-over-year increase.
- Biometric one-tap authentication lowered cart abandonment by 35% in 2025 pilot programs.
- Mobile payment fraud climbed to $5.7 billion in 2025, an 18% annual rise.
Online Conversion Rate Statistics
- E-commerce sites loading in under two seconds achieve a 3.05% conversion rate, compared to 1.94% for slower pages.
- Optimizing checkout design to reduce friction can increase conversions by an average of 35.26%.
- Mobile-optimized websites see smartphone conversion rates averaging 2.49%, significantly boosting overall sales.
- Integrating AI-powered personalization can lift e-commerce conversion rates by 10% to 15% on average.
- Organic search traffic yields an average conversion rate of 2.9%, outperforming traditional paid social channels.
- Automated cart abandonment emails achieve an impressive average conversion rate of 10.7% for online retailers.
- Personalized product recommendations can account for up to 31% of total e-commerce revenue.
- Allowing guest checkout eliminates a major friction point, recovering up to 18% of abandoned carts.
- Companies utilizing advanced A/B testing on their landing pages see up to a 30% increase in conversions.
Data-Related Challenges for Online Businesses
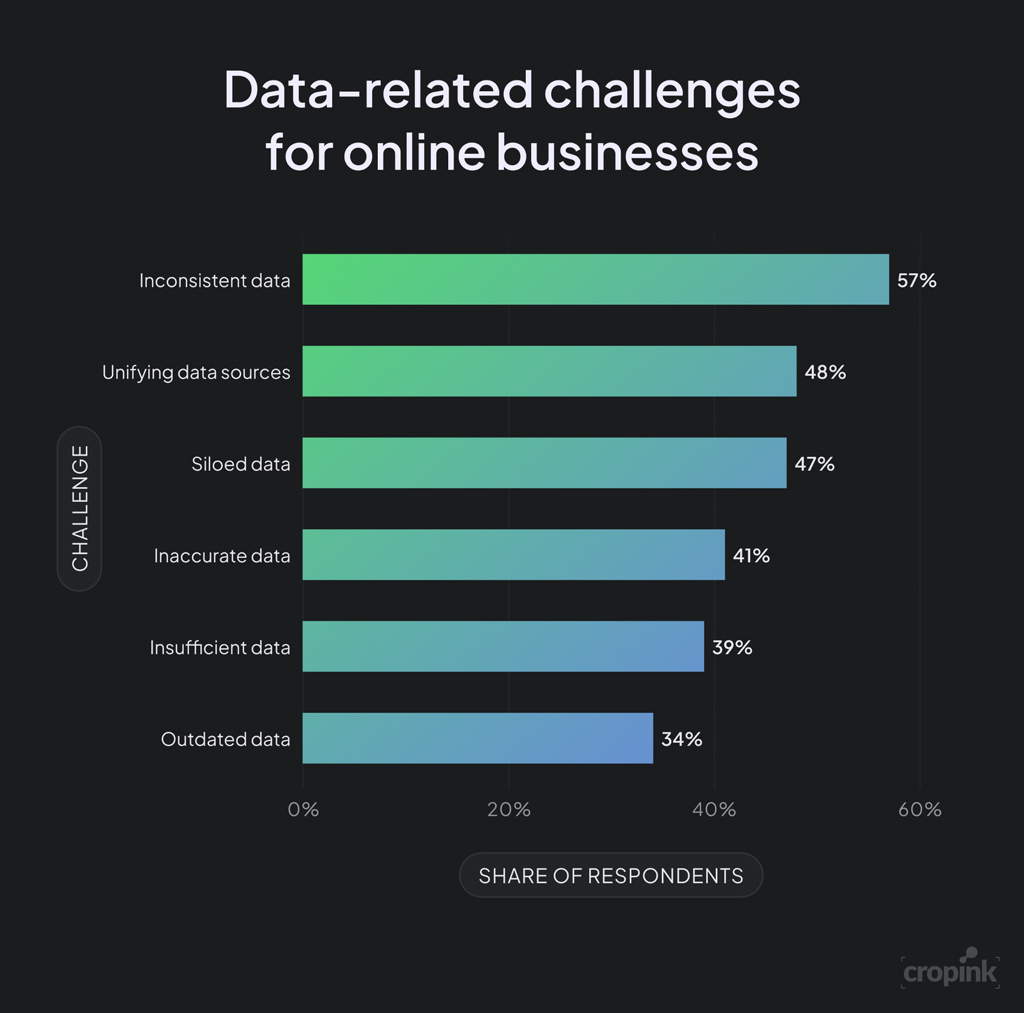
- Inconsistent data is the most common challenge, affecting 57% of respondents and indicating widespread difficulties in maintaining reliable information across business systems.
- Unifying data sources is a major concern for 48% of businesses, highlighting the complexity of combining information from multiple platforms and departments.
- Siloed data affects 47% of respondents, which can limit collaboration, reduce visibility, and slow down data-driven decision-making.
- Inaccurate data is reported by 41% of businesses, creating risks for forecasting, customer analysis, marketing, and operational planning.
- Insufficient data is a challenge for 39% of respondents, suggesting that many businesses lack enough information to generate meaningful insights.
- Outdated data affects 34% of businesses, making it the least reported challenge but still a significant obstacle to timely and accurate decisions.
- The gap between the highest and lowest reported challenges is 23 percentage points, showing that all six data issues remain relevant for online businesses.
Cart Abandonment Statistics
- The global average shopping cart abandonment rate reached 70.19% in 2026, based on a meta-analysis of 49 studies.
- Worldwide cart abandonment represents an estimated $4.6 trillion in lost revenue annually.
- Mobile shopping experiences recorded an abandonment rate of approximately 76.6%, exceeding desktop rates.
- 48% of shoppers abandoned purchases because additional costs, such as shipping and taxes, were higher than expected.
- 26% of consumers left checkout because they were required to create an account before purchasing.
- 22% of shoppers abandoned carts due to long or complicated checkout processes.
- Email recovery campaigns recovered an average of 5.9% of abandoned orders.
- Businesses with mature abandoned cart recovery strategies generated approximately 12% more revenue than comparable stores without structured recovery programs.
- Abandoned cart emails remained one of the highest-converting automated email workflows across e-commerce businesses.
Online Payment Statistics
- The global digital wallet market is expected to expand from $56.77 billion in 2025 to $68.02 billion in 2026.
- The ecommerce industry experiences an average cart abandonment rate hovering consistently between 65% and 75%.
- Approximately 17% of online consumers abandon their shopping carts specifically due to payment security concerns.
- The Buy Now, Pay Later (BNPL) sector reached a massive $560.1 billion in gross merchandise volume globally during 2025.
- Offering BNPL installment plans at checkout can boost a merchant’s conversion rates by up to 30%.
- The North American region dominated the Buy Now, Pay Later market, capturing a 56.1% market share in 2025.
- The global market for AI-powered payment fraud detection was valued at $14.3 billion in 2025.
- United States cybercrime-related losses exceeded $20.8 billion in 2025, forcing massive investments into fraud detection solutions.
Frequently Asked Questions (FAQs)
Global B2C e-commerce revenue is projected to reach $5.5 trillion by 2027, growing at a 14.4% CAGR.
Unadjusted US retail e-commerce sales totaled $302.3 billion in Q1 2026, up 9.7% year over year.
E-commerce accounted for 16.9% of seasonally adjusted US retail sales in the first quarter of 2026, up from 16% one year earlier.
The worldwide e-commerce market is forecast to grow at a 6.84% CAGR from 2026 to 2030, reaching approximately $5.05 trillion by 2030.
In 2025, 58% of US small businesses reported using generative AI, up from 40% in 2024 and 23% in 2023.
Conclusion
Online business maintained strong momentum, supported by rising internet access, mobile commerce, artificial intelligence, digital advertising, social media, email automation, and flexible payment methods. E-commerce continues to claim a larger share of retail activity, while consumers increasingly rely on websites, mobile devices, online reviews, search engines, and social platforms to research and purchase products.
The data also shows that growth alone does not guarantee success. Businesses must improve website speed, mobile usability, payment security, checkout simplicity, personalization, and customer communication to convert digital traffic into revenue. Companies that combine reliable data with strong customer experiences will be better positioned to reduce abandonment, increase loyalty, and compete in the expanding global online economy.
