



Modern networking powers nearly every digital experience, from cloud-based business applications to video streaming, online gaming, AI workloads, and remote collaboration. Organizations also depend on reliable networks to connect data centers, edge devices, and hybrid workforces while supporting rising cybersecurity demands. As AI, cloud computing, and connected devices continue to expand, networking infrastructure has become a strategic investment across industries. Explore the latest networking statistics to understand how the market, internet traffic, and networking technologies continue to evolve.
Editor’s Choice
- Around 6 billion people, or 74% of the global population, use the internet in 2025, up from 5.8 billion users in 2024.
- Global fixed internet traffic increased to approximately 7,300 exabytes in 2025, compared with about 3,100 exabytes in 2020.
- Mobile internet traffic reached nearly 1,500 exabytes globally during 2025, reflecting continued smartphone and 5G adoption.
- Asia-Pacific generated roughly 50% to 60% of worldwide internet traffic across both fixed and mobile networks in 2025.
- Global internet traffic recorded 19% year-over-year growth during 2025.
- AI infrastructure spending continues to accelerate, with Cisco expecting $3 billion in AI networking revenue during fiscal 2026.
- Despite rapid growth, approximately 2.2 billion people remained offline worldwide in 2025.
Recent Developments
- AI data center expansion significantly increased enterprise demand for high-performance Ethernet switches and networking equipment during 2025 and 2026.
- Cisco increased its fiscal 2026 revenue forecast after recording more than $2 billion in AI infrastructure orders during fiscal 2025.
- The June 2026 Mobility Report highlighted continued growth in 5G subscriptions, network slicing, AI-driven networking, and edge connectivity.
- Global internet traffic recorded 19% annual growth during 2025 as AI applications and cloud services expanded.
- Adoption of post-quantum encryption increased during 2025, marking an important milestone for internet security.
- AI crawlers generated substantial increases in automated web traffic throughout 2025, reshaping internet traffic composition.
- Telecom operators continued expanding fixed wireless access and standalone 5G deployments throughout 2025 and into 2026.
- Investments in hyperscale cloud infrastructure continued to drive demand for faster optical networking and high-capacity switching platforms.
Enterprise Networking Market Growth
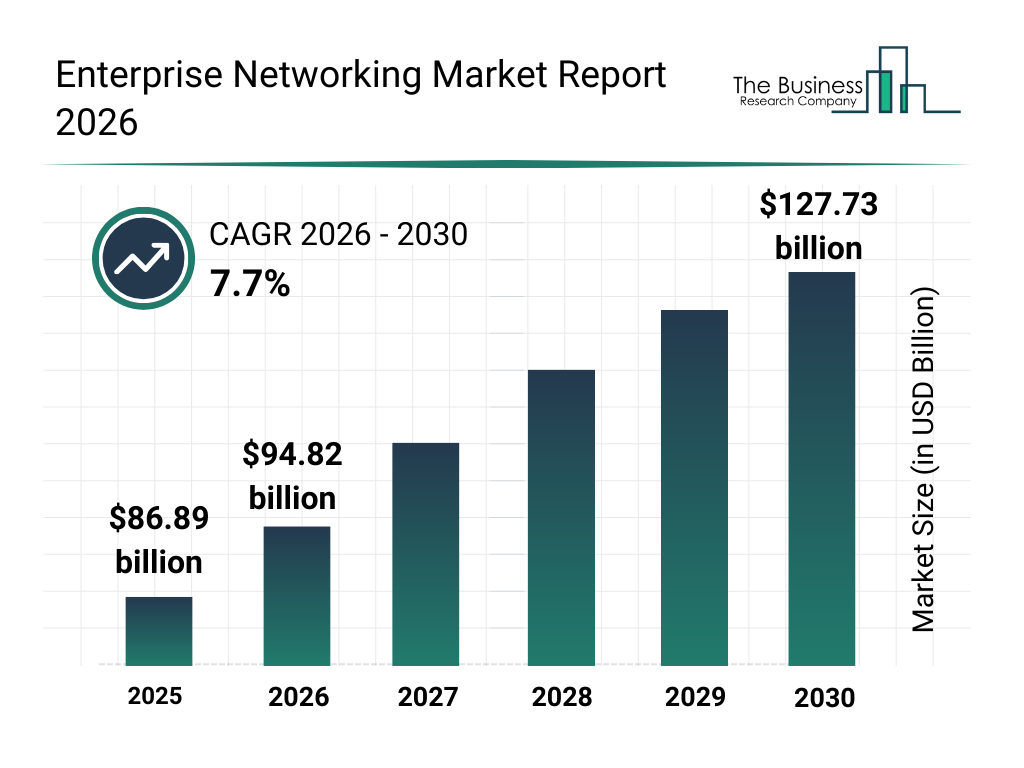
- The global enterprise networking market is valued at $86.89 billion in 2025 and is expected to rise steadily through 2030.
- Market size is projected to reach $94.82 billion in 2026, representing an annual increase of approximately 9.1%.
- The industry is forecast to expand at a 7.7% CAGR from 2026 to 2030, supported by rising cloud, security, and connectivity requirements.
- Enterprise networking revenue is estimated to surpass $100 billion in 2027, reaching approximately $102.12 billion.
- The market could grow to around $109.98 billion in 2028 and $118.45 billion in 2029.
- By 2030, the enterprise networking market is expected to reach $127.73 billion.
- Between 2025 and 2030, the market is forecast to add approximately $40.84 billion in total value.
- Overall, the market is projected to grow by nearly 47% over the five-year period, highlighting strong long-term demand for enterprise networking solutions.
Global Networking Statistics
- Approximately 74% of the world’s population was connected to the internet by the end of 2025.
- Global internet users increased by more than 240 million during 2025 alone.
- About 1.3 billion additional people came online between 2020 and 2025.
- Fixed-line internet traffic more than doubled between 2020 and 2025, reaching roughly 7,300 exabytes.
- Mobile internet traffic increased from roughly 560 exabytes in 2020 to approximately 1,500 exabytes in 2025.
- Asia-Pacific remained the largest networking region, accounting for over half of global internet traffic.
- Developing regions continued to record the fastest relative growth in connectivity, particularly across Africa and the Arab States.
- Even with expanding connectivity, 2.2 billion people worldwide still lacked internet access in 2025.
Networking Traffic and Usage
- Global internet traffic expanded by 19% year-over-year in 2025.
- Fixed broadband traffic volumes reached roughly 7,300 exabytes globally in 2025.
- Mobile data usage climbed to approximately 1,500 exabytes worldwide during 2025.
- The Asia-Pacific region accounted for the largest share of internet traffic at 50 to 60 percent.
- AI bots and automated crawlers drove traffic growth, with Google’s bot becoming the single biggest source of automated traffic.
- Streaming, cloud computing, and digital services drove internet bandwidth demand to more than double between 2020 and 2025.
- Fixed networks carried significantly more traffic, rising from 3,100 exabytes in 2020 to 7,300 exabytes in 2025.
- Regions like Africa and the Arab States saw the fastest relative percentage growth due to rising connectivity and smartphone adoption.
Network Devices Market by Device Type
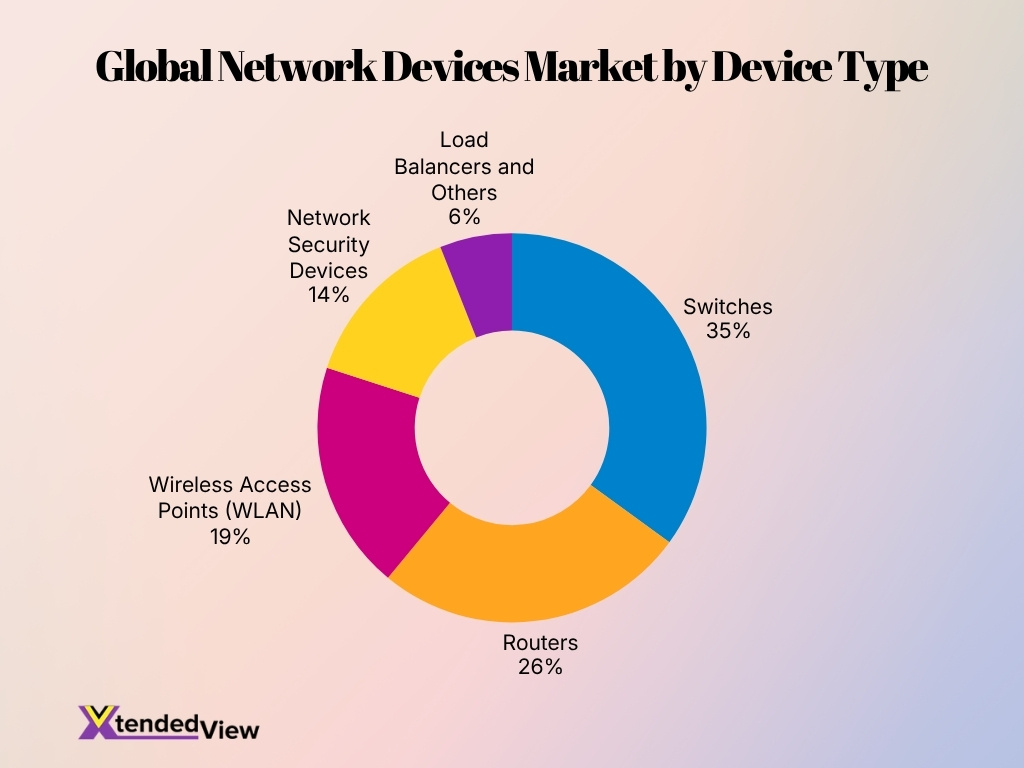
- Switches dominate the global network devices market, accounting for the largest share at 35%, driven by their essential role in connecting devices across enterprise and data center networks.
- Routers hold a 26% market share, making them the second-largest device category as businesses expand internet connectivity, cloud access, and wide-area networks.
- Wireless access points represent 19% of the market, supported by rising demand for reliable Wi-Fi connectivity across offices, public spaces, educational institutions, and smart buildings.
- Network security devices account for 14%, reflecting growing investment in firewalls, intrusion prevention systems, and secure network infrastructure.
- Load balancers and other network devices contribute 6%, serving specialized requirements such as traffic distribution, application performance, and network optimization.
- Together, switches and routers control 61% of the market, highlighting the continued importance of core network connectivity and traffic management equipment.
- The top three categories, switches, routers, and wireless access points, collectively represent 80% of the global network devices market.
Internet and Broadband Statistics
- The world recorded 20.1 fixed broadband subscriptions per 100 people in 2025. This equals roughly one subscription for every five residents.
- Active mobile broadband penetration reached 99.4 subscriptions per 100 people worldwide in 2025, up from the previous year as smartphones and cellular coverage expanded.
- Mobile broadband represented 89% of all mobile subscriptions in 2025, confirming that data services now dominate cellular connectivity.
- At least one LTE or WiMAX network covered 92.7% of the global population in 2025. However, coverage did not always translate into affordable or reliable access.
- Approximately 94% of U.S. broadband-serviceable locations had access to terrestrial fixed service offering at least 100 Mbps download and 20 Mbps upload as of June 2024.
- About 3% of U.S. locations still lacked terrestrial fixed broadband at the former 25 Mbps download and 3 Mbps upload benchmark in June 2024.
- Fixed broadband penetration across developed economies averaged 36.5 subscriptions per 100 residents at the end of 2024, compared with 32 subscriptions in 2019.
- Fiber represented 47% of fixed broadband subscriptions across developed economies at the end of 2024, up from 28% in 2019.
- Fiber accounted for more than 80% of fixed broadband connections in five markets: Iceland at 93%, South Korea at 90.5%, Spain at 89%, Finland at 81.6%, and Lithuania at 80.7%.
- Despite broader infrastructure coverage, 2.2 billion people remained offline in 2025, with most living in low- and middle-income countries.
Enterprise Networking Statistics
- A 2025 global workplace study surveyed 21,513 employers and employees across 21 markets, showing how strongly hybrid work continues to shape enterprise network requirements.
- About 90% of employees saw value in collaboration tools, which depend on stable bandwidth, low latency, and secure access from multiple locations.
- Similarly, 93% of employers viewed collaboration technology as effective for supporting hybrid work and office-return strategies.
- Only 32% of employers invested in the advanced collaboration technology needed to support flexible hybrid work models in 2025.
- Just 44% of employers reported investing in workplace AI, despite increasing demand for network capacity to support AI assistants, analytics, and automated workflows.
- Only 39% of employees agreed with employers who believed mandated office attendance improved productivity, highlighting the need for networks that support both on-site and remote work.
- In 2024, 73% of employers expected to invest in AI-powered collaboration software by the end of 2025. This target exceeded the 44% that reported broader workplace AI investment in the following study.
- Another 68% of employers planned to add AI capabilities to physical workspaces by the end of 2025, increasing demand for connected meeting rooms, cameras, sensors, and access points.
- 80% of employers had planned some form of AI investment for workspaces and collaboration by the end of 2025. However, later findings suggest that actual adoption progressed more slowly than planned.
- Enterprise network teams increasingly support office users, remote employees, cloud applications, and connected devices through one operating environment. As a result, organizations continue moving toward automated, identity-based, and software-defined network management.
Enterprise Networking Market Share by End User
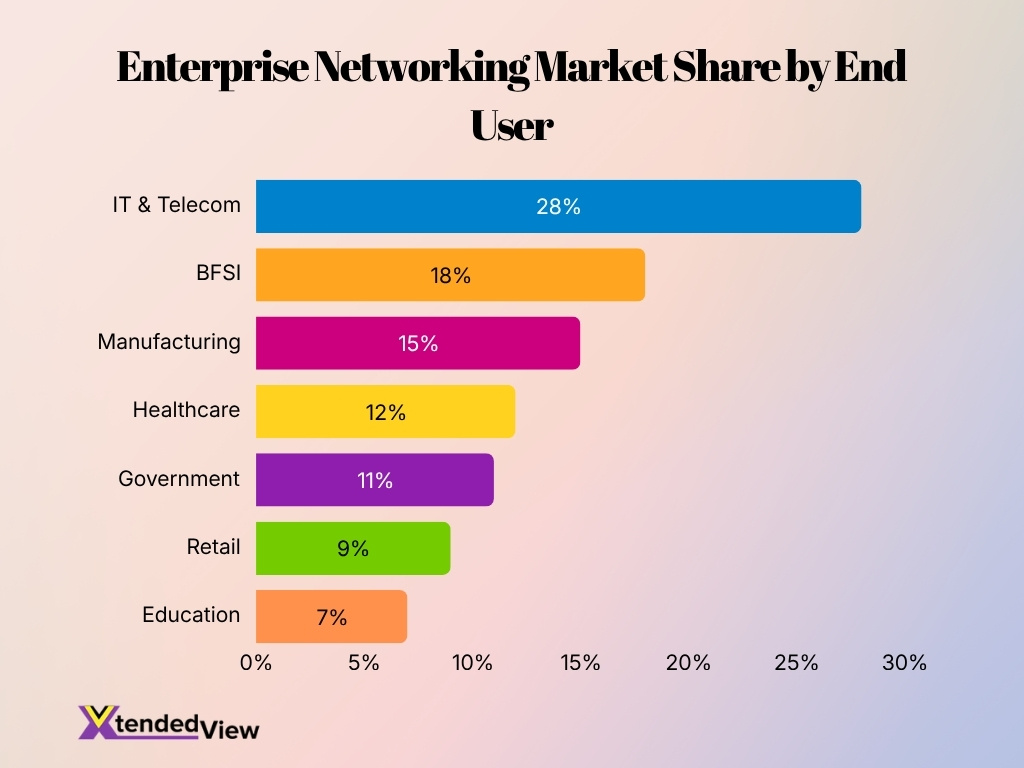
- IT and telecom lead the enterprise networking market with a 28% share, driven by rising demand for cloud infrastructure, high-speed connectivity, and advanced network management.
- BFSI holds the second largest share at 18%, as banks and financial institutions invest heavily in secure, reliable, and compliant networking systems.
- Manufacturing accounts for 15% of the market, supported by growing adoption of industrial automation, connected machinery, and smart factory technologies.
- Healthcare represents 12% of enterprise networking demand, reflecting increased use of telemedicine, electronic health records, and connected medical devices.
- Government organizations contribute 11%, as public agencies modernize digital infrastructure and strengthen secure communication networks.
- Retail captures a 9% market share, fueled by e-commerce growth, digital payment systems, inventory tracking, and omnichannel operations.
- Education holds the smallest share at 7%, although demand continues to rise due to online learning, smart classrooms, and campus-wide connectivity.
Cloud Networking Statistics
- 76% of large enterprises spent more than $5 million per month on public cloud services in 2026, illustrating the scale of workloads that cloud networks must carry.
- 16% of surveyed organizations spent between $200,001 and $500,000 per month on public cloud services in 2026, making it the most common spending band.
- The share of organizations in the three lowest cloud spending tiers fell by a combined 4 percentage points in 2026. Meanwhile, the three highest tiers gained 3 points.
- In 2025, 84% of organizations identified cloud spending management as their leading cloud challenge.
- Organizations expected their cloud spending to rise by 28% during the year following the 2025 survey, increasing pressure on network governance and cost controls.
- In 2026, 64% of organizations measured the value cloud services delivered to business units, an increase of 12 percentage points year over year.
- The global data center networking market reached an estimated $47.09 billion in 2025 and was projected to grow to $52.33 billion in 2026.
- One market forecast expects data center networking revenue to reach $126.8 billion by 2035, representing a 10.41% compound annual growth rate from 2026.
- Ethernet data center switch revenue reached a quarterly record of $8 billion in the third quarter of 2025, supported by cloud and AI infrastructure demand.
- Cloud computing and AI continued to drive data center demand in 2026, increasing the need for high-speed interconnection between servers, storage systems, cloud regions, and enterprise facilities.
Wi-Fi Networking Statistics
- Global shipments of Wi-Fi-enabled products reached approximately 4.1 billion units in 2024.
- Roughly two-thirds of Wi-Fi product shipments in 2024 supported Wi-Fi 6 or Wi-Fi 6E.
- Wi-Fi HaLow device shipments are forecast to rise from 19 million units in 2025 to 124 million in 2030.
- The Wi-Fi HaLow forecast represents a 45% compound annual growth rate, the fastest among wireless technologies.
- Wi-Fi physical-layer data rates have increased by more than 1,000 times since early commercial generations.
- Wi-Fi 7 combines spectrum across the 2.4 GHz, 5 GHz, and 6 GHz bands to improve throughput and stability.
- The global Wi-Fi market was valued at $43.2 billion in 2025 and is projected to reach $135.6 billion by 2035.
- Enterprise shipments of Wi-Fi 7 access points reached 12% of new WLAN units in the first quarter of 2025.
- The global Wi-Fi chipset market size was valued at $22.75 billion in 2025 and is expected to hit $38.05 billion by 2034.
Mobile Networking Market by Region
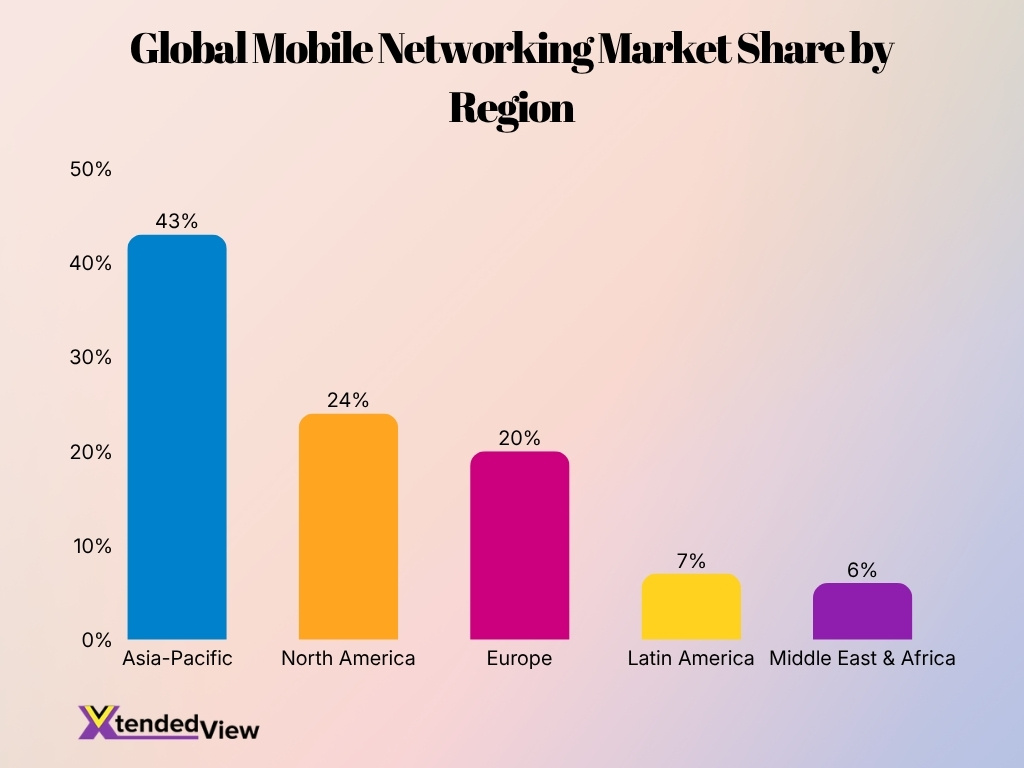
- Asia-Pacific leads the global mobile networking market with a 43% share, supported by rapid 5G deployment, rising smartphone adoption, and expanding digital infrastructure.
- North America accounts for 24% of the market, making it the second-largest region due to strong telecom investments and early adoption of advanced mobile technologies.
- Europe holds a 20% market share, driven by continued network modernization, growing mobile data consumption, and broader 5G coverage.
- Together, Asia-Pacific, North America, and Europe represent 87% of the global market, showing that mobile networking demand is heavily concentrated in developed and fast-growing regions.
- Latin America contributes 7%, reflecting steady growth as telecom operators expand broadband access and upgrade mobile network infrastructure.
- The Middle East and Africa account for 6%, the smallest regional share, but increasing connectivity investments may create significant long-term growth opportunities.
- Asia-Pacific’s share is 19 percentage points higher than North America’s, highlighting its dominant position in the global mobile networking industry.
5G Networking Statistics
- Global 5G subscriptions surpassed 3 billion by June 2026, marking another major adoption milestone.
- 5G networks carried approximately half of global mobile data traffic in 2026.
- 5G coverage reached 55.1% of the world’s population in 2025.
- Coverage remained uneven: about 84% of people in high-income economies could access 5G, compared with only 4% in low-income countries.
- 5G represented 33% of mobile subscriptions across reporting developed economies at the end of 2024.
- Total 5G subscriptions in those economies increased 48% year over year, outpacing mature 4G services.
- Around 70% of fixed wireless access providers offered their service through 5G networks in 2026.
- The rise in 5G fixed wireless access gives households and small businesses another broadband option where cable or fiber coverage remains limited.
- 5G growth has also increased demand for fiber backhaul because cellular sites need high-capacity connections to transport traffic into core networks.
- Operators increasingly use 5G standalone cores, network slicing, and differentiated connectivity to support factories, logistics, public safety, and enterprise applications.
Ethernet and LAN Statistics
- Ethernet data center switch sales rose by more than 40% year over year in the first quarter of 2025, the strongest growth recorded since separate market tracking began in 2013.
- Sales of 800 Gbps Ethernet switches exceeded $1 billion in the first quarter of 2025.
- Quarterly Ethernet data center switch revenue reached a record $8 billion in the third quarter of 2025.
- Total Ethernet data center switch sales in 2025 nearly doubled compared with 2022 revenue, largely because AI clusters required faster back-end networks.
- Shipments of 800 Gbps Ethernet ports surpassed 20 million units within three years of commercial availability.
- By comparison, 400 Gbps Ethernet required approximately six to seven years to cross the same 20-million-port milestone.
- Speeds of 100 Gbps, 200 Gbps, and 400 Gbps generated more than two-thirds of front-end data center switch sales in the third quarter of 2025.
- Most 800 Gbps Ethernet shipments in 2025 supported back-end networks that connect processors inside AI and high-performance computing clusters.
- Front-end networks still generated well over half of total Ethernet data center switch sales in the third quarter of 2025.
- Open networking also continues to expand. Earlier forecasts projected that SONiC could reach 10% to 20% penetration among large enterprises and second- and third-tier cloud providers by 2027.
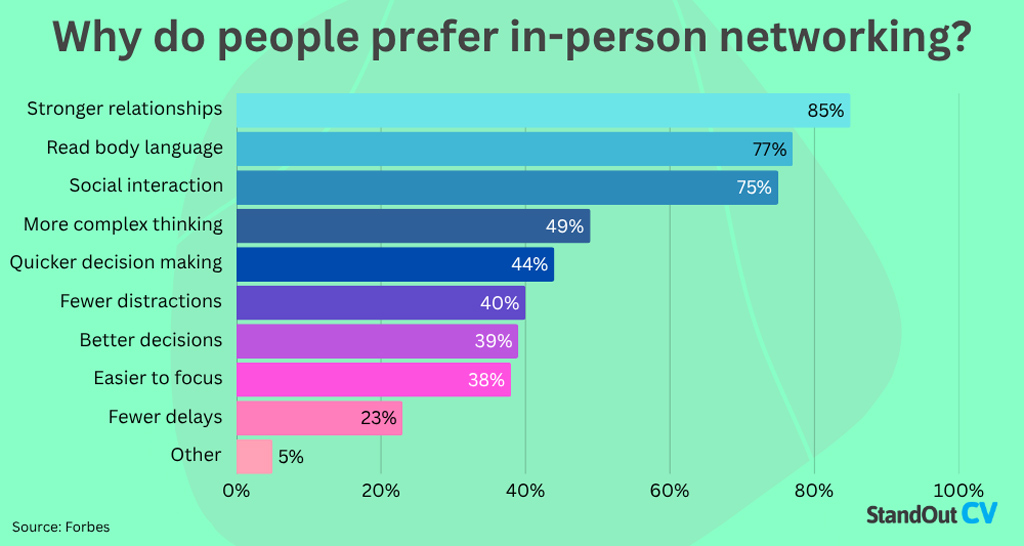
Key Reasons People Prefer In-Person Networking
- Stronger relationships are the leading benefit, cited by 85% of respondents, showing that face-to-face meetings help build deeper professional connections.
- The ability to read body language was selected by 77%, highlighting the importance of nonverbal communication during networking conversations.
- Social interaction ranked third at 75%, indicating that people value the personal engagement offered by in-person events.
- Nearly half of respondents, 49%, believe face-to-face networking supports more complex thinking and detailed discussions.
- Quicker decision-making was reported by 44%, suggesting that direct conversations can accelerate agreements and business outcomes.
- Fewer distractions were mentioned by 40%, while 39% said in-person networking helps them make better decisions.
- Around 38% find it easier to focus during face-to-face interactions compared with virtual networking environments.
- Only 23% selected fewer delays, making it one of the less frequently cited benefits of in-person networking.
- Just 5% chose other reasons, showing that most preferences were captured by the main listed benefits.
Network Security Statistics
- The global average cost of a data breach reached a record $4.99 million in 2026, up 12% from the previous year. Higher detection, escalation, and lost-business costs drove the increase.
- AI-driven cyberattacks increased 56% year over year in 2026. Deepfake impersonation and AI-assisted malware generated the largest volume of these incidents.
- AI model inversion attacks produced an average breach cost of $6 million, reflecting the value and sensitivity of training data, model outputs, and proprietary information.
- Organizations that extensively used security AI and automation saved an average of $1.93 million per breach compared with organizations that did not use these tools.
- Software vulnerability exploitation became the leading initial access method in 2026, accounting for 31% of breaches. Credential abuse fell to 13%.
- Ransomware appeared in 48% of breaches analyzed in 2026, although more organizations refused to pay attackers or negotiated lower payments.
- Generative AI supported 15% of documented attack techniques in 2026. Attackers used it to identify weaknesses, write malicious code, and improve social engineering campaigns.
- Mobile phishing and social engineering attempts generated 40% higher click rates than comparable attacks delivered through traditional desktop channels.
- Third-party involvement appeared in 30% of breaches reported in 2025, twice the share recorded in the prior reporting period. This trend increases the importance of supplier and software-chain monitoring.
- European authorities analyzed 4,875 cybersecurity incidents between July 2024 and June 2025. Distributed denial-of-service attacks represented 77% of reported incidents, while ransomware caused the greatest operational impact.
Regional Networking Statistics
- Internet adoption reached between 88% and 93% across Europe, the Americas, and the Commonwealth of Independent States in 2025. These regions remained closest to universal connectivity.
- Internet use reached 77% in Asia-Pacific in 2025, up from 50% in 2019. The region combines mature fiber and 5G markets with countries that still face affordability and coverage gaps.
- The Arab States recorded 70% internet adoption in 2025, compared with 54% in 2019. Mobile broadband coverage reached approximately 95% across the region.
- Africa had the lowest regional internet-use rate at 36% in 2025. However, that figure increased from 25% in 2019.
- Internet use reached 34% in the least developed countries and 38% in landlocked developing countries during 2025. Their annual user growth rates reached 7.4% and 5.5%, respectively.
- Europe led regional 5G population coverage at 74% in 2025, followed by Asia-Pacific at 70% and the Americas at 60%.
- The Arab States recorded only 13% 5G population coverage in 2025, despite high overall mobile broadband availability. Deployment remained concentrated in higher-income markets.
- India, Nepal, and Bhutan generated an average of 37 GB of mobile data per smartphone each month in 2025, the highest regional level in the published forecast.
- North American and Western European smartphone users each consumed an average of 25 GB per month in 2025, compared with 5 GB in sub-Saharan Africa.
- Sub-Saharan Africa had 1.05 billion mobile subscriptions in 2025. That number could reach 1.31 billion by 2031 as users migrate from 2G and 3G to newer network generations.
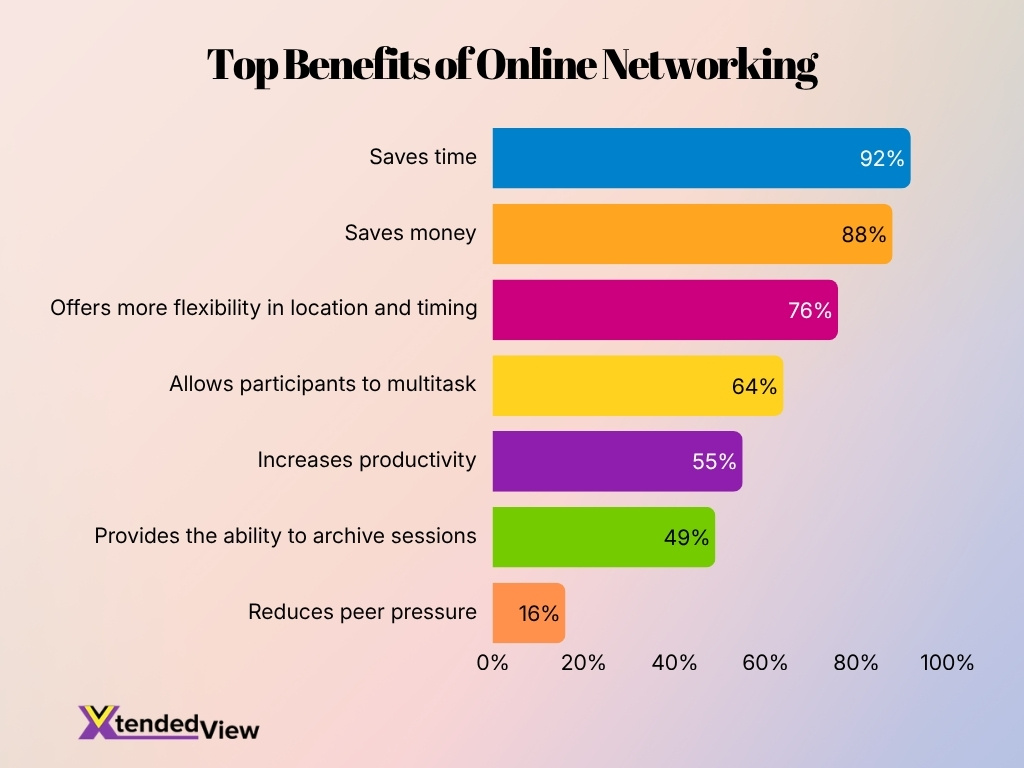
Benefits of Online Networking
- Saving time is the leading benefit of online networking, cited by 92% of participants, showing its strong efficiency advantage over in-person interactions.
- Saving money ranks second at 88%, as virtual networking reduces travel, venue, accommodation, and related participation costs.
- Around 76% of participants value the greater flexibility in location and timing, making networking more accessible across different schedules and regions.
- Multitasking is considered a major advantage by 64%, allowing participants to manage other responsibilities while attending online sessions.
- More than half of respondents, or 55%, believe online networking increases productivity by simplifying communication and reducing unnecessary travel time.
- The ability to archive and revisit sessions benefits 49% of participants, helping them review discussions, presentations, and important information later.
- Only 16% identified less peer pressure as a key advantage, making it the least commonly reported benefit of online networking.
Networking Challenges and Risks
- 2.2 billion people remained offline in 2025, even though six billion people had internet access. Most unconnected people lived in low- and middle-income economies.
- Internet adoption reached 94% in high-income countries but only 23% in low-income countries. This 71-point gap shows that network availability, affordability, and device access remain uneven.
- Approximately 96% of people without internet access lived in low- and middle-income countries in 2025. Network expansion alone will not close the divide without lower service and device costs.
- Urban internet adoption reached 85%, compared with 58% in rural communities. Africa recorded the widest urban-rural usage ratio at 2.6.
- Men had a global internet-use rate of 77%, while women recorded 71%. This difference represented approximately 280 million more male than female internet users.
- Africa’s gender parity score improved from 0.70 in 2019 to 0.78 in 2025, but it remained below every other major region.
- Dense urban network locations can experience traffic demand up to 1,000 times higher than rural locations, making national or regional averages unreliable for local capacity planning.
- Vulnerability exploitation increased 34% in the 2025 breach dataset, driven partly by attacks against edge devices and unpatched internet-facing systems.
- Only 26% of critical vulnerabilities in one 2026 public-sector analysis appeared in the main catalog that many organizations use to prioritize remediation. This creates a risk that teams may overlook urgent flaws.
- Public administration represented 38.2% of identified European incidents in one sector analysis. Central governments accounted for 69% of the incidents recorded within that sector.
Networking Trends and Growth
- Global mobile data traffic reached 146 exabytes per month at the end of 2025. Total mobile network traffic, including fixed wireless access, reached 203 exabytes per month.
- Mobile traffic generated by each active smartphone averaged 22 GB per month globally in 2025, up as video, cloud applications, and AI services increased data consumption.
- 5G carried 48% of global mobile data traffic at the end of 2025, compared with 34% at the beginning of the year.
- Global 5G subscriptions reached 3.1 billion in the first quarter of 2026 after operators added 162 million subscriptions during the quarter.
- Approximately 390 operators had launched commercial 5G services by mid-2026, including more than 90 operators with standalone 5G networks.
- Commercial differentiated-connectivity offerings based on standalone 5G network slicing increased from 65 in late 2025 to 84 by June 2026.
- 83% of surveyed mobile service providers offered fixed wireless access in 2026, while 175 providers delivered the service through 5G.
- The share of fixed wireless access providers using 5G increased by 14 percentage points in one year, reaching 71% in 2026.
- The three largest U.S. wireless providers added almost 1 million fixed wireless connections during the first quarter of 2026. Their combined customer base exceeded 17 million connections.
- India’s two leading fixed wireless providers had nearly 17 million combined connections at the end of the first quarter of 2026, demonstrating rapid adoption outside North America.
Future of Networking
- Global 5G subscriptions could reach 6.4 billion by 2031, more than twice the total recorded in early 2026. They would represent about two-thirds of all mobile subscriptions.
- Standalone 5G subscriptions could reach 3.9 billion by 2031, accounting for approximately 60% of all 5G subscriptions.
- 5G networks could carry 85% of mobile data traffic by 2031, up from 48% at the end of 2025.
- Monthly global mobile data traffic is forecast to reach 328 exabytes by 2031, about 2.2 times its 2025 level.
- Total mobile network traffic, including fixed wireless access, could reach 515 exabytes per month by 2031. This represents approximately 2.5 times the 2025 volume.
- Fixed wireless access connections are forecast to increase from 185 million in 2025 to 350 million in 2031. They could account for 17% of fixed broadband connections.
- Close to 85% of fixed wireless connections may use 5G by 2031. Those connections could provide broadband service to approximately 1.4 billion people.
- Fixed wireless access traffic could exceed 187 exabytes per month by 2031, representing 36% of total mobile network traffic.
- India could reach 1.1 billion 5G subscriptions by 2031, equal to an estimated 81% subscription penetration rate.
- Emerging 6G subscriptions may begin generating measurable traffic before 2031, although their share of global mobile data use will remain small during the initial rollout period.
Frequently Asked Questions (FAQs)
Approximately 6 billion people, or 74% of the global population, used the internet in 2025, while 2.2 billion people remained offline.
Global 5G subscriptions surpassed 3 billion in the first quarter of 2026, and 5G carried about half of worldwide mobile data traffic.
Worldwide mobile network data traffic reached approximately 210 exabytes per month in the first quarter of 2026, representing 22% year-over-year growth.
Fiber represented 47% of fixed broadband subscriptions across OECD economies at the end of 2024, up from 28% in 2019.
The global average cost of a data breach was $4.44 million in 2025, while the U.S. average reached $10.22 million.
Conclusion
Networking enters the year under pressure from AI workloads, mobile traffic growth, hybrid work, and expanding security threats. Six billion people now use the internet, while 5G subscriptions have passed 3.1 billion and mobile data traffic continues to rise.
However, 2.2 billion people remain offline, and the average data breach now costs $4.99 million. Organizations that combine capacity planning, secure infrastructure, and automated network management will stand in the best position to support future digital services.
