



The internet continues to shape how people work, shop, learn, communicate, and access essential services. Businesses rely on it to power e-commerce, cloud applications, digital advertising, and AI-driven customer experiences, while governments and healthcare providers use connected services to deliver public resources and telemedicine. As internet adoption reaches new milestones, understanding the latest statistics helps businesses, marketers, researchers, and policymakers make better decisions. Explore the data below to see how the global internet landscape continues to evolve.
Editor’s Choice
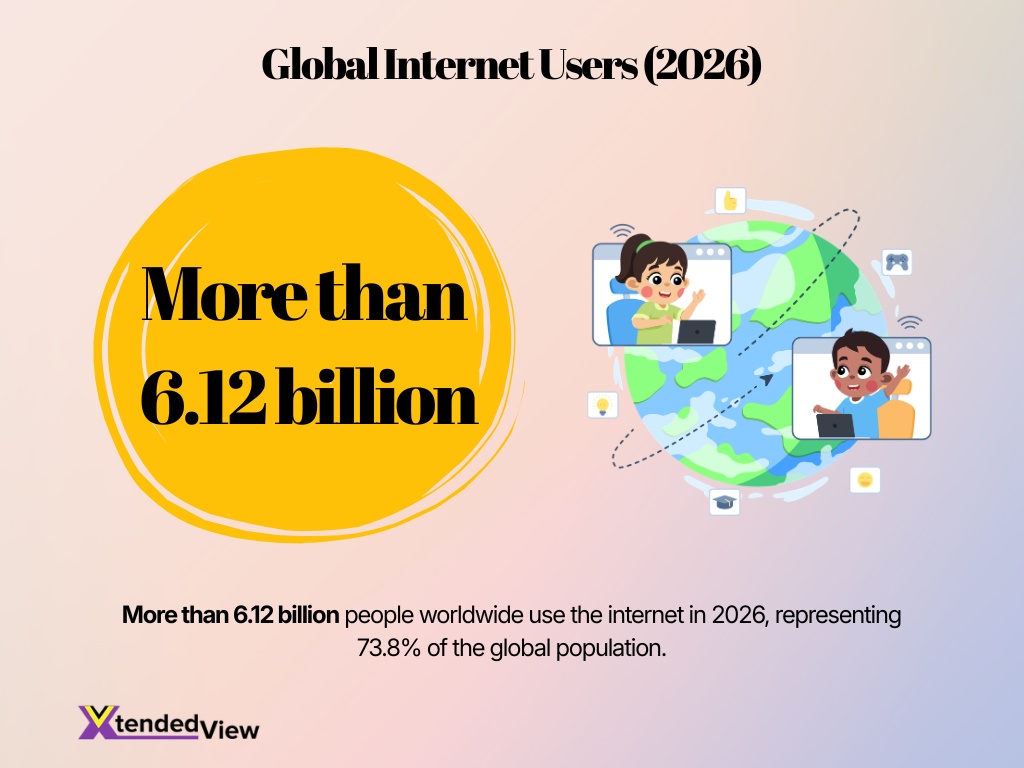
- More than 6.12 billion people worldwide use the internet in 2026, representing 73.8% of the global population.
- Around 2.2 billion people remain offline despite continued expansion in global connectivity.
- Global internet users increased by approximately 59 million year over year by April 2026.
- The United States recorded 324 million internet users by the end of 2025, with internet penetration reaching 93.1%.
- Worldwide social media identities reached 5.79 billion in 2026, equal to 69.9% of the global population.
- Active users of generative AI services climbed to 2.42 billion globally in 2026 after growing 141% over the previous year.
- Global internet traffic expanded by 19% during 2025, reflecting increasing reliance on cloud platforms, streaming, AI, and connected services.
- Mobile broadband now reaches over 96% of the world’s population through at least 3G coverage, while 5G coverage exceeds 55% globally.
Recent Developments
- Internet penetration increased to 73.8% of the world’s population in April 2026, continuing the steady expansion of global connectivity.
- The number of active generative AI users more than doubled between April 2025 and April 2026, reaching 2.42 billion users.
- Global social media identities grew by 294 million over the past year, marking annual growth of 5.4%.
- Internet traffic increased 19% year over year during 2025 as AI applications and digital services expanded worldwide.
- Governments accounted for nearly half of major internet disruptions observed globally during 2025.
- Post-quantum encryption now protects 52% of human internet traffic, reflecting growing adoption of next-generation security technologies.
- More than 25 record-breaking DDoS attacks were recorded during 2025, highlighting rising cybersecurity threats.
- Google remained the world’s most popular internet service, while ChatGPT continued to lead the generative AI category during 2025.
Global Internet Overview
- Approximately 6.12 billion people are connected to the internet globally in 2026.
- Global internet penetration reached 73.8%, meaning nearly three out of every four people now use the internet.
- Internet adoption stood at 73.2% in late 2025 before increasing further in 2026.
- Around 2.2 billion people still lack internet access worldwide.
- India now has more than 1 billion internet users, making it one of the world’s largest online populations.
- China has nearly 1.3 billion internet users, accounting for more than one-fifth of all global internet users.
- Internet users have doubled globally in roughly 11 years, growing from 3 billion in 2014 to over 6 billion today.
- Urban internet usage reached 85.4%, compared with 58.2% in rural areas worldwide during 2025.
- Active mobile broadband subscriptions average 99.4 per 100 people globally.
Internet User Demographics
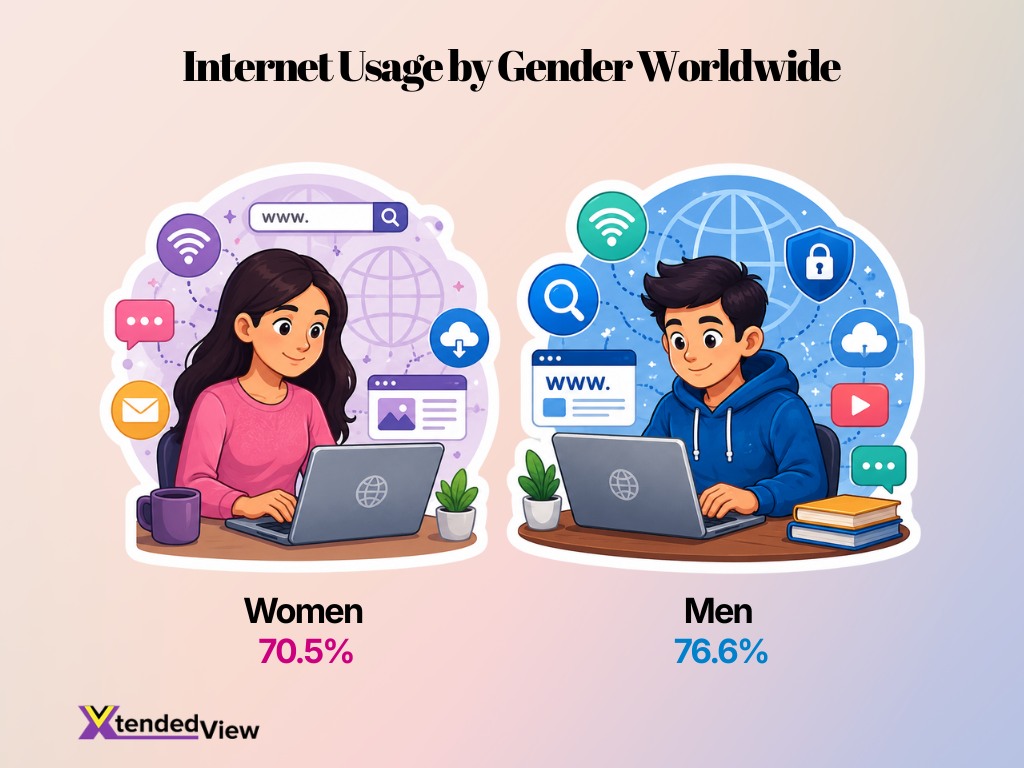
- 70.5% of women worldwide use the internet, compared with 76.6% of men, showing the digital gender gap continues to narrow.
- Women account for nearly 240 million fewer internet users than men globally.
- Men remain roughly 7% more likely than women to use the internet worldwide.
- Internet adoption among urban residents reaches 85.4%, significantly exceeding rural adoption levels.
- Rural internet adoption stands at 58.2%, highlighting ongoing infrastructure challenges.
- The United States has an internet penetration rate of 93.1%, among the highest globally.
- China reports internet adoption above 91%, reflecting continued digital expansion across the country.
- Approximately 70% of India’s population now uses the internet, surpassing one billion connected users.
Average Time Spent Online Statistics
- Global internet users spend an average of 6 hours and 38 minutes online per day.
- Roughly 73.8% of the global population, or 6.12 billion people, are currently online.
- Users spend an average of 33 hours and 13 minutes per week consuming online media.
- Mobile devices account for approximately 58% of total daily internet usage time.
- An average of 2 hours and 21 minutes is spent daily on social media platforms.
- The average internet user engages with 6.8 different platforms every single month.
- Video streaming content accounts for roughly 65% of all downstream internet traffic.
- Generative AI platforms now attract approximately 2.42 billion active users monthly.
- People aged 16 to 24 spend the most time online, averaging over 9 hours daily.
Internet Access Trends by Connection Type
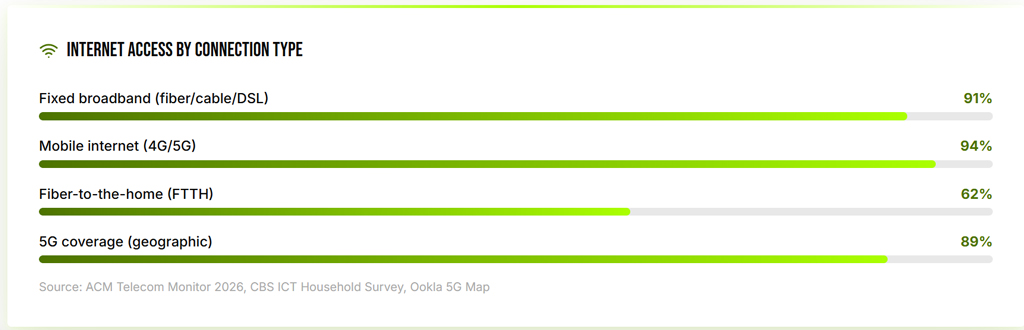
- Mobile internet (4G/5G) leads overall access at 94%, making it the most widely available connection type.
- Fixed broadband reaches 91%, showing that fiber, cable, and DSL remain essential for household connectivity.
- Geographic 5G coverage stands at 89%, indicating broad network availability across most locations.
- Fiber-to-the-home (FTTH) access is significantly lower at 62%, highlighting a gap in direct fiber infrastructure.
- The difference between mobile internet and FTTH access is 32 percentage points, showing that mobile networks are expanding faster than full-fiber connections.
Mobile Internet Statistics
- 83.7% of all cellular mobile connections worldwide now come from smartphones.
- Smartphones represent approximately 86.9% of all mobile handsets in active use globally.
- Mobile broadband coverage reaches 96.3% of the world’s population through at least 3G networks.
- LTE coverage extends to 92.7% of the global population.
- 5G networks now cover 55.1% of the world’s population.
- Global mobile broadband subscriptions average 99.4 per 100 people.
- The United States recorded 417 million mobile connections, equal to 120% of its population.
- Median mobile internet download speeds in the United States reached 154.48 Mbps, increasing nearly 49% year over year.
- Global mobile data traffic per subscription reached 184 GB annually during 2025.
Broadband and Internet Speed Statistics
- The world recorded 20.1 fixed-broadband subscriptions per 100 people in 2025, up from fewer than 8 subscriptions per 100 people in 2015.
- Active mobile-broadband penetration reached 99 subscriptions per 100 people in 2025. Mobile broadband represented 89% of all mobile subscriptions, compared with less than half in 2015.
- At least 3G mobile broadband covered 96.3% of the global population in 2025.
- LTE or WiMAX networks reached 92.7% of people worldwide, creating a broad base for video calls, streaming, mobile banking and cloud applications.
- Global 5G coverage increased to 55.1% of the population in 2025, although availability remained concentrated in wealthier economies.
- The median price of an entry-level fixed-broadband package equaled 2.5% of monthly gross national income per person in 2025.
- Only 88 of 195 economies met the international affordability target for fixed broadband in 2025, although the total increased by 10 economies from 2024.
- A fixed-broadband subscription cost more than 25% of average monthly income in a typical low-income economy, putting home connections beyond the reach of many households.
- Fiber reached about 60% of US households by late 2025, but only around 20% subscribed to a fiber service, leaving significant room for adoption growth.
Internet Penetration by Age Group
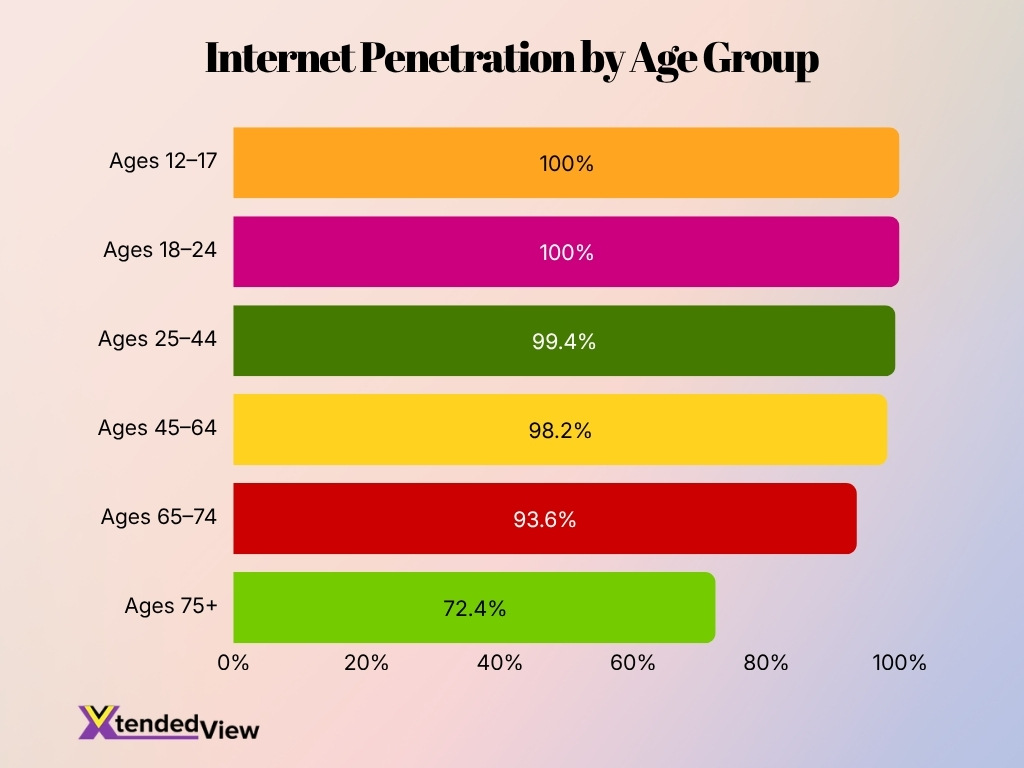
- Internet penetration is universal among younger users, reaching 100% for both the 12–17 and 18–24 age groups.
- Adults aged 25–44 also show near-total adoption, with an internet penetration rate of 99.4%.
- Among people aged 45–64, internet usage remains exceptionally high at 98.2%, showing broad adoption across working-age adults.
- Internet penetration declines slightly among adults aged 65–74, but still stands at a strong 93.6%.
- The 75+ age group records the lowest internet penetration rate at 72.4%, indicating a notable digital divide among the oldest users.
- The gap between the youngest and oldest age groups is 27.6 percentage points, highlighting age as a key factor in internet access.
- Overall, the data shows that internet usage is nearly universal for people under 65, while adoption drops more significantly among adults aged 75 and older.
Digital Divide and Internet Accessibility Statistics
- Around 2.2 billion people remained offline in 2025, even as the global online population reached 6 billion.
- Global internet adoption rose from 71% in 2024 to 74% in 2025, adding roughly 200 million users in one year.
- Internet use reached 85% among urban residents, compared with only 58% among rural residents in 2025.
- The global urban-to-rural internet-use ratio narrowed from 1.6 to 1.5 over four years, but progress remained modest.
- In Africa, urban residents were 2.6 times more likely to use the internet than rural residents. Europe’s corresponding ratio stood at just 1.1.
- Only 14% of rural residents in low-income countries used the internet in 2025, equal to slightly more than one-third of the urban adoption rate in those economies.
- Globally, 77% of men and 71% of women used the internet in 2025, leaving around 280 million more men than women online.
- Internet services remained unaffordable in about 60% of low- and middle-income economies in 2025.
- The median mobile-broadband basket cost 1.4% of monthly income per person globally, but consumers in low-income economies spent about 22 times the income share paid in high-income economies.
- For the bottom 40% of earners in low-income and least-developed economies, mobile connectivity costs consumed about 20% of income per person.
Internet Freedom and Censorship Statistics
- Global internet freedom declined for the 15th consecutive year from June 2024 to May 2025.
- Internet conditions worsened in 28 out of 72 assessed countries, while only 17 countries saw improvements.
- The evaluated nations represent approximately 89% of the world’s total internet users.
- Individuals faced arrest for their online expression in a record-breaking 57 different countries.
- Half of the 18 countries classified as Free recorded lower internet-freedom scores, with only three improving.
- China and Myanmar ranked as the two worst online environments, while Iceland remained the highest.
- Kenya suffered the steepest decline following a seven-hour internet shutdown during nationwide protests.
- Bangladesh achieved the greatest improvement despite a previous 11-day mobile internet restriction in July 2024.
- The assessment utilizes 21 specific indicators covering access barriers, content restrictions, and user rights violations.
Countries With the Largest Internet User Bases
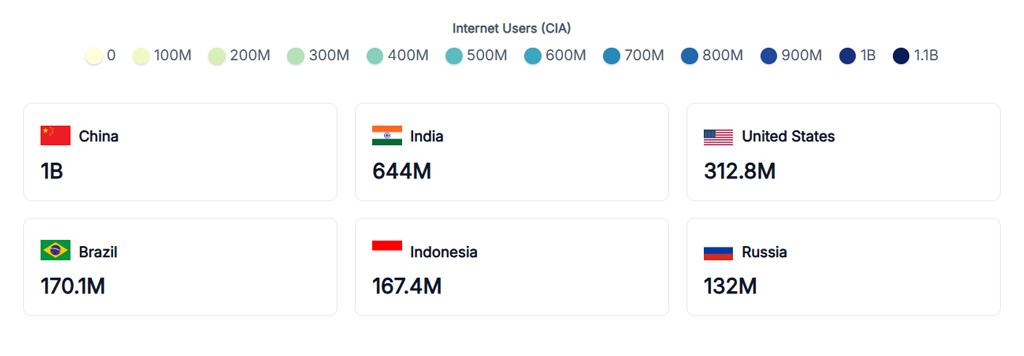
- China leads the ranking with approximately 1 billion internet users, making it the world’s largest online population.
- India ranks second with 644 million users, representing one of the biggest digital markets globally.
- The United States has around 312.8 million internet users, less than half of India’s total.
- Brazil records 170.1 million users, giving it the largest internet audience in Latin America among the listed countries.
- Indonesia follows closely with 167.4 million users, only 2.7 million fewer than Brazil.
- Russia has approximately 132 million internet users, the lowest figure among the six countries shown.
- Together, these six countries account for more than 2.42 billion internet users, highlighting their major influence on the global digital economy.
Online Activities and User Behavior Statistics
- Online adults used an average of 6.75 social and communication platforms per month in the second quarter of 2025.
- The average declined slightly from 6.86 platforms in late 2024, suggesting that people continued to use several services but consolidated some activity.
- Connected adults used social media on an average of 4.21 days per week in 2025.
- Adults aged 16 to 24 used social media on 4.6 days per week, making them the most frequent age group.
- Men aged 65 and older used social media on an average of 2.81 days per week, the lowest rate among the measured demographic groups.
- Internet users spent more than one hour per day browsing conventional social networks. Including video platforms raised consumption to more than 2½ hours daily.
- Combined social and online-video activity averaged 18 hours and 36 minutes per week for each connected adult.
- Women aged 16 to 24 spent 25 hours and 45 minutes per week viewing social and video feeds, or more than 3 hours and 40 minutes per day.
- More than 1 billion people used large language models and generative AI services each month in 2025, adding AI assistants to common online activities such as search, research and writing.
- Social media users reported an average of 4.69 different reasons for using social platforms, showing that activity extends beyond communication to news, entertainment, shopping and brand research.
Website and Domain Statistics
- The internet contained 386.9 million registered domain names across all top-level domains at the end of 2025.
- Total registrations increased by 22.7 million, or 6.2%, between the fourth quarters of 2024 and 2025.
- Registrations grew by 8.4 million in the fourth quarter alone, representing a 2.2% quarterly increase.
- The .com domain base totaled 161 million registrations, while .net accounted for another 12.5 million.
- New .com and .net registrations reached 10.7 million in the fourth quarter of 2025, up from 9.5 million in the corresponding 2024 quarter.
- The combined .com and .net renewal rate stood at approximately 75% during the final quarter of 2025.
- Country-code domains reached 145.6 million registrations, increasing 3.4% from the previous year.
- New generic domains increased 29.9% year over year to 47.8 million registrations. They represented 12.4% of all registered domains.
- The 10 largest country-code extensions accounted for 57.4% of all country-code registrations at the end of 2025.
- The 10 largest generic extensions represented 88.9% of generic-domain registrations and 55.4% of all registered domains.
Web Browser and Search Engine Statistics
- Chrome held approximately 69.5% of the worldwide browser market in mid-2025, giving it more than four times the share of its nearest competitor.
- Safari accounted for about 15.3% of browser use, supported by its default position across iPhones, iPads and Mac computers.
- Edge captured approximately 5.2% of the global browser market in mid-2025.
- Chrome for Android alone represented 41.49% of worldwide browser-version activity in June 2026.
- Safari on iPhone generated 12.39% of worldwide browser-version activity in June 2026.
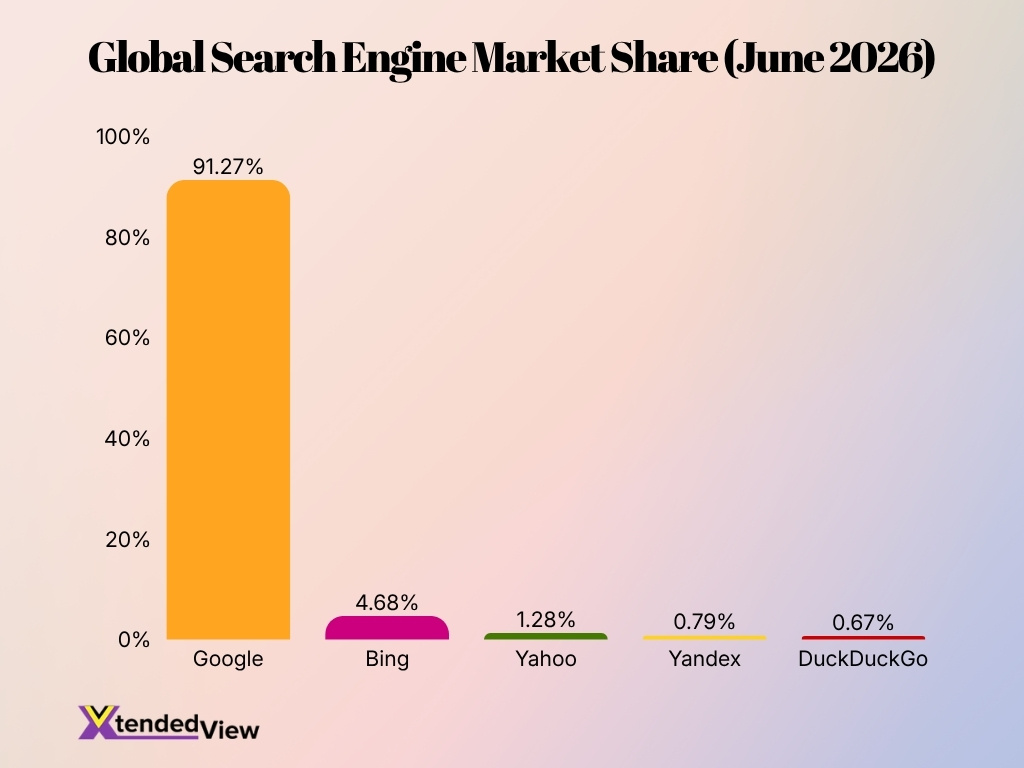
- Google handled 91.27% of worldwide search-engine activity in June 2026.
- Bing held 4.68% of global search activity, making it the second-largest traditional search engine.
- Yahoo accounted for 1.28% of global searches, while Yandex held 0.79%.
- DuckDuckGo captured 0.67% of worldwide search activity in June 2026.
- Search engines remained central to online discovery in 2025 despite the rapid rise of AI assistants, which had already attracted more than 1 billion monthly users.
Internet Traffic Statistics
- Global internet traffic grew by 19% in 2025, driven by cloud and AI expansion.
- Fixed-broadband subscribers averaged 4.43 TB of data usage per subscription in 2025.
- Mobile-broadband subscriptions generated an average of 184 GB of traffic during 2025.
- Satellite internet traffic doubled in 2025 as networks expanded into 20 additional countries.
- Automated web requests from the top search crawler made up over 25% of verified bot traffic.
- Over 99% of international data traveled via submarine cable networks rather than satellites.
- Post-quantum encryption protected 52% of human-generated web traffic by the end of 2025.
- Enterprise AI adoption drove significantly accelerated traffic growth in the second half of 2025.
Digital Economy, E-commerce, and Online Advertising Statistics
- Global retail e-commerce sales are projected to hit $6.86 trillion in 2025, accounting for 21% of worldwide retail sales.
- Global advertising spend is forecast to reach a record $1.04 trillion in 2026, with digital channels capturing 68.7% of the total investment.
- Algorithm-driven advertising is projected to represent 71.6% of all advertising spend globally by 2026.
- Mobile devices currently drive 77% of all global e-commerce traffic, but account for only 55% to 58% of total sales revenue.
- The global mobile commerce market is anticipated to reach $2.51 trillion in 2025, representing roughly 60% of all e-commerce transactions.
- Digital wallets are expected to make up 53% of online transactions worldwide in 2025 as traditional card usage declines.
- The global cross-border e-commerce market is valued at an estimated $1.74 trillion in 2026, fueled by rising international online shopping.
- By 2030, artificial intelligence is expected to manage 80% of all customer interactions within the e-commerce sector.
Social Media Usage Trends in the Netherlands
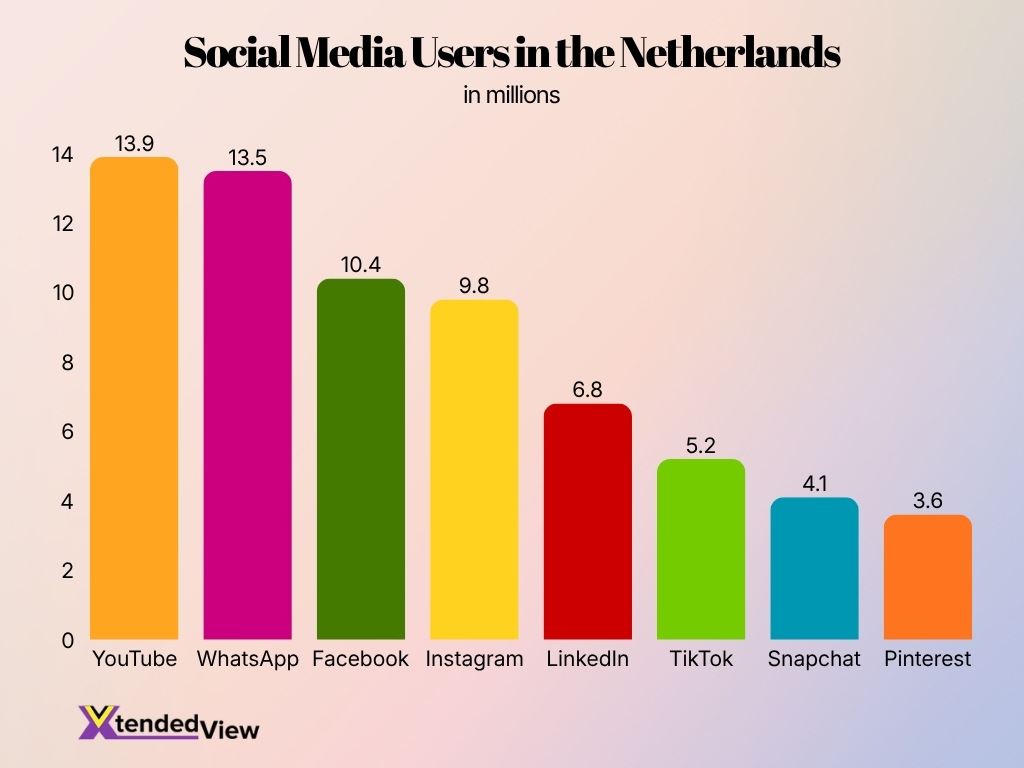
- YouTube leads the Dutch social media market with 13.9 million users, making it the country’s most widely used platform.
- WhatsApp follows closely with 13.5 million users, highlighting its strong role in everyday communication.
- Facebook remains a major platform in the Netherlands, reaching approximately 10.4 million users.
- Instagram has around 9.8 million users, confirming its strong popularity for visual and lifestyle content.
- LinkedIn reaches 6.8 million users, reflecting substantial professional and business networking activity.
- TikTok records 5.2 million users, showing its growing influence among younger and entertainment-focused audiences.
- Snapchat has approximately 4.1 million users, maintaining a notable presence in the Dutch social media landscape.
- Pinterest ranks lowest among the listed platforms with 3.6 million users, but still attracts a sizable interest-based audience.
Internet Security and Cybersecurity Statistics
- More than 25 record-breaking DDoS attacks were successfully executed and observed globally during 2025.
- Civil society and nonprofits ranked as the #1 most frequently attacked sector online throughout 2025.
- Governments were directly responsible for nearly 50% of all major internet disruptions globally in 2025.
- The share of human web traffic shielded by post-quantum encryption reached exactly 52% in 2025.
- Internet disruptions caused by physical cable cuts saw a significant decline of nearly 50% during 2025.
- Malicious and automated bot activity accounted for a massive 51% of all internet web traffic in 2025.
- AI-assisted cyberattacks were heavily utilized and involved in 16% of all recorded security breaches.
- The transition to zero-trust security models and resilience investments helped reduce breach lifecycles to 241 days.
AI and Internet Statistics
- Generative AI reached approximately 2.42 billion active users worldwide in 2026.
- The global generative AI user base expanded by 141% year-over-year in 2026.
- Global AI spending crossed $581.7 billion during 2025.
- Roughly 88% of organizations now use AI in at least one business function.
- Cloud infrastructure accounted for 71.8% of the generative AI market in 2025.
- Private investment in generative AI reached $33.9 billion globally in 2024.
- Over 92% of Fortune 500 companies currently utilize OpenAI’s generative technologies.
- AI workflows are projected to consume 1,500 TWh of electricity annually by 2030.
- The worldwide generative AI market size reached $53.7 billion in 2025.
Future Internet Growth Forecasts
- Global fixed broadband subscribers are projected to exceed 1.6 billion connections worldwide by the end of 2030.
- Global 5G subscriptions will grow to 6.4 billion by 2031, comprising two-thirds of all mobile network connections.
- Total mobile network data traffic is anticipated to reach 515 exabytes per month globally by 2031.
- AI-optimized workloads are expected to consume over 50% of active data center capacity globally by 2031.
- Global satellite broadband subscriptions are forecast to increase from 10 million in 2025 to roughly 33 million by 2031.
- Investments in global AI-ready data centers will demand $5.2 trillion across the compute power value chain by 2030.
- The global 6G technology market is projected to grow from $11.4 billion in 2030 to over $110 billion by 2036.
- Global active data center IT capacity is forecast to grow sixfold by 2035, jumping from 24.4 GW to 147.1 GW.
- Global Internet of Things (IoT) connections are forecast to reach more than 38 billion connected devices by 2030.
Frequently Asked Questions (FAQs)
Approximately 6.12 billion people used the internet in April 2026, equal to nearly 74% of the global population.
About 2.2 billion people remained offline in 2025, down from roughly 2.3 billion in 2024.
Around 55.1% of the world’s population had access to a 5G network in 2025, compared with 51% in 2024.
Fixed-broadband subscriptions generated an average of 4.43 TB per year, while mobile-broadband subscriptions generated 184 GB per year in 2025.
The global total reached approximately 5.79 billion social media user identities in April 2026.
Conclusion
The internet continues to evolve into the foundation of the global digital economy, connecting billions of people, businesses, and devices. Statistics show strong growth in internet adoption, AI usage, mobile connectivity, and digital commerce, while also highlighting persistent challenges such as cybersecurity threats, affordability, and digital inequality. As broadband infrastructure expands, AI reshapes online experiences, and new technologies improve connectivity, organizations that monitor these trends will be better positioned to adapt to changing user behavior and emerging opportunities.
