
Shopping on Instagram has transformed from a casual browse to a full‑fledged commerce channel. Brands and consumers alike are treating the platform as a virtual storefront, rather than just a social feed. For example, a direct‑to‑consumer apparel brand uses Instagram product tags to convert followers into buyers without leaving the app, and a beauty brand embeds shopping posts into its influencer‑led content to drive discovery and purchase in one step.
Editor’s Choice
Here are seven standout statistics for Instagram shopping in 2025 that set the tone for this article.
- 70% of Instagram’s 2 billion users shop on the platform in some way.
- 130 million people tap a product tag on Instagram each month.
- 62% of users say they use Instagram to find info about brands or products.
- Instagram ad revenue is projected to reach $67.27 billion in 2025.
- Among U.S. social media users in 2024, 36.6% reported shopping on Instagram.
- In the U.S., 54.8% of Instagram users are aged 18‑34.
- 46.1% of U.S. Gen Z consumers shop on Instagram monthly.
Recent Developments
- Instagram launched expanded shopping tags, letting brands tag products in posts, Stories, and Reels.
- In 2025, the platform enhanced discovery via its “Shop” tab and dedicated storefront pages within apps.
- Instagram introduced longer‑form Reels (up to 20 minutes) and greater integration of shoppable features inside video content.
- The algorithm now prioritizes content promoting direct purchase or product discovery, making Instagram more like a marketplace.
- Instagram is increasingly being used by DTC brands as a primary commerce channel rather than only a marketing add‑on.
- Features such as product tags, in‑app checkout, and “Collections” of products are becoming standard for brands selling on Instagram.
- Global markets outside the U.S. (e.g., India) show strong growth in Instagram usage for product discovery and purchase.
- Instagram’s shopping features are being layered with influencer collaborations and live‑streaming commerce trends.
Key Instagram Shopping Statistics
- Out of all Instagram users, approximately 44% make purchases through the platform weekly.
- Instagram has over 2 billion monthly active users in 2025.
- In the U.S., an estimated 37.3% of Instagram users will make purchases via the platform in 2025.
- In 2024, U.S. social commerce buyers surpassed 100.7 million, and Instagram accounted for about 36.6% of social‑shopping users.
- Around 61% of Instagram users use it to discover new products.
- More than 90% of Instagram users follow at least one business account.
- Instagram product tags get tapped by 130 million people every month.
- U.S. advertisers on Instagram report that 68% say the platform provides positive ROI.
- Instagram ads now reach approximately 96.6% of active users each month.
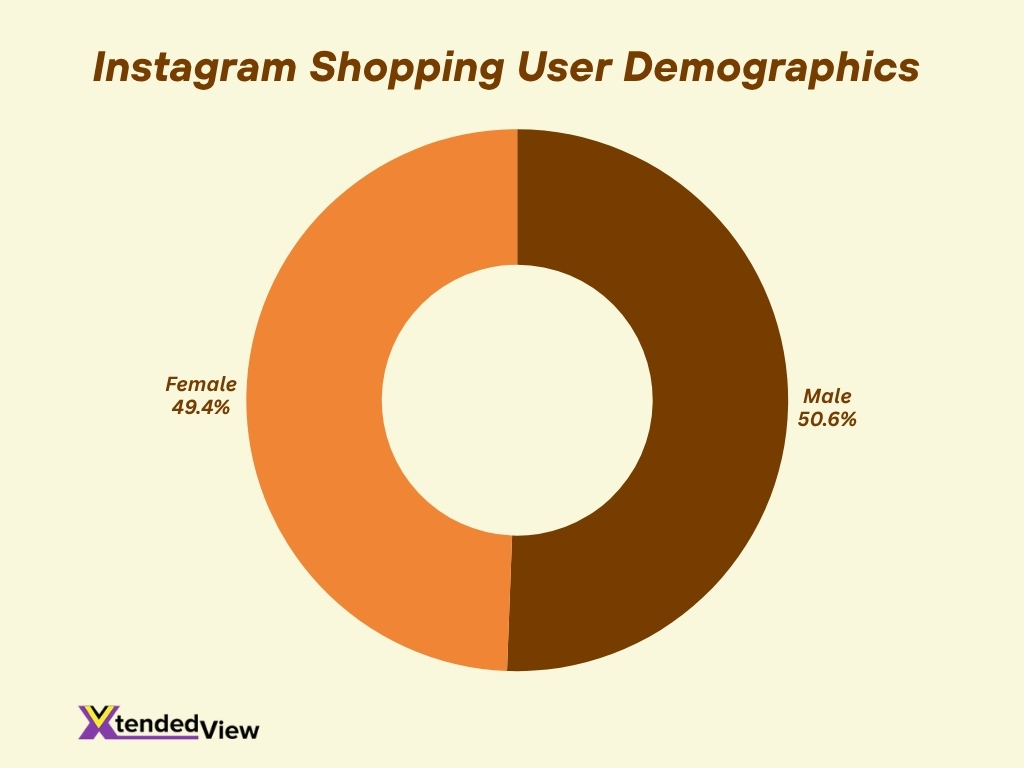
Instagram Shopping User Demographics
- Globally, about 50.6% of Instagram users are male and 49.4% female.
- In the U.S., 55.4% of Instagram users are female.
- The largest age group globally on Instagram is 18‑24 at approximately. 31.7%, followed by 25‑34 at 30.6%.
- Around 62% of Instagram users are aged between 18 and 34 years.
- In the U.S., there are approximately 171.7 million Instagram users as of 2025.
- In the U.S., 54.8% of users are between 18 and 34 years old.
- Global gender distribution is nearly even, about 51.8% male vs 48.2% female in one dataset.
- Usage by younger age groups remains dominant, e.g., under‑35s account for the majority of the audience.
Instagram Shopping Activities and Habits
- About 70% of Instagram users report that they shop or have purchased via the platform in some way.
- Monthly, more than 130 million users tap on product tags in Instagram posts.
- Around 61% of Instagram users say they have discovered a new brand or product on the platform.
- Roughly 44% of Instagram users say they use the app for shopping each week.
- Among U.S. social media users, about 16.2% shop on Instagram two to three times a month.
- Approximately 5.1% of U.S. social media users shop on Instagram at least once a week.
- Within the U.S., about 11% of all social media users say they shop on Instagram at all.
- After viewing a branded Instagram Story, around 62% of viewers say their interest in purchasing that product increases.
- Over 75% of companies in the U.S. are expected to use Instagram in their marketing strategy in 2025.
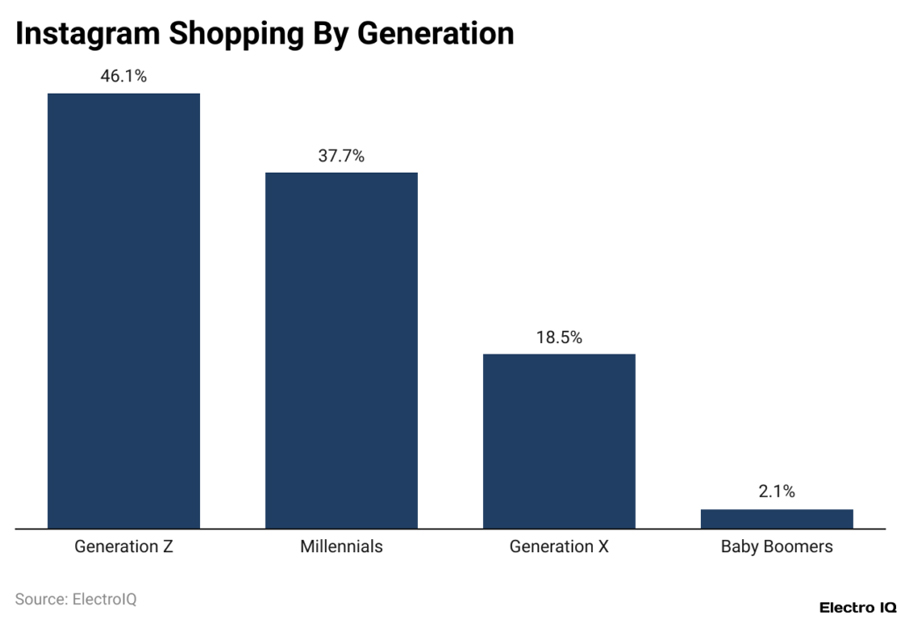
Generational Breakdown of Instagram Shopping
- Generation Z leads the way, with 46.1% of users making purchases on Instagram, highlighting Gen Z’s dominant role in social commerce adoption.
- Millennials follow closely at 37.7%, reinforcing their position as a highly engaged digital-shopping demographic.
- Generation X participation drops significantly to 18.5%, showing lower but still impactful engagement among middle-aged consumers.
- Baby Boomers show minimal activity at just 2.1%, indicating that Instagram commerce remains primarily a young-consumer behavior.
- The data suggests Instagram is most influential among younger generations, with purchasing activity sharply declining with age.
- Brands targeting Gen Z and Millennials stand to gain the most from Instagram-first marketing and commerce strategies.
Instagram Shopping’s Impact on Purchase Decisions
- Approximately 54% of Instagram users say they buy a product after seeing it on the platform.
- Around 36% of Instagram users say they use the platform like a search engine to discover products.
- The conversion rate reported for Instagram ads averages about 1‑2%, with visual industries like fashion and beauty seeing especially strong results.
- Instagram product pages visited via tagged posts generate about 18% higher average order values than other social platforms.
- Businesses report an average ROI of about 420% from Instagram ad campaigns.
- In the U.S., about 42% of social‑media users say they have purchased at least one product using Instagram.
- About 43% of female social‑media users and 41% of male users in the U.S. say they’ve purchased Instagram.
- Brands report that after enabling Instagram shopping features, they observed up to a 42% increase in sales.
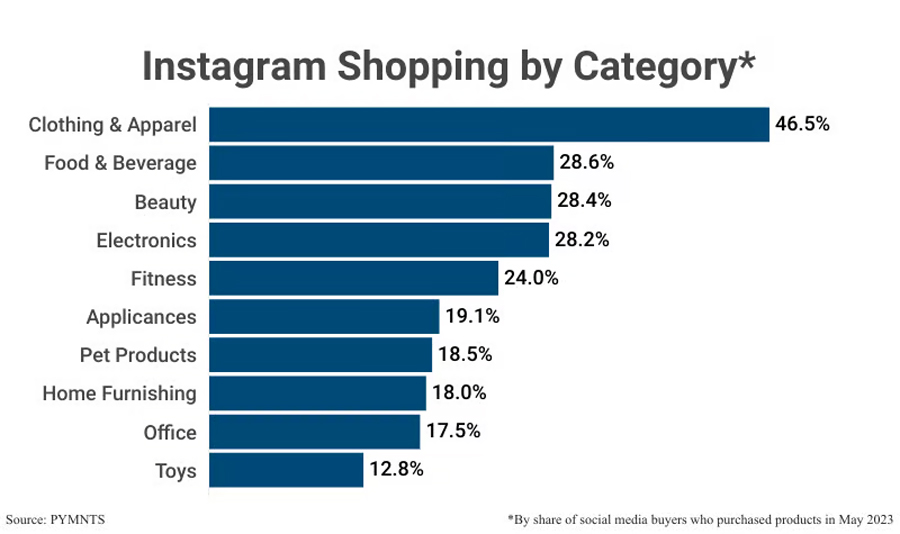
Most Popular Product Categories on Instagram
- Clothing & Apparel leads by a large margin, capturing 46.5% of social media shoppers, showcasing fashion as the platform’s dominant commerce driver.
- Food & Beverage (28.6%), Beauty (28.4%), and Electronics (28.2%) form a close second tier, showing strong consumer interest in everyday essentials and tech.
- Fitness products account for 24.0%, reflecting the rising trend in health and wellness spending.
- Appliances (19.1%) and Pet Products (18.5%) show niche but steady engagement among shoppers.
- Home Furnishing (18.0%) continues to be a growing category as consumers invest in lifestyle upgrades.
- Office supplies (17.5%) see notable demand, likely fueled by the hybrid and remote work culture.
- Toys trail at 12.8%, indicating lower, but still meaningful, engagement for family and gifting categories.
Instagram Shopping and Content Engagement
- Over 90% of Instagram users follow at least one business account.
- About 79% of marketers say Instagram is essential for influencer campaigns.
- Approximately 68% of marketers say Instagram provides a positive ROI for campaigns.
- Among Instagram users, 70% report that they like or at least don’t mind video ads.
- Instagram Reels now generate 27% higher engagement than static feed ads.
- Brands using Instagram Stories with product tags see a measurable lift in engagement and interest in purchasing.
- Approximately 75% of companies are on Instagram in 2025.
- The use of Instagram shopping features in influencer‑driven content is cited as a key driver of engagement and conversion.
Ad Revenue and ROI
- Instagram ad revenue worldwide is estimated at $70.9 billion, with $48.7 billion in the U.S. alone.
- In 2025, Instagram’s global ad revenue is projected to reach about $69.7 billion, reflecting year‑on‑year growth of ~16.3%.
- Instagram ads now convert with an average rate of about 1.6%, compared to Facebook’s 1.1%.
- In the beauty sector, Instagram ads drive an average ROI of approximately 518%.
- Brands report that influencer campaigns on Instagram deliver about $4.12 for every $1 spent.
- Surveys find that 73% of marketers say Instagram delivers the highest ROI among social channels.
- For Story‑format ads, the swipe‑up conversion rate is about 0.7%, while feed ads average about 1.4%.
- Instagram Stories and Reels continue to drive higher ad engagement and are becoming more central to ad campaigns.
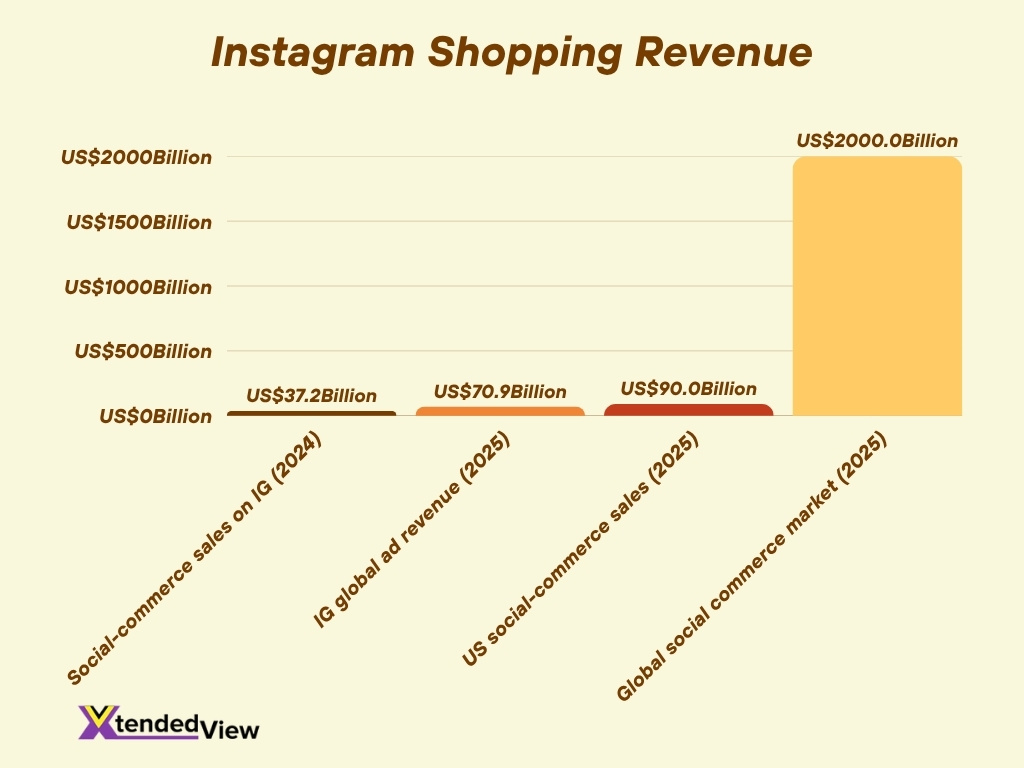
Instagram Shopping Revenue and Growth
- Social‑commerce sales on Instagram were an estimated $37.2 billion in 2024.
- Globally, social commerce is projected to reach a penetration rate of 25% in 2024 and continue growing into 2025.
- In the U.S., social commerce buyers crossed 100.7 million in 2024, and Instagram accounted for roughly 36.6%.
- Instagram’s global ad revenue is projected to hit about $70.9 billion in 2025.
- From 2023 to 2024, Instagram ad revenue showed a growth of approximately 16%.
- Since 2017, Instagram’s total ad revenue is forecasted to grow by nearly 2,000% by 2024.
- In 2025, projected U.S. social‑commerce sales are expected to exceed $90 billion.
Influencer and Brand Marketing on Instagram Shopping
- The global influencer‑marketing industry is projected to reach roughly $24 billion by 2025.
- 79% of marketers say Instagram is an important influencer channel.
- 47% of brands use Instagram for their influencer‑marketing efforts.
- 56% of users purchased a product after seeing it promoted by an influencer.
- Fashion and beauty account for about 48% of influencer campaigns on Instagram.
- Micro‑influencers average around 3.86% engagement, macro‑influencers average 1.21%.
- Long‑term influencer partnerships yield 22% higher participation.
- 61% of consumers trust influencer endorsements more than traditional ads.
- Influencer marketing on Instagram delivers high ROI.
Shopping Features and Tools on Instagram
- Instagram enables clickable product tags in posts, Stories, and Reels.
- Over 25 million registered businesses are on Instagram in 2025.
- Around 90% of Instagram accounts follow at least one business profile.
- 130 million taps on product tags per month.
- Business profiles have access to promotional tools and insights.
- Reels and Stories are key formats for shoppable content.
- Instagram Checkout is available in some markets.
- Instagram is now a “video‑first platform.”
- Promo tools, shopping tags, and business insights are standard.
Mobile Usage and Engagement Rates
- Average daily time on social media is 2 hours 21 minutes, mostly on mobile.
- In the U.S., mobile devices dominate Instagram access and shopping.
- Instagram Reels generate ~27% higher engagement than feed posts.
- Instagram has higher engagement rates compared to other platforms.
- 70% of users don’t mind video ads.
- 46.8 million U.S. users made purchases on Instagram in 2024.
- Mobile‑optimized features improve conversion rates.
- 7% of U.S. consumers begin shopping searches on Instagram.
- Mobile‑first interface tools are now standard.
Instagram vs. Other Social Commerce Platforms
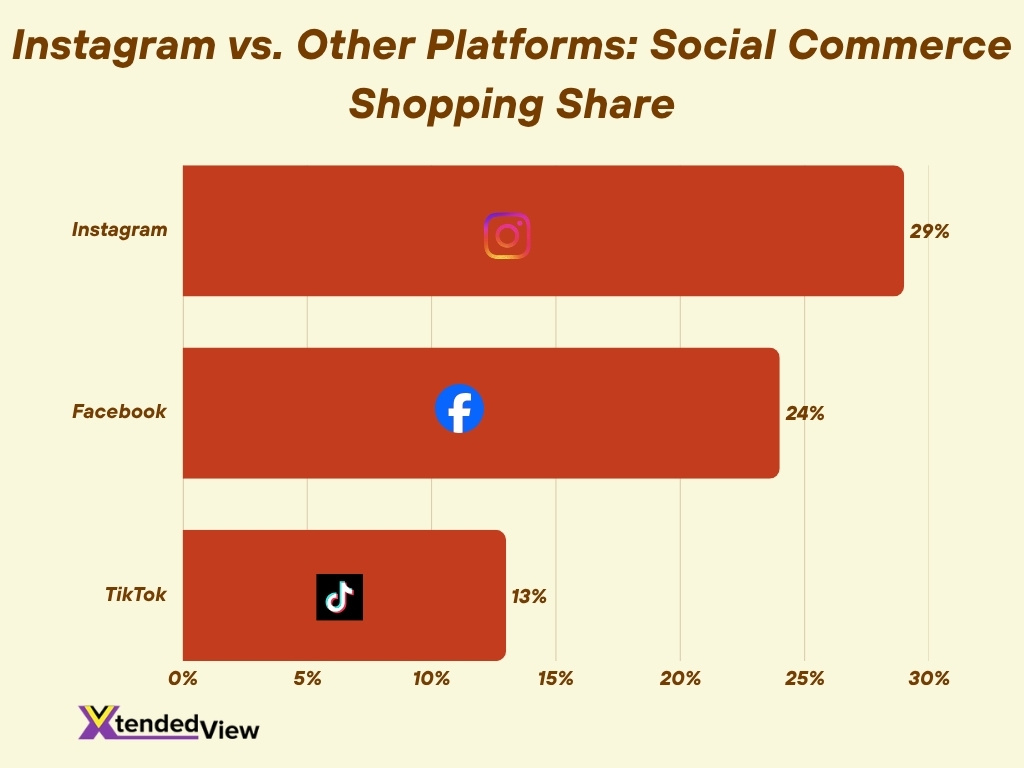
- 29% of users make purchases on Instagram, making it the third‑most used social platform for shopping.
- In the U.S., social commerce sales via all platforms are projected to surpass US$90 billion in 2025.
- In 2024, Facebook led with ~24%, followed by Instagram at ~20%, then TikTok at ~13%.
- The global social commerce market is projected to reach $2 trillion+ by 2025.
- Instagram often matches or exceeds engagement and conversion metrics for visual‑heavy content.
- 69% of marketers believe shopping will increase on social media.
- Local platforms outperform Instagram in some markets.
- Micro‑influencers and creator‑led commerce on Instagram often yield higher engagement than standard ads.
Global vs. Regional Instagram Shopping Trends
- U.S. social commerce sales to reach US$114.7 billion by 2025.
- The Indian social commerce market is projected to hit US$20 billion.
- Global penetration is estimated at 24% in 2025.
- In China, 95% of consumers engage in social commerce.
- Europe shows 19%+ growth in select regions.
- In Spain and Portugal, 57% of Gen Z use Instagram for shopping.
- 21.9% of Americans use Instagram monthly to shop.
- Instagram reach is highest in countries like Turkey, India, and Brazil.
- Global strategies require regional tailoring.
Challenges Facing Instagram Shopping
- Growth is slowing to ~19.5% in 2025.
- Limited in‑app checkout in some regions.
- Difficulty in measuring attribution across devices.
- Influencer fatigue and saturation.
- Privacy and data‑tracking regulations.
- Trust and authenticity concerns.
- Regional payment and logistics fragmentation.
- Rising competition from platforms like TikTok Shop.
- Returns and fulfilment challenges hurt profitability.
Future Outlook for Instagram Shopping
- Instagram will deepen commerce through Reels, Stories, and video.
- Expect growth in mobile AR/VR shopping tools.
- Regionalized strategies will outperform generic ones.
- Attribution and measurement tools will gain importance.
- Creator collaborations will become longer-term.
- Growth will slow, but sophistication will rise.
- Personalization and mobile UX will drive success.
Frequently Asked Questions (FAQs)
46.8 million people in the U.S. are estimated to have made purchases on Instagram in 2024.
70% of Instagram’s 2 billion monthly users shop on the platform in some way.
Over 130 million users tap a product tag on Instagram each month.
Instagram ad revenue is projected to reach approximately $67.27 billion in 2025.
Instagram accounted for roughly 36.6% of U.S. social commerce buyers in 2024.
Conclusion
Instagram shopping has evolved from a novelty to a strategic commerce channel, bridging inspiration and transaction within a single app. From competing platforms and influencer ecosystems to region‑specific trends and mobile engagement, the statistical landscape underscores both opportunity and complexity. Brands that stay agile, mobile‑savvy, and focused on measurement will be best positioned to turn Instagram’s scrolls into sales. Dive into the full article to uncover the detailed numbers, insights, and strategic takeaways.