
The digital‑commerce landscape is not just large; it is essential. Businesses across sectors are leveraging online channels for everything from retail sales to lead generation and customer engagement. In one example, a mid‑sized retailer shifted 45% of its sales to its e‑commerce platform during the past year and saw online orders grow by 22%. In another, a services firm used a content‑marketing strategy and boosted web‑generated leads by 35%. These kinds of real‑world shifts illustrate the impact of the online business wave. Read on to explore the key statistics shaping the market today.
Editor’s Choice
- In 2025, global e‑commerce sales are projected at approximately $6.42 trillion.
- Online‑conducted businesses now account for about 29.9% of all business operations globally.
- Over 2.77 billion people are expected to shop online in 2025.
- The online share of total global retail sales is estimated at about 20.5% in 2025.
- Nearly 30.7 million e‑commerce sites were in operation globally in 2025.
- In the U.S., 32.9% of internet users aged 16+ discover new brands via search engines.
- More than 90% of U.S. and Chinese consumers say they shopped at an online‑only retailer in the last month.
Recent Developments
- Businesses are increasingly integrating AI features in online operations, with many citing improved efficiency and customer experience.
- The global number of businesses conducted online has increased nearly 40% over the last decade.
- Social commerce and live‑shopping models are gaining traction; for example, U.S. livestreaming e‑commerce sales reached $50 billion in 2023 and are projected to grow further.
- Return behaviour remains a concern; one report showed 92% of global shoppers in 2025 may return up to 30% of online purchases.
- The shift toward mobile‑first shopping continues, with mobile commerce estimated to represent 59% of total online retail sales in 2025.
- In 2025, many retailers will emphasize omnichannel experience, blending online and offline touchpoints to meet changing consumer expectations.
- The consumer sentiment vs. spend relationship has weakened, although sentiment is lower than in 2020, spending remains strong.
- Data security, privacy, and trust are now core focal points for online business growth strategies.
Global Online Business Overview
- Global retail e‑commerce sales are forecast at $6.42 trillion in 2025.
- That figure is expected to grow to $7.89 trillion by 2028.
- E‑commerce will comprise about 20.5% of total global retail in 2025.
- Major contributors, China, the U.S., and Western Europe, together account for over $5.17 trillion of global e‑commerce sales in 2025.
- More than 30.7 million e‑commerce websites operated globally in 2025.
- Online business conduct worldwide has jumped from about 21.5% (in 2015) to 29.9% in 2025.
- Globally, over 3 billion people will make an online purchase in 2025.
- Online spending as a share of global retail is trending toward almost a quarter of all retail by 2027.
E-commerce Market Size Forecast
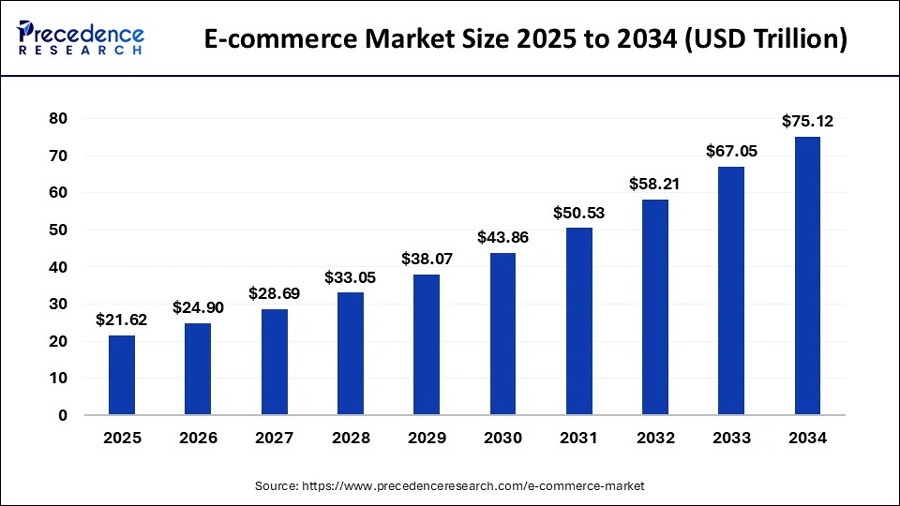
- The global e-commerce market is projected to grow steadily and significantly throughout the decade.
- Market size in 2025 is estimated at $21.62 trillion, marking the starting point of strong annual expansion.
- By 2026, the market is expected to reach $24.90 trillion, continuing a healthy upward trend.
- Growth accelerates through 2027 with a market value of $28.69 trillion.
- In 2028, e-commerce is projected to hit $33.05 trillion, surpassing the $30T mark.
- By 2029, the market will climb to $38.07 trillion, signaling increasing consumer digital adoption.
- 2030 projections show the market reaching $43.86 trillion, reflecting compounding global e-commerce penetration.
- In 2031, the industry crosses the $50 trillion milestone with an estimated $50.53 trillion valuation.
- 2032 continues the surge with a forecasted market size of $58.21 trillion.
- By 2033, projections indicate the market will grow to $67.05 trillion, driven by technological and logistical advancements.
- The decade concludes with 2034 reaching a massive $75.12 trillion, more than tripling its 2025 size.
- Overall, the data shows consistent double-digit growth, demonstrating e-commerce’s expanding dominance in global retail and digital trade.
Online Shopping Trends
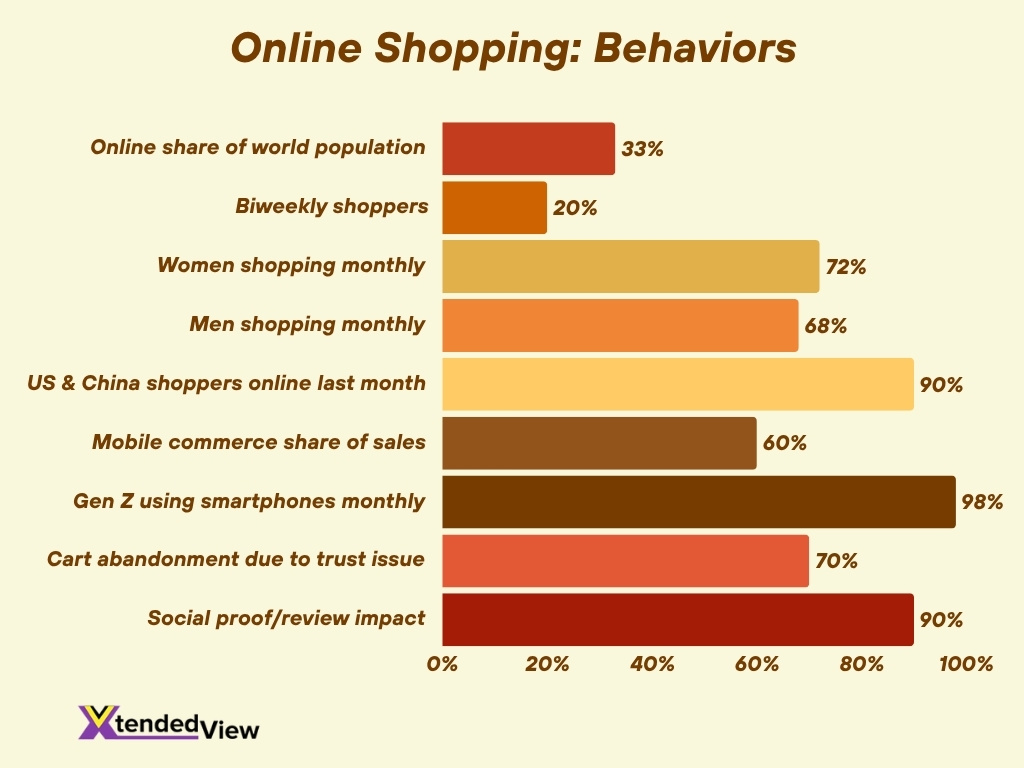
- 2.77 billion global online shoppers are expected by the end of 2025, accounting for over 33% of the world’s population.
- In the U.S., the online buyer base is projected to reach about 301.87 million by 2026.
- 20–24% of consumers buy online at least every two weeks, with 10% shopping biweekly.
- Women outpace men in activity: 72% of women vs. 68% of men shop online at least monthly.
- Over 90% of U.S. and Chinese shoppers purchased from an online-only retailer within the last month.
- Mobile commerce will contribute to over 60% of global online sales, worth about $2.51 trillion in 2025.
- 96% of Gen Z consumers use smartphones for online purchases at least monthly.
- Cart abandonment rises sharply if trust is lacking, with 70% of shoppers abandoning carts over doubt.
- Social proof and reviews impact more than 90% of shopping decisions online.
- Many shoppers trade down in categories like groceries due to rising inflation, while trading up for electronics and apparel.
Consumer Behavior Online
- Around 34% of online shoppers in the U.S. make purchases at least once a week.
- Free shipping ranks as a key decision factor for 17% of online shoppers across regions.
- 62% of Gen Z consumers considered a brand’s sustainability efforts when making an online purchase in 2024.
- In one survey, over 92% of U.S. online shoppers said security is a critical factor when buying online.
- Shoppers allocate more of their free time to online shopping. U.S. consumers report over three extra free hours weekly compared to 2019, with much of that time spent solo and online.
- Over 90% of Americans and Chinese said they used an online‑only retailer in the past month.
- The frequency of impulse buys and quick‑commerce orders has increased as consumers expect speed and convenience.
- Review and trust signals influence conversion rates; vague sustainability claims raise abandonment by about 41%.
Mobile Commerce Statistics
- In 2025, global mobile commerce (m‑commerce) is projected to account for 59% of all retail e‑commerce sales, representing about $4.01 trillion in value.
- Around 30% of the digital population (about 1.65 billion people) are shopping via mobile devices in 2025.
- In the U.S., approximately 76% of adults make purchases using a smartphone.
- Mobile payments app transaction volume is at $8.1 trillion globally in 2024, with growth continuing into 2025.
- The mobile commerce market in the U.S. alone is worth over $550 billion, with expectations of 50%+ growth over the next two years.
- Mobile commerce conversion rates have improved significantly, with increases of 30% over the past two years.
- Studies show that 73% of online shoppers prefer using mobile apps over mobile websites for purchases.
- By 2025, up to 75% of e‑commerce sales will be conducted via mobile devices.
- Mobile shopping revenue is expected to reach $710 billion by 2025 in certain markets.
- More than 78% of e‑commerce traffic may come from phones.
Online Payment and Transactions
- In 2025, mobile payment transaction volume will exceed $20.4 trillion globally, with an estimated $1.62 trillion via mobile payments.
- 91.5 million U.S. consumers used BNPL (Buy Now Pay Later) in 2025.
- Digital wallet users reached 5.6 billion worldwide, about two-thirds of the global population.
- 85% of U.S. consumers aged 18‑34 made at least one mobile payment in 2025.
- In emerging markets like India, UPI processed over $293 billion in May 2025 alone, while 99.8% of transactions are now digital.
- Mobile wallets and contactless methods are projected to account for 49–56% of global e‑commerce transaction value in 2025.
- Real‑time payment infrastructures grew at a CAGR of 46% in five years for volume globally.
- Global cross‑border digital wallet transactions are forecast to grow 45% in 2025.
- Security and fraud remain top concerns according to more than 70% of surveyed consumers.
- Cash payments in the U.S. declined to just ~7 per month per adult in 2025.
Lead Generation Online
- In 2025, 50% of marketers say lead generation is a top priority.
- Organizations generate, on average, 1,877 leads per month, though many fail to convert.
- The average cost per lead (CPL) across industries is approximately $198.44.
- Around 59% of leads are still in the consideration phase when first captured.
- Lead‑generation market size is estimated at $15 billion in 2025 with a projected CAGR of ~12%.
- Average cost per lead via Google Ads increased to $70.11.
- 76% of marketers use content to generate leads, 68% say social media helped generate more leads.
- 44% of sales representatives report they are too busy to follow up on all the leads.
- Emerging tactics such as zero‑click capture, conversational bots, and AI‑powered lead‑scoring are gaining attention.
Content Marketing Statistics
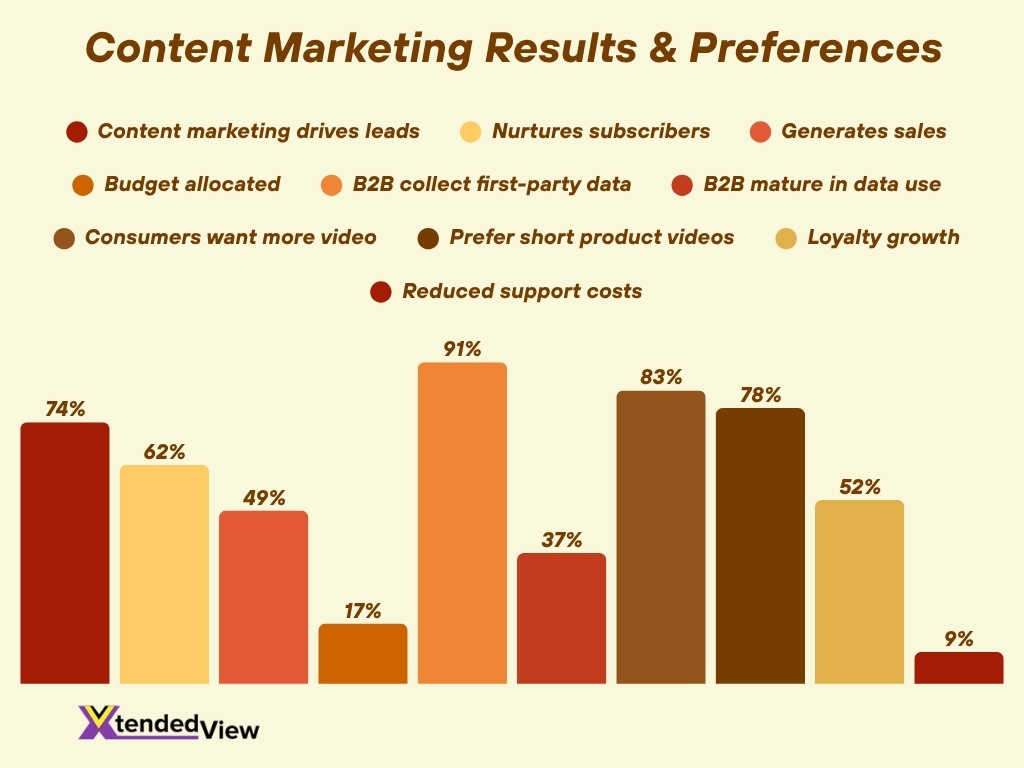
- 74% of marketers say content marketing helped generate demand or leads, 62% say it nurtured subscribers/leads, and 49% say it helped generate sales or revenue.
- Marketers allocate roughly 17% of their budget to content marketing.
- 91% of B2B marketers collect first‑party data for strategy; only 37% say they have maturity in using it.
- More than 50 unique content‑marketing statistics apply in 2025.
- 83% of consumers say they want more video content from brands.
- 78% of consumers prefer short videos to learn about products.
- 52% of marketers say content marketing grew loyalty with customers.
- 9% say content marketing reduced customer‑support costs.
- Podcasts, interactive content, and AI‑curated narratives are growing in share.
Video Marketing Statistics
- By 2025, video content accounts for 82% of all internet traffic.
- 78% of people watch videos weekly, 55% engage with video daily.
- Global spend on short‑form digital video advertising will reach $111 billion in 2025.
- Only 5% of companies plan to cut video marketing budgets in 2025.
- 73% of video marketers create explainer videos.
- Live‑action video (54%) is more used than animated (24%) or screen‑recorded (15%).
- YouTube, TikTok, and Instagram are major video platforms, with ~238 million U.S. YouTube viewers in 2024.
Social Media Usage for Business
- In 2025, global social‑media users totaled approximately 5.66 billion.
- Social media ad spend is projected at $276.7 billion in 2025.
- 96% of small businesses use social media for marketing.
- Users average 2 hours 13 minutes daily on social media.
- 65.7% of the global population is active on social media, and average users visit ~6.84 platforms monthly.
- In the U.S., 61.1% of social time is spent watching videos.
- From 2019 to 2024, U.S. social‑media ad spending rose by 140%.
- Social media ads now account for about 3 in every 10 dollars spent on digital advertising.
Email Marketing Statistics
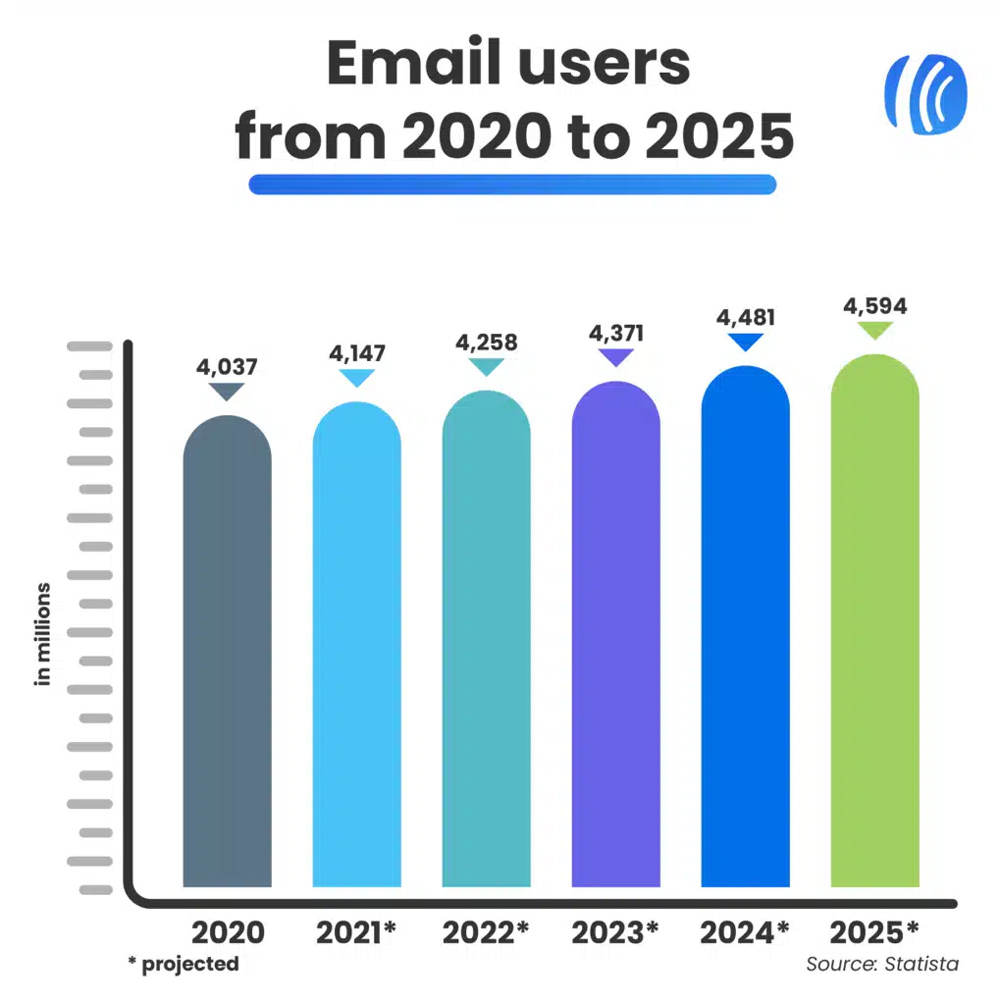
- The number of email users worldwide shows a steady increase from 2020 to 2025, highlighting email’s continued relevance in digital communication.
- In 2020, there were approximately 4.037 billion email users.
- By 2021, the user base had grown to about 4.147 billion.
- 2022 (projected) saw an increase to 4.258 billion email users globally.
- The number continued rising in 2023 (projected) to 4.371 billion.
- In 2024, the figure is projected to reach 4.481 billion, reflecting strong upward momentum.
- By 2025, email usage is expected to hit 4.594 billion, adding more than half a billion users compared to 2020.
- The data demonstrates a consistent annual growth trend, reinforcing email as a dominant communication channel.
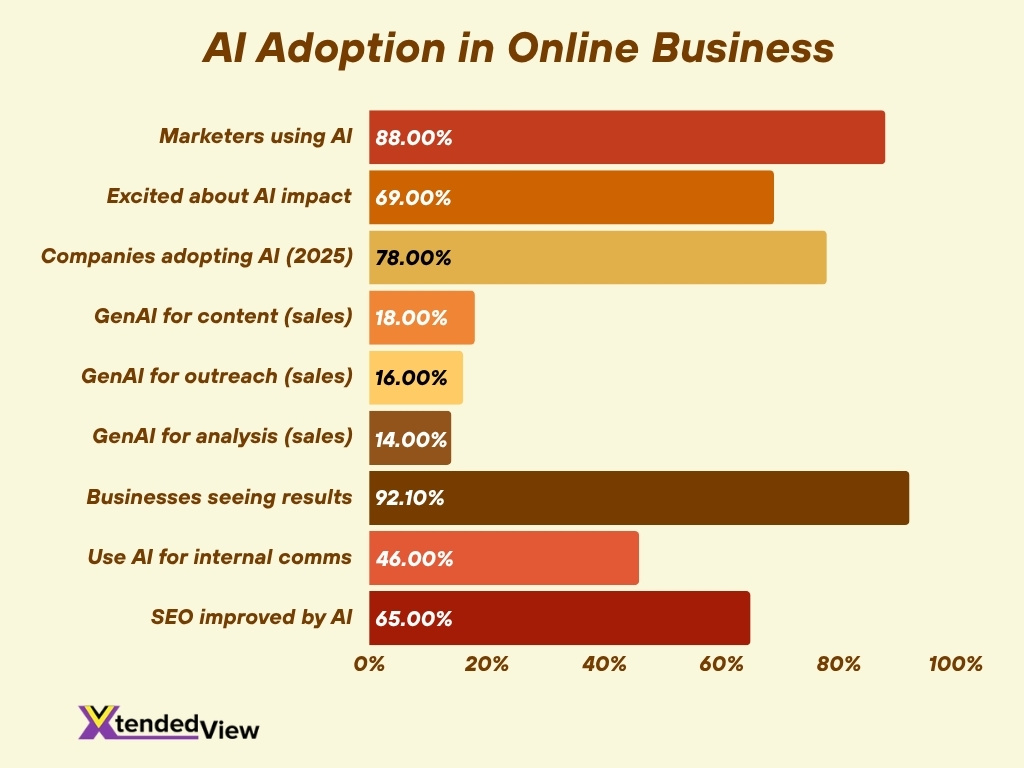
AI in Online Business
- Approximately 72% of companies globally use AI in at least one business function.
- The global AI‑marketing market is valued at roughly $47.32 billion in 2025, with a projected CAGR of ~36.6% through 2028.
- The AI‑enabled e‑commerce market is estimated at $8.65 billion in 2025.
- 88% of marketers report using AI in their job roles, and 69% express excitement about its impact.
- About 78% of companies will have adopted AI technologies by 2025.
- Among sales professionals, 18% use generative AI for content creation, 16% for prospect outreach, and 14% for data‑analysis tasks.
- 92.1% of businesses that deployed AI saw measurable results in productivity and efficiency.
- 46% of business owners use AI for internal communications.
- 65% of AI users in marketing reported improved SEO results.
Online Business Revenue & Profits
- Global e‑commerce sales are projected to reach $6.86 trillion in 2025.
- U.S. online sales will make up about 16–20% of total retail sales in 2025.
- Mobile e‑commerce sales are expected to total $2.51 trillion in 2025.
- Roughly 29.9% of all businesses globally are now online-based.
- Social commerce will reach about $1.2 trillion worldwide in 2025.
- Amazon is projected to earn approximately $670 billion in revenue in 2025.
- The U.S. e-commerce market is forecast to hit $1.29 trillion by end-2025.
- Online sales will grow by 8–9% year-over-year globally in 2025.
- Tablet conversion rates outpace desktops in e-commerce at 3.1% vs 2.8%.
- Some leading platforms forecast e-commerce profits rising over $435 million in FY 2025, up from $38 million in 2024.
Conversion Rates and Abandonment
- The average online‑store conversion rate in 2025 is around 3.13%, with industry ranges between 2% to 4%.
- On desktop, conversions average about 4.8%, while mobile conversions are around 2.9%.
- The average cart abandonment rate is approximately 70.22% in 2025.
- Fashion & Apparel abandonment rates are around 84.4%, Electronics 71.8%, and Luxury & Jewelry 81.4%.
- About $18 billion is lost annually due to abandoned carts in e‑commerce.
- Mobile traffic dominates visits, but conversion rates lag desktop due to UX challenges.
- Email remarketing continues to show a significant lift when combined with optimized UX and faster checkouts.
- Higher personalization and better checkout flows correlate with significantly higher conversion rates.
Online Reviews and Trust
- 99% of shoppers read reviews before purchase; reviews influence 93% of buying decisions.
- 88% trust online reviews as much as personal recommendations from friends or family.
- 49% of consumers trust online reviews overall; 30% of reviews are fake.
- Millennials find user‑generated content 50% more trustworthy than other media, while 35% of Gen Z say UGC will be even more credible soon.
- 77% of users don’t trust reviews older than three months.
- 70% of consumers require at least four reviews before trusting a business.
- Businesses with positive reviews gain trust from 75% of consumers, while 15% don’t trust brands without reviews.
- 81% check Google reviews before visiting a business.
- Website visitors interacting with UGC see 100.6% higher conversion rates.
- 71% read online reviews regularly for local businesses; 42% trust reviews as much as personal recommendations.
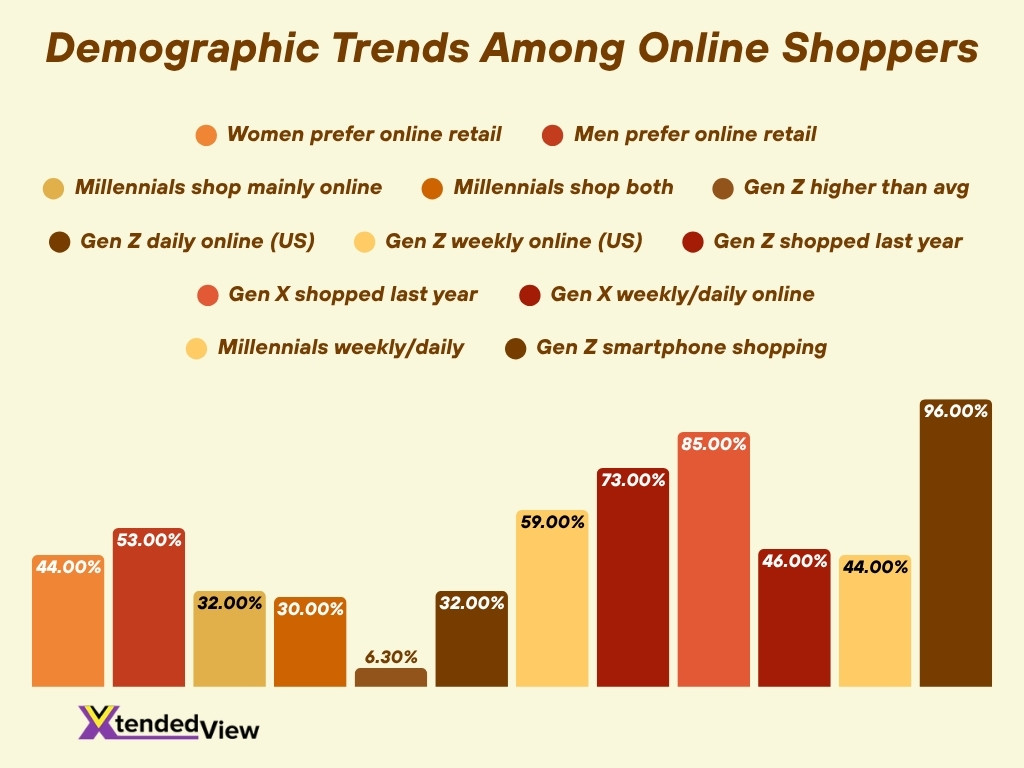
Demographics of Online Shoppers
- 44% of female shoppers and 53% of males in the U.S. prefer browsing retail online over in-store.
- 32% of Millennials primarily shop online, while 30% shop both online and in-store equally.
- Gen Z consumers are 6.3% more likely than average to make frequent online purchases.
- Over 32% of Gen Z shop online daily in the U.S.
- 59% of U.S. Gen Z adults shop online at least once per week.
- 73% of Gen Z shopped online in the past 12 months.
- 85% of Gen X shopped online in the last 12 months, with 46% shopping online weekly or daily.
- 44% of Millennials shop online weekly or daily.
- 96% of Gen Z use smartphones to make online purchases at least once monthly in 2023.
- The U.S. has 270 million online consumers, with urban shoppers consistently outspending rural ones.
Future Trends in Online Business
- The global e‑commerce market is projected to reach around $7.89 trillion by 2028.
- 59% of online retail sales in 2025 will be made through mobile devices.
- Social commerce will exceed $1.2 trillion globally by year‑end 2025.
- AI‑driven recommendations and conversational commerce will be mainstream by 2027.
- Subscription and cross‑border models will gain greater adoption for sustained profitability.
- Sustainability, ethical sourcing, and transparency will drive consumer loyalty over the next 3–5 years.
- Emerging regions like Southeast Asia, India, and Africa will power the next wave of online business expansion.
Frequently Asked Questions (FAQs)
The global e‑commerce market is projected to reach approximately US$6.42 trillion in 2025.
Online commerce is expected to account for about 20.5% of total global retail sales in 2025.
Approximately 29.9% of all businesses are conducted online in 2025.
There are an estimated 2.77 billion global online shoppers in 2025.
The global e‑commerce market is projected to grow at a CAGR of about 18.9% from 2024 to 2030.
Conclusion
The landscape of online business is expansive and fast‑moving. From email marketing delivering exceptional ROI to AI becoming central in business operations, from conversion‑rate challenges to trust and review dynamics, and evolving shopper demographics, these statistics reveal both opportunity and complexity.
For businesses willing to adapt their strategies by optimizing mobile experiences, leveraging personalization, and building trust, the potential remains substantial. The next wave will favor those who combine data‑driven action with customer‑centric execution.