
Instagram remains a cornerstone of digital marketing strategies, bridging visual storytelling with commerce and community. Its impact is tangible; retail brands are using Instagram Shopping to convert browsers into purchases, and media companies are relying on Reels for rapid audience growth. In both consumer‑goods and publishing industries, Instagram’s features have shifted from “nice to have” to business‑critical. Explore the latest statistics below to see how marketers are adapting to this evolving platform.
Editor’s Choice
- Over 1.74 billion users are reachable via Instagram ads as of January 2025.
- Instagram’s worldwide monthly active user base is estimated at 2.11 billion in 2025.
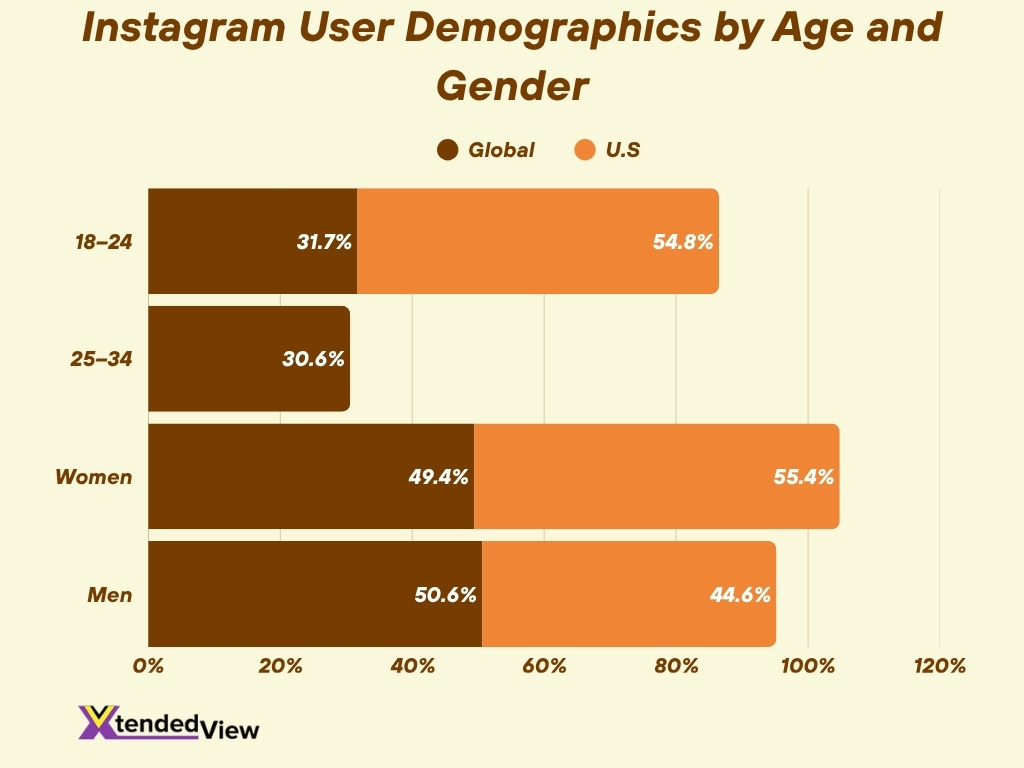
- The 18–24 age group represents about 31.7% of global users.
- Engagement rate across content types dropped by roughly 28% year‑on‑year in early 2025.
- Instagram’s ad revenue is projected to hit $67.27 billion in 2025.
- Approximately 70% of Instagram users are under the age of 34.
- Instagram receives an estimated 140 billion+ daily views on Reels globally.
Recent Developments
- In 2025, Instagram introduced several creator‑friendly features, such as the new “Reposts” tab, which allows sharing other users’ content while crediting the originals.
- Instagram expanded the maximum duration for Reels to 20 minutes, enabling deeper storytelling.
- A dedicated native iPadOS app was launched, improving the experience for tablets and creators working on larger screens.
- Instagram added “Friends Map” in DMs, showing location‑tagged posts or friend check‑ins with opt‑in privacy controls.
- The “Your Algorithm” test was rolled out in certain regions, offering users more control over the content they see within Reels.
- New metrics for creators and brands, like “Skip Rate” for Reels and “Retention” time, started appearing in Insights dashboards.
- Instagram updated Teen Account settings, users under 16 now need parental approval to go Live or disable blurred images in DMs.
- AI‑powered tools within the “Edits” app were enhanced, such as teleprompter features and green‑screen cutouts, aimed at simplifying video creation.
Instagram User Demographics Statistics
- Globally, users aged 18–24 account for about 31.7% of Instagram’s user base.
- Users aged 25–34 account for approximately 30.6% worldwide.
- In the U.S., women represent about 55.4% and men about 44.6% of Instagram’s user base.
- Worldwide gender split, approximately 50.6% male, 49.4% female.
- In the U.S., around 54.8% of users are aged 18–34, reflecting a younger skew.
- Nearly 80.3% of Instagram users also use Facebook, and 77.1% also use WhatsApp.
- In the largest non‑US market, India has around 472.6 million Instagram users as of 2025, followed by the U.S. with 179.9 million.
- Approximately 62.3% of global users ages 18–34 account for the platform’s total audience.
Instagram Growth Trends
- Instagram’s reachable ad audience was 1.74 billion users in Jan 2025.
- From 2024 to 2025, Instagram’s active user growth rate in certain regions was around 3.47% YoY.
- In a 2025 study, around 25%+ year‑on‑year growth in audience was reported for some markets in 2024.
- Globally, over 90% of Instagram’s reachable ad audience is outside the U.S. in 2025.
- Instagram’s global market share of social platforms is about 9.78% as of 2025.
- Approximately 70% of Instagram users are under the age of 34, signaling strong youth growth momentum.
- The platform continues to grow in emerging markets, particularly India, Brazil, and Indonesia, where new user adoption remains high.
- Instagram Stories and Reels adoption remains key expansion drivers; for instance, many users report using the app primarily for sharing visual content.
Overview of Instagram Usage Statistics
- On average, users post approximately 15 times per month on Instagram based on a 2024 data sample.
- The average video watch time on Instagram was about 8 seconds in early 2025.
- As of a 2025 benchmark, typical engagement rates are Carousels 0.55%, Reels 0.50%, and Sand static Images 0.45%.
- Posts including mentions of other accounts appear in only 16% of brand content.
- About 9% of posts include caption links, indicating that direct outbound linking remains limited.
- In 2025, Instagram posts categorized as “video content” reached nearly 49% more audience than photos or carousels.
- Carousels remain the highest‑engagement format at 0.55% but saw a 15% decline year‑on‑year.
- A study noted that about 48% of content is photos, 34% is video, and 18% is carousels in 2024/25 posting practices.
Audience Demographics
- The 18‑24 age group accounts for 31.7% of global users.
- Users aged 25‑34 make up about 30.6% worldwide.
- Around 70% of users are under the age of 34.
- Approximately 60% of Instagram users are under 35.
- Males comprise roughly 48.6% of users, females around 51.4%.
- India ranks as the largest non‑U.S. market, followed by the U.S. and Brazil.
- Users aged 35‑44 represent about 16.4% of the total user base.
- Users aged 65 and older account for approximately 3% globally.
Instagram Engagement Statistics
- As of the first half of 2025, the average engagement rate across accounts on Instagram has fallen to 0.45%, down approximately 24.1% year‑on‑year.
- For smaller accounts (under 5,000 followers), Reels achieve a 20% rate on average.
- Carousels generate the highest number of saves among post types for mid‑sized and large pages.
- Engagement rate for Reels averages 5.53%, though this figure may refer to specific account‑size subsets.
- In 2025, it is estimated that 69% of social media users say they see the most engaging brand content on Instagram.
- Among marketers surveyed, 79% consider Instagram an important channel for influencer campaigns.
- Posts with more than one image (carousels) can generate up to 2.14× more interactions than single‑image posts.
- Smaller creator accounts are often favoured by algorithmic reach, giving them a higher-than-average engagement rate relative to size.
Frequency of Posts on Instagram
- Nano accounts (≤10,000 followers) post about 2 feed posts per week, micro accounts (≤100,000 followers) about 3 posts per week, and mid‑sized accounts (≤500,000) about 5 posts weekly.
- For Stories, nano accounts post approximately 3 times per week, micro accounts 4 times per week, and mid accounts 15 Stories per week.
- Posting 3‑5 feed posts per week yields significantly better growth than posting 1‑2 times.
- Posting 6‑9 times per week in the feed can yield 3.7× the follower growth rate compared to posting 1‑2 times weekly.
- Posting 10+ times per week can lead to 5.5× follower growth vs. 1‑2 times per week.
- Posting frequency correlates with reach; more posts per week almost always lead to higher weekly reach for the account.
- Accounts that do not post at all for a week typically experience follower growth below their normal baseline.
- Accounts with 1–5k followers post 12 Stories/month, 10–50k followers 35/month (1 per day), and 100k–1M followers 80/month (3 per day).
Instagram Stories Statistics
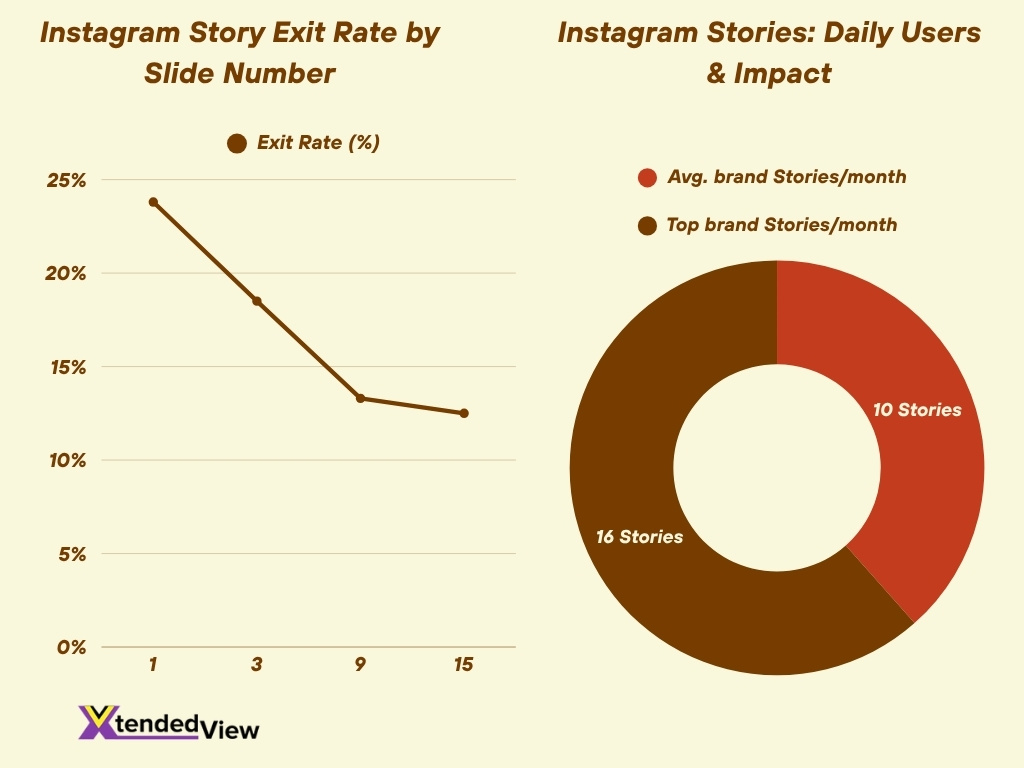
- The exit rate for Stories on Instagram in 2025 begins at 23.8% on the first slide, drops to 18.5% by slide 3, then stabilises around 13.3% by slide 9.
- By slide 15, the exit rate is around 12.5%, indicating that viewers who stay past early frames are likely to continue.
- More than 500 million accounts are reported to use Instagram Stories daily.
- Up to 62% of Instagram users become more interested in a brand after seeing it featured in a Story.
- Stories had one of the highest reach growth rates year‑on‑year (+35%) for smaller accounts.
- On average, brands will publish approximately 10 Stories per month; top quartile brands often publish 16+ per month.
- Story reach tends to decline the longer the sequence, for example, viewers drop off more rapidly from slides 1–3 than from 4–9.
- Story metrics such as link taps, profile visits, and sticker interactions now play a larger role in assessing performance than pure view counts.
Reels Statistics
- More than 2 billion users engage with Reels every month in 2025.
- Over 200 billion Reels are viewed daily across Instagram and Facebook.
- Reels generate about 22% more interaction than standard video posts.
- Reels make up 38.5% of all content in the Instagram feed in 2025.
- The average engagement rate for a Reel is around 5.53%.
- Smaller accounts (≤ 2,000 followers) average 1,200 views per Reel.
- Reels have the highest reach rate (37.87%) among Instagram content types.
- Carousels continue to outperform Reels in some engagement metrics, despite Reels’ growth.
Video Marketing Statistics
- Shoppable video ads on Instagram deliver 47% higher purchase rates than non‑shoppable ones.
- About 76% of marketers consider Instagram video content to have the highest ROI.
- Short‑form video is the top format for 17% of marketers in 2025.
- AI‑driven video features (e.g., auto captions) are leveraged by 18% of businesses.
- 91% of Instagram users watch video content weekly.
- Video content posted as Reels tends to receive twice the average impressions of other formats.
- Over 1 million people watch Instagram Live videos daily.
- Videos recommended to non‑followers using an AI account for 50% of exposure.
Instagram Advertising Statistics
- Instagram’s global ad reach is now over 1.7 billion users.
- Ad revenue is projected to hit around $70 billion in 2025.
- Instagram will generate more than 50% of its parent company’s U.S. ad revenue in 2025.
- Estimated CPM on Instagram is about $9‑10 in Q2 2025.
- Cost‑per‑click (CPC) for many advertisers ranges between $ 0.40‑1.50+.
- Around 96.6% of active users are reachable via Instagram ads each month.
- Reels ads reach about 726.8 million users, roughly 55.1% of Instagram’s ad audience.
- Story‑format ads account for over 70% of Instagram’s total advertising reach.
Key Statistics for Instagram Hashtags
- Posts with at least one hashtag receive about 12.6% more engagement than those without.
- Using 9‑11 hashtags can boost reach by nearly 79.5% for smaller accounts (< 1,000 followers).
- Hashtags between 21 and 24 characters tend to perform 20% better than shorter ones.
- More than 60% of users say they discover new accounts through hashtags in 2025.
- In 2025, brand hashtags account for about 70% of all hashtags used on Instagram.
- Using 3‑5 highly relevant hashtags is often best practice.
- Placing hashtags in the caption boosts reach by 36% for accounts with fewer than 5,000 followers.
- Posts without hashtags, in some cases, reached 23% more people than posts heavily packed with hashtags.
- Hashtags remain relevant for search/discovery, but the algorithm no longer treats them as the primary driver of reach.
Instagram Shopping & Ecommerce Statistics
- Approximately 70% of users on Instagram shop or browse products on the platform in 2025.
- Around 54% of users have bought a product after seeing it on Instagram.
- Over 130 million users tap on product tags each month.
- In the U.S., the share of Instagram users expected to make purchases via the app in 2025 is 37.3%.
- The average conversion rate in 2025 is estimated between 2% – 4%.
- Instagram‑driven website traffic rose by 290%, and the conversion rate doubled from 1.6% to 3.3%.
- Clothing/apparel accounts for 46.5% of Instagram‑shoppers’ monthly purchases, beauty and food/beverage each at 28 %.
- Ad revenue for Instagram is projected at $67.27 billion in 2025.
- Product‑tagged feed ads deliver approximately 38% higher checkout rate than feed ads without shopping features.
Business Profiles / Brand Statistics
- There are over 200 million business profiles active on Instagram worldwide.
- The average Instagram business account posts about once per day.
- 57.1% of marketers prefer Instagram for influencer partnerships in 2025.
- For influencer campaigns on Instagram, brands earn, on average,e about $4.12 for every $1 spent.
- 72% of Gen Z prefer using Instagram for customer‑care interactions.
- Influencers generate approximately 3× more likes and comments than brand‑operated accounts.
- The average cost‑per‑click (CPC) for Instagram ads is about $1.23.
- Instagram ads now reach 96.6% of active users each month.
Influencer Marketing Performance on Instagram
- The global influencer‑marketing industry is expected to reach $32.55 billion in 2025.
- 46.7% of marketers use Instagram for influencer marketing campaigns.
- 87% of influencers use Instagram to collaborate with brands.
- 69% of consumers say they trust influencer recommendations over traditional brand advertising.
- About 40.1% of Instagram shoppers in the U.S. spend more than $200/year.
- “Nano‑influencers” continue showing higher conversion rates (1.3%) than larger accounts.
- Fashion is the top search category on Instagram at 12% of users, hair/makeup 11%, and interior design 10%.
Instagram Content Type Statistics
- Influencer accounts publish “Reels” 12% more in 2024/2025 than in the prior year.
- Posting 2‑3 times weekly correlates with 19% follower growth; posting 10+ times per week correlates with 79% growth.
- About 93.5% of Instagram accounts publish at most once per week or less, and tend to see an average follower loss of 2% per year.
- Reels are now cited as a primary driver of reach and engagement on Instagram.
- User‑generated content yields a 4.5% higher conversion rate than other content types.
- Influencer accounts posting Reels more frequently see greater engagement than static images.
- For business accounts, posting “how‑to” Reels and product‑tagged shopping content is steadily outperforming traditional feed imagery.
ROI & Conversion Rates
- Instagram‑driven traffic to a website increased by 290%, and the conversion rate doubled from 1.6% to 3.3%.
- The average global e‑commerce conversion rate in 2025 ranges between 2% to 4%.
- Retailers report an average engagement rate of 1.16%, higher than many other platforms.
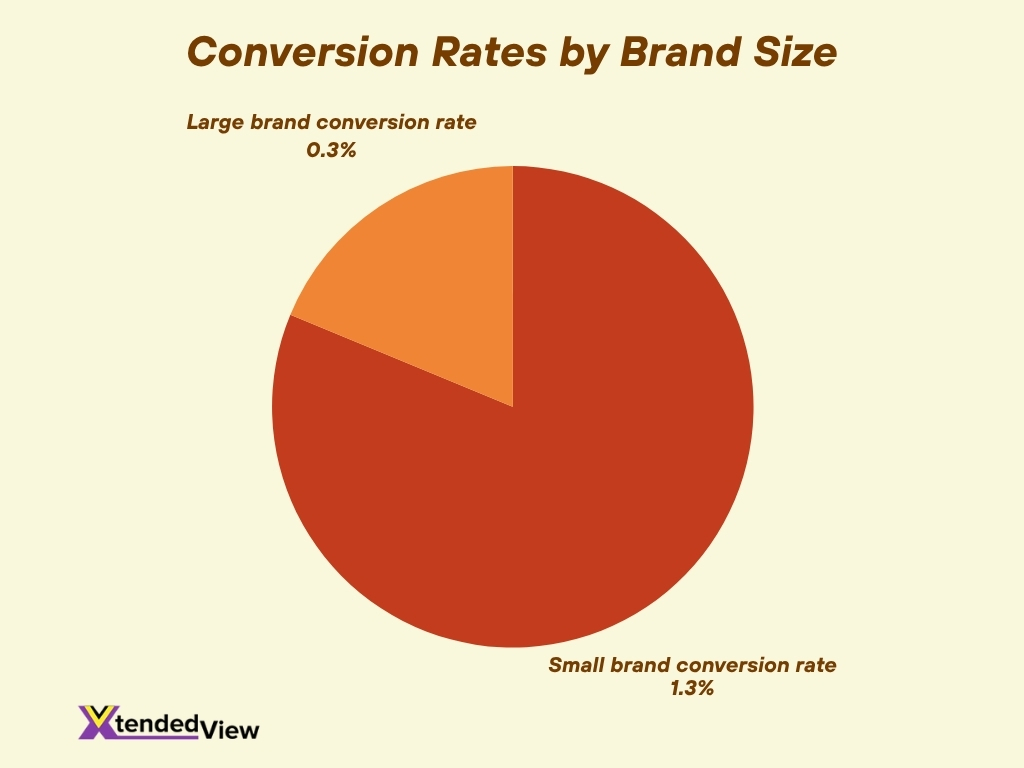
- Brands with smaller followings (< 10k) report conversion rates around 1.3%, higher than larger accounts (0.3%).
- Instagram ad reach now covers 96.6% of active users monthly.
- Average cost‑per‑click (CPC) is $1.23.
- 40.1% of Instagram shoppers in the U.S. spend more than $200 per year.
- Product‑tagged feed ads delivered 38% higher checkout rate than non‑tagged ads.
Comparison of Instagram with Other Social Platforms
- About 29% of users make purchases via Instagram, making it the third‑most used social platform for direct purchases.
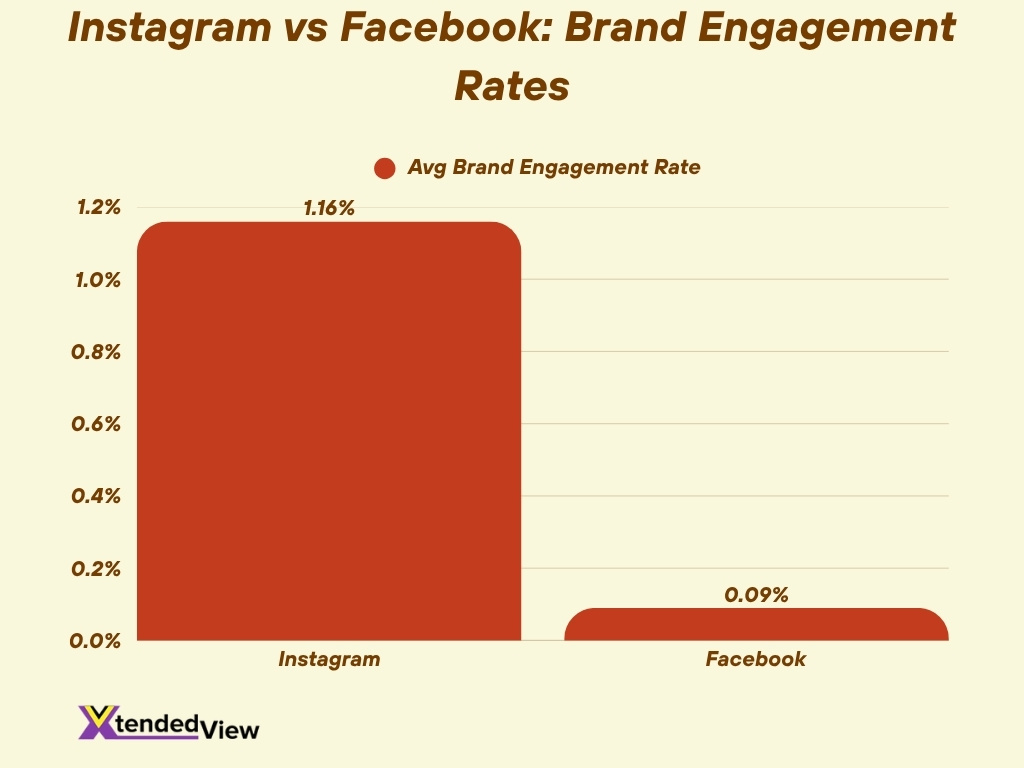
- Instagram leads retail brand engagement with 1.16% average engagement rate, compared to Facebook’s 0.09%.
- Users aged 15‑17, 72% use Instagram in the U.S.
- Instagram is often used as a search tool, with 36% of users employing it for discovery.
- Ad revenue for Instagram is expected to reach $67.27 billion in 2025 and account for 40%+ of Meta’s total revenue.
- Instagram is more trusted than some newer platforms for brand content and influencer campaigns.
- For younger demographics and mobile users, Instagram outperforms older networks like Facebook or Twitter.
Frequently Asked Questions (FAQs)
Instagram ads can reach around 1.74 billion users globally.
Instagram’s ad revenue is projected at approximately $67.27 billion in 2025.
In 2024, the Feed generated 53.7% and Stories 24.6% of Instagram’s total ad revenue.
About 70% of Instagram users are under the age of 34.
User‑generated content on Instagram yields brands a 4.5% higher conversion rate than other content types.
Conclusion
Instagram continues to evolve into a full‑funnel marketing platform, not just a place for sharing photos. From hashtag strategies and shopping‑enabled posts to influencer campaigns, business‑profile tactics, and ROI benchmarks, marketers now have a rich data set to guide decisions. Whether you’re a small brand testing product tagging or an enterprise optimising ad spend, these statistics provide actionable insights.