
The cloud computing market is undergoing rapid expansion, and the Google Cloud ecosystem is at the heart of that change. From powering large enterprises’ AI workloads to supporting small‑to‑medium businesses in migration and modernization, Google Cloud’s reach is both broad and deep. For example, a global financial services firm may deploy Google Cloud services to run real‑time analytics in a multi‑cloud environment, while an online retail company may rely on its ML tools for personalized recommendations. In the sections that follow, you’ll explore key statistics and comparisons that reveal how Google Cloud is evolving and what it means for the industry.
Editor’s Choice
Here are seven standout statistics summarizing Google Cloud’s current position:
- Google Cloud holds about 12% of the global cloud infrastructure market in Q1 2025.
- In Q2 2025, Google Cloud’s market share rose to 13%, marking a record for the provider.
- Google Cloud’s revenue in Q2 2025 reached US $13.6 billion, up approximately 32% year‑over‑year.
- The annual revenue run‑rate for Google Cloud has surpassed $50 billion.
- The number of large deals (valued > $250 million) for Google Cloud more than doubled year‑over‑year in the first half of 2025.
- Google Cloud’s backlog of contracted business reached $106 billion by the end of Q2 2025.
- Global enterprise spending on cloud infrastructure services reached roughly $99 billion in Q2 2025.
Recent Developments
- Google Cloud doubled the number of large‑scale deals (over $250 million) in H1 2025 compared with H1 2024.
- New deals worth $1 billion+ were signed in the first half of 2025 for the same number of deals as the entire 2024 period.
- Google Cloud’s customer base grew nearly 30% from Q1 to Q2 of 2025, according to the chief executives.
- Alphabet (parent of Google Cloud) increased capital expenditure (CapEx) plans for 2025 to approximately US $85 billion to support cloud infrastructure expansion.
- The backlog of business for Google Cloud grew by 38% year‑over‑year and by 18% sequentially in Q2 2025 to reach US $106 billion.
- Google Cloud unveiled new multi‑region backup vaults (supporting persistent disk and hyperdisk backups) and made a major AI model (DeepSeek R1, 671 billion parameters) available on Vertex AI.
- In early 2025, Google Cloud launched new regions, including one in Johannesburg (Africa) and made announcements about sovereign cloud services in Malaysia and Thailand.
- Partnerships, Google Cloud struck cloud computing deals (including one reportedly over US $10 billion with Meta Platforms) to provide infrastructure for AI workloads.
- Google Cloud’s Q2 results raised its operating income to US $2.8 billion, up from under US $1.2 billion the year before.
Key Facts About Google Cloud Platform
- Google Cloud Platform (GCP) is the public cloud infrastructure and services offering of Google under the Google Cloud brand.
- Although Google Cloud is the broader division, much of the statistics reported (revenue, backlog, growth) reflect GCP offerings.
- By Q1 2025, GCP accounted for approximately 13.6% of Alphabet’s overall business and about 7.1% of its operating income.
- Customer footprint. According to a 2025 report, GCP had around 497,199 customers in North America (about 51.8% of its total), 272,256 in the EMEA region (28.4%), 141,555 in APAC, and 48,319 in LATAM.
- Google Cloud emphasises its strength in AI, big data analytics, and machine learning services, areas where GCP is positioned as a leader.
- GCP supports a broad range of services (IaaS, PaaS, SaaS), including storage, compute, analytics, ML/AI tools, and Developer/DevOps tools.
- The platform is also used internally by Google for many of its own services (e.g., Search, Gmail, Maps), providing significant scale and global infrastructure.
- GCP’s growth is partly driven by enterprises shifting from legacy to cloud‑native architectures and adding generative AI workloads, where Google plays on the strengths of its TPU (Tensor Processing Unit) hardware.
Google Cloud Platform Revenue Statistics
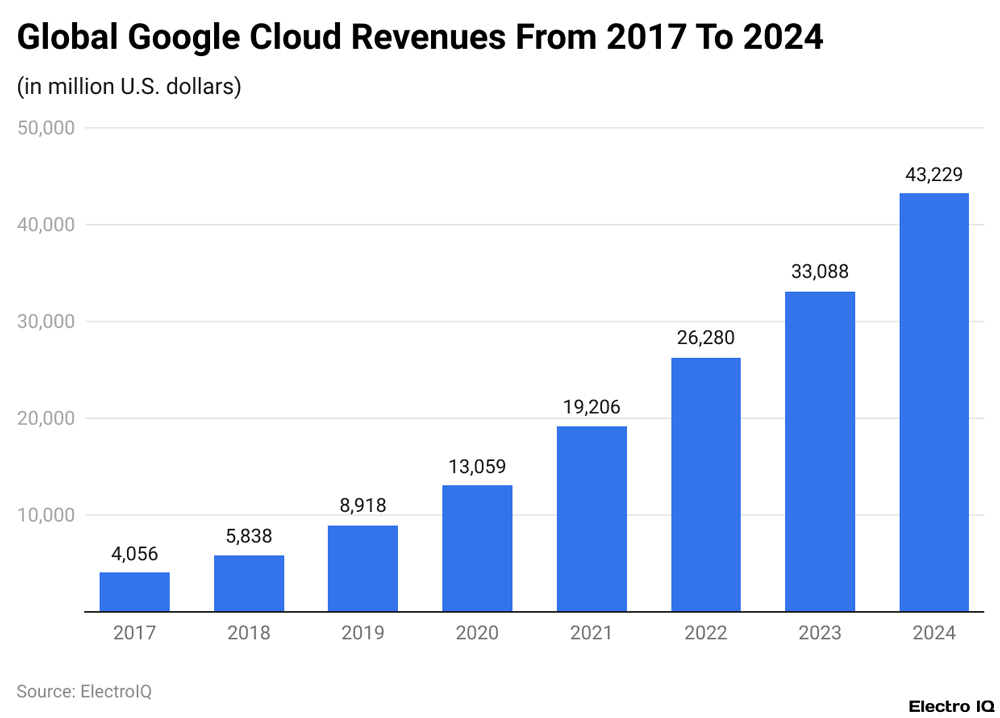
- Google Cloud revenue grew more than tenfold from $4.06B in 2017 to $43.23B in 2024.
- Year-over-year growth has been consistent, averaging 38% annual increase across the period.
- Major revenue jumps:
- 2019 → 2020: from $8.92B to $13.06B (+46%)
- 2020 → 2021: to $19.21B (+47%)
- 2023 → 2024: from $33.09B to $43.23B (+31%)
- Revenue doubled between 2020 ($13.06B) and 2022 ($26.28B) in just two years.
- Strong acceleration post-2020, highlighting Google Cloud’s expansion in enterprise services, AI infrastructure, and digital transformation demand.
- 2024 marks the highest revenue peak at $43.23B, emphasizing Google Cloud’s growing market competitiveness.
Market Share of Leading Cloud Service Providers
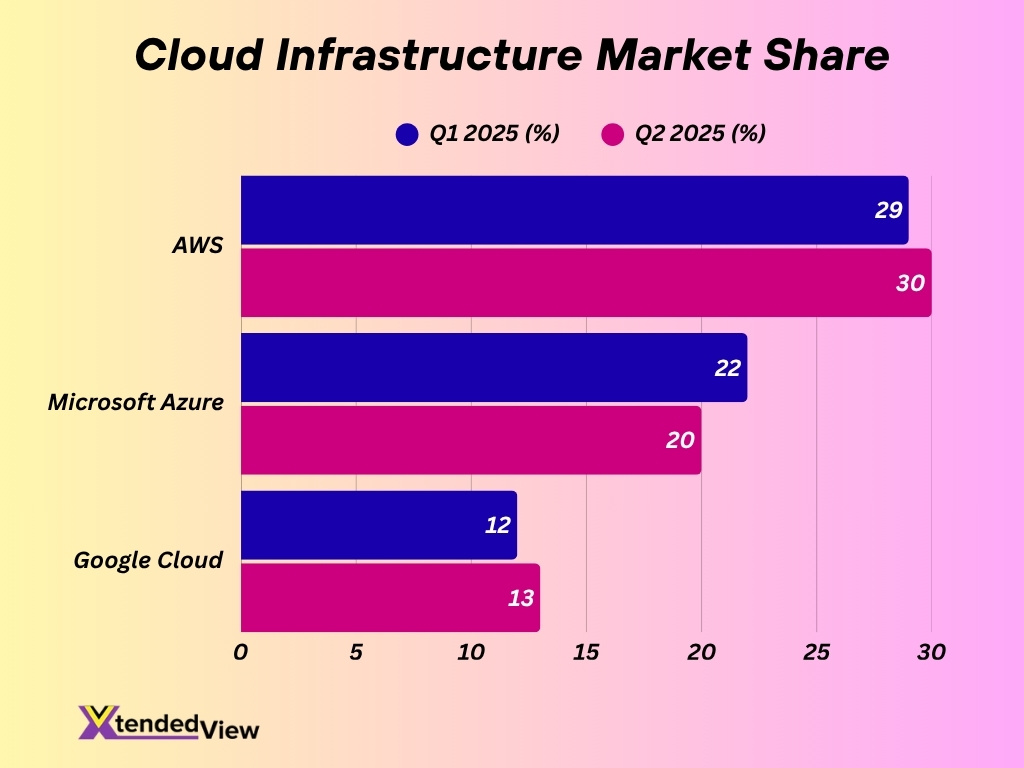
- In Q1 2025, the three largest providers, Amazon Web Services (AWS), Microsoft Azure, and Google Cloud, together controlled approximately 63% of the global cloud infrastructure market.
- The market share breakdown in Q1 2025 is AWS 29%, Azure 22%, and Google Cloud 12%.
- By Q2 2025, the shares shifted: AWS 30%, Microsoft 20%, Google Cloud 13%.
- Even as AWS retains the largest share, Google Cloud’s share is growing, reflecting accelerating momentum in the market.
- The overall global enterprise spending on cloud infrastructure services was estimated at $94 billion in Q1 2025.
- In Q2 2025, it rose to roughly US $99 billion, representing a growth of over US $20 billion year‑over‑year.
- Analysts expect the average annual growth of cloud infrastructure services to remain above 20% over the next five years.
- Some sources estimate AWS may have dipped slightly in share from 32% in 2024 to about 30% in Q2 2025, while Google Cloud picked up ground.
Comparison: Google Cloud vs AWS vs Azure Market Share
- For Q1 2025, AWS 29%, Azure 22%, Google Cloud 12%.
- For Q2 2025, AWS 30%, Microsoft Azure 20%, Google Cloud 13%.
- Year‑over‑year growth of Google Cloud (32%) in Q2 2025 outpaced AWS (17%) and Azure (26%).
- Although AWS remains dominant in scale, Google Cloud is narrowing the gap by focusing on enterprise AI workloads and large deals.
- Azure’s share appears to have dipped somewhat in Q2 2025 (from 22% in Q1 to 20%).
- Google Cloud’s third‑place position is strengthening thanks to its growing backlog, large contracts, and differentiated services in data & AI.
- Enterprises using multi‑cloud strategies increasingly include Google Cloud in their mix, which supports the share growth trend.
- The “big three” cloud providers (AWS, Azure, Google Cloud) account for nearly two‑thirds of the infrastructure market, leaving a fragmented rest for smaller players.
Google Cloud Platform Global Customers
- In 2025, Google Cloud had around 497,199 customers in North America, about 51.8 % of its total customer base.
- In the EMEA region, the customer count is approximately 272,256, representing 28.4 % of total customers.
- APAC accounts for about 141,555 customers, and LATAM accounts for about 48,319 customers under Google Cloud.
- Google Cloud’s global distribution includes more than 200 countries and territories, supported by 40 cloud regions and 121 zones.
- Google Cloud’s number of new customers increased by nearly 30 % from Q1 to Q2 2025.
- The backlog of contracted deals for Google Cloud reached $106 billion by mid‑2025, signaling future expansion in its customer base.
- Customer demand in some cases is outpacing capacity, as demand exceeded available data‑centre resources in Q1 2025.
- Google Cloud Next 2025 highlighted hundreds of new customer and partner announcements, reflecting accelerated global traction.
Customer Base by Industry
- Google Cloud lists industry‑specific solutions across retail, financial services, healthcare and life sciences, media and entertainment, telecom, manufacturing, logistics, government, education, and automotive.
- Papa John’s uses Google Cloud AI and analytics for personalized ordering and delivery experiences across markets.
- A large U.S. mortgage broker network uses Google Cloud AI for document and workflow automation across more than 50,000 brokers.
- A global entertainment company uses Google Cloud infrastructure and AI to deliver personalized streaming and media experiences.
- Singapore’s government uses Google Cloud Web Risk technology to secure citizen access and modernize digital services.
- Google Cloud provides industrial IoT and AI‑driven analytics capabilities for manufacturing and supply chain firms.
- Telecom operators leverage Google Cloud networking and edge solutions to support 5G deployments.
- Google Workspace and AI assistance tools serve education and enterprise collaboration workloads, with billions of monthly AI‑assisted actions.
Adoption Across Different Business Segments
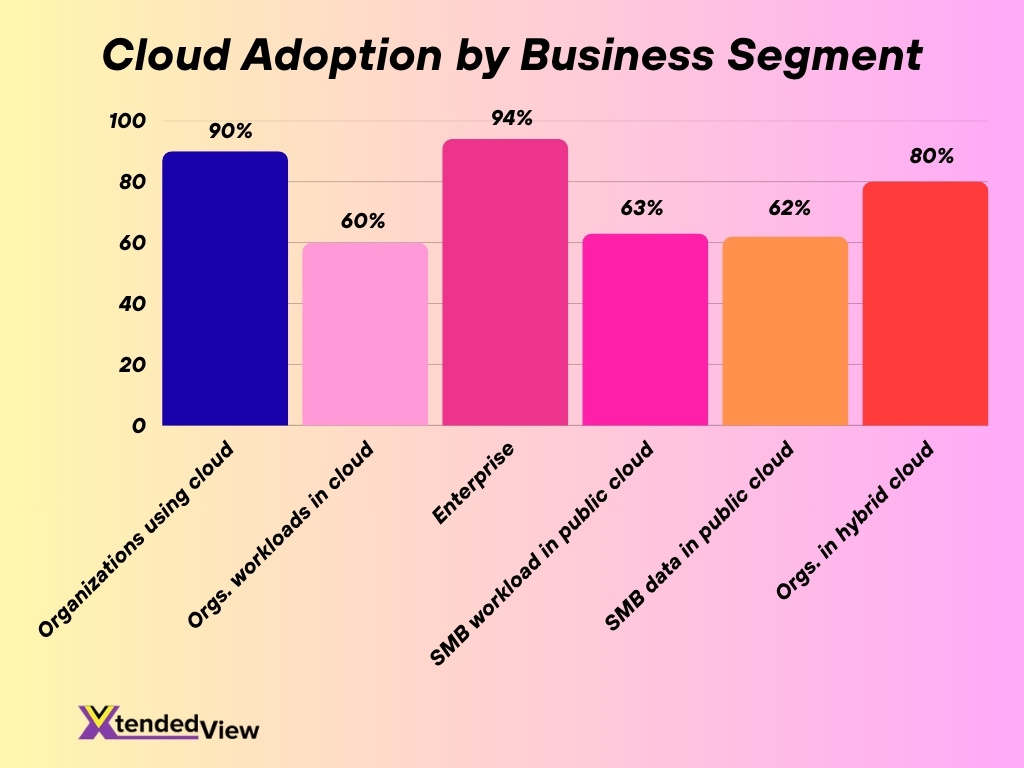
- More than 90 % of organizations globally use public cloud services in 2025.
- About 60 % of organizations run more than half of their workloads in the cloud.
- Enterprise adoption exceeds 94 % among organizations with 1,000+ employees.
- Google Cloud’s customer growth of 30 % from Q1 to Q2 2025 reflects rising adoption across business categories.
- Public cloud hosts around 63 % of SMB workloads and 62 % of SMB data.
- About 80 % of organizations operate in multi‑cloud or hybrid environments.
- Google Cloud consulting services are projected to grow at a 25 % CAGR through 2033, driven by enterprise migration needs.
- Google Cloud spans IaaS, PaaS, and SaaS offerings, enabling adoption from startups to large‑scale enterprise AI operations.
Growth Trends of Google Cloud Platform
- Google Cloud reported 32 % year‑over‑year growth in Q2 2025, with revenue at about US $13.6 billion.
- Annual revenue run‑rate surpassed $50 billion by mid‑2025.
- Contracted backlog reached US $106 billion by Q2 2025.
- Alphabet increased its 2025 CapEx plan to about US $85 billion to support cloud expansion.
- Large enterprise deals exceeding $250 million doubled year‑over‑year in H1 2025.
- Google Cloud maintains roughly 12‑13 % worldwide market share in early 2025.
- Demand growth temporarily exceeded data‑center capacity in early 2025.
- Google Cloud announced 229 new product and feature updates at Cloud Next 2025, reflecting rapid platform expansion.
Strategic Insights and Trends for IT Leaders
- Google Cloud emphasizes AI‑first workloads, with increasing adoption of Gemini and Vertex AI services.
- Multi‑cloud and hybrid‑cloud strategies place Google Cloud as a complementary platform alongside AWS and Azure.
- Growing enterprise deal size means procurement and architecture teams must plan for large‑scale cloud workloads.
- A $106 billion backlog suggests strong customer investment pipelines and long‑term commitment.
- Data‑center availability constraints in early 2025 require planning for capacity lead‑times and region readiness.
- Sector‑specific cloud stacks (retail, healthcare, telecom, government) support targeted digital transformation roadmaps.
- FinOps adoption is critical, as cloud spend optimization is now a top priority for mature cloud users.
- Security, compliance, and audit readiness remain core to enterprise strategy as regulated industries scale cloud use.
Google Cloud Services and Product Portfolio
- Google Cloud offers more than 100 services across compute, storage, networking, AI/ML, and analytics.
- New customers receive $300 in credits, plus access to 25+ always‑free products.
- Key services include Compute Engine, Cloud Storage, BigQuery, Cloud Build, and Cloud Code for cloud‑native development.
- Over 4 million developers build with Gemini models, and Vertex AI usage has grown 20× year‑over‑year.
- Anthos and hybrid‑cloud solutions help enterprises avoid vendor lock‑in and adopt multi‑cloud strategies.
- Google Cloud provides industry‑tailored stacks across healthcare, retail, telecom, government, and manufacturing.
- Cloud Next 2025 attracted more than 32,000 attendees, demonstrating strong developer and partner engagement.
Google Cloud Marketplace Statistics
- Google Cloud Marketplace enables the deployment of partner solutions and packaged cloud workloads.
- Cloud Next 2025 introduced an AI Agent Marketplace to streamline procurement and deployment of AI agents.
- Marketplace activity expanded with hundreds of new features and integrations announced at Cloud Next 2025.
- Marketplace offerings support faster deployment timelines for enterprises adopting AI, data, and security workloads.
- Partner ecosystem growth increases Marketplace solution availability and industry coverage.
- Marketplace products help accelerate vertical‑specific adoption in sectors like manufacturing and retail.
- SaaS‑based consumption models within the Marketplace continue rising alongside cloud‑native architectures.
- Marketplace participation supports hybrid and multi‑cloud adoption patterns across enterprise workloads.
Infrastructure, Regions, Zones, and Edge Locations
- Google Cloud operates 40+ regions globally and plans 9 more, reaching 49 regions by the end of 2025.
- Google Cloud supports 127 availability zones worldwide.
- Google Cloud has around 202 edge network locations to support low‑latency access.
- Each region has multiple zones for redundancy and high service availability.
- India hosts two Google Cloud regions, in Mumbai and Delhi, demonstrating a focus on emerging markets.
- Customers can choose deployment regions to satisfy compliance and latency requirements.
- Documentation and analyst reports show consistent growth from 36 regions to 40+ within one year.
- Large edge footprint supports real‑time computing, streaming workloads, and IoT deployments.
- Region strategy is central for disaster recovery, data sovereignty, and performance engineering.
- Global region growth favors international enterprises seeking distributed workload architectures.
Regional Distribution and Expansion
- Google Cloud’s presence spans North America, South America, Europe, Asia, the Middle East, Africa, and Australia.
- New regions in developing economies strengthen local computing availability and data residency.
- Industry sources show 42 regions and 127 zones by May 2025.
- Some reports reference 47 regions and 127 zones, reflecting a rapid infrastructure pace.
- Emerging markets gain improved latency and compliance support through regional expansion.
- Edge zones continue expanding to fuel real‑time and digital‑commerce use cases.
- Enterprises entering new regions benefit from early capacity gains and lower utilization costs.
- Regional investments align with hybrid‑cloud enterprise strategies and distributed workforce requirements.
- New regions provide flexibility for regulated industries requiring strict data residency.
- Regional growth positions Google Cloud competitively for multinational enterprise adoption.
Cloud Platform Usage Statistics
- Global public cloud spending is projected at $723.4 billion in 2025.
- More than 90% of organizations use public cloud services.
- Roughly 60% run more than half of their workloads in cloud environments.
- Large‑enterprise cloud adoption exceeds 94%.
- Around 33% of businesses spend over $12 million annually on cloud services.
- About 80% of companies use multi‑cloud or hybrid environments.
- Google Cloud’s infrastructure share of 12‑13% reflects strong workload adoption trends.
- Analytics and AI workloads drive a growing percentage of cloud usage on Google Cloud.
- Cloud cost reporting features help organizations monitor service‑level and regional expenses.
- Increasing cloud maturity brings a sharper focus on governance, cost control, and compliance.
Cloud Cost Optimization and Spending Patterns
- Migrating to next‑generation Google Cloud VMs provides 20‑40% performance gains and cost efficiencies.
- Organizations achieve roughly 30% cost savings by applying Google Cloud optimization best practices.
- Storage lifecycle rules and class choices reduce wasted cloud storage spend.
- Google Cloud billing dashboards help track spend across services, projects, and regions.
- Over 20% of organizations lack full cost visibility across cloud environments.
- FinOps programs are expanding as cost efficiency becomes a strategic priority.
- Committed‑use discounts and resource right‑sizing are critical to lowering spend.
- Orphaned storage volumes and unused snapshots remain key drivers of avoidable cost.
- Multi‑cloud environments require coordinated governance for cost management.
- Cloud spend optimization is now essential to maintaining competitiveness and margin efficiency.
AI and Automation Adoption on Google Cloud
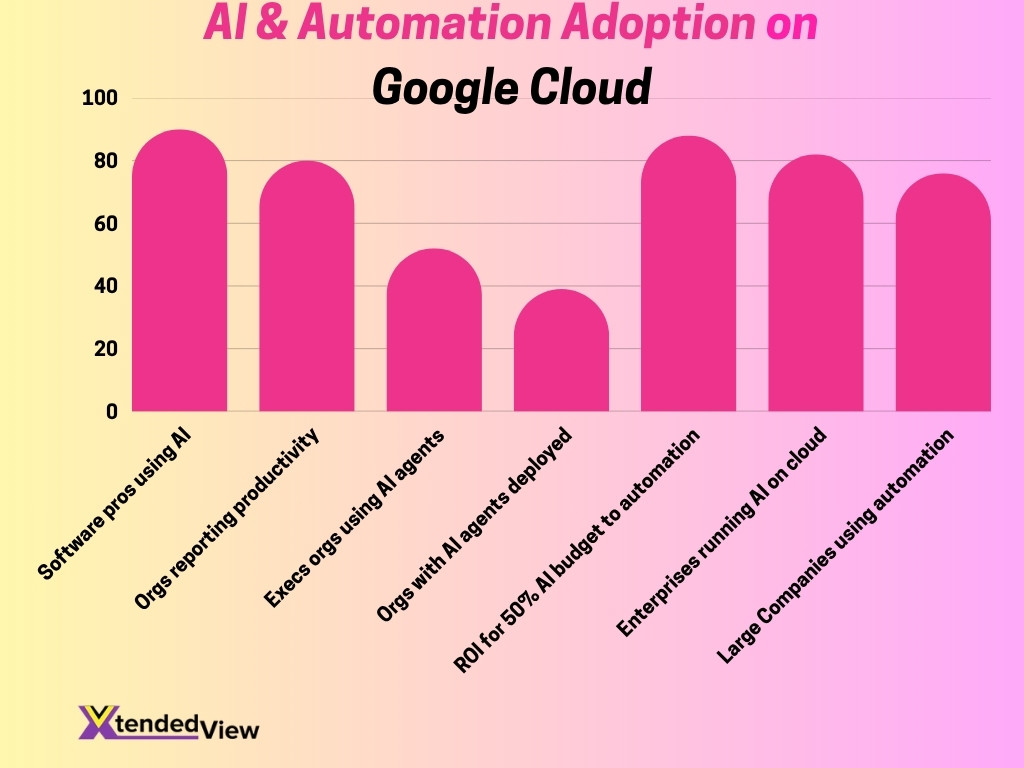
- 90% of software professionals report using AI at work in 2025.
- Over 80% believe AI has increased work productivity.
- 52% of executives say their organizations use AI agents in production.
- 39% have more than 10 AI agents deployed across business functions.
- Early adopters allocating 50%+ of AI budget to automation see 88% positive ROI.
- 82% of enterprises run AI workloads primarily on cloud platforms.
- 76% of large companies use automation for operational processes.
- Average annual AI spending for large enterprises is around US $6.5 million.
- Vertex AI and Gemini usage growth reflect increased ML adoption in production.
- Businesses adopting agentic AI are widening productivity and innovation gaps.
Security and Compliance Statistics
- Around 82% of all data breaches involve cloud‑stored data.
- 83% of organizations rate cloud security as a top concern, with 68% citing misconfigurations as a primary risk.
- Only 21% of organizations encrypt more than 60% of their cloud data.
- More than 90% of enterprises report improved security after cloud migration.
- The global cloud security market is projected to reach $62.9 billion by 2028.
- Google Cloud provides certification access and audit reports at no additional cost.
- 80% of enterprises evaluate or deploy Zero‑Trust security models.
- 88% of cloud breaches stem from human error or configuration mistakes.
- Enterprises must enforce IAM, encryption, logging, and regional compliance controls.
- Regulatory expansion requires proactive cloud governance and geographic workload planning.
Frequently Asked Questions (FAQs)
About 13 %.
Approximately US $13.6 billion, up ~32 % year‑over‑year.
Around $106 billion, up 38 % YoY.
Roughly 12 %.
Approximately 497,199 customers (about 51.8 % of the total).
Conclusion
The statistics for the Google Cloud Platform paint a compelling picture: global infrastructure is expanding, usage is accelerating, AI and automation are becoming mainstream, and security plus cost‑control remain core enterprise priorities. For IT leaders and business strategists alike, the message is clear: aligning your cloud strategy with region and zone footprint, driving AI adoption, and controlling spending are no longer optional but essential to competitiveness.
Whether migrating legacy systems, scaling global deployments, or advancing AI workloads, staying informed about these trends positions organizations to capitalize on Google Cloud’s continued momentum.