Technology shapes nearly every industry, from healthcare diagnostics and financial services to manufacturing and cybersecurity. Yet, the people building these systems still do not fully reflect the diversity of the populations they serve. Companies increasingly view workforce diversity as a competitive advantage because diverse teams often improve innovation, product design, and financial performance. The following statistics explore how representation across gender, race, and identity continues to evolve in the global technology sector.
Editor’s Choice
- Women account for approximately 27.6% of the global tech workforce in 2025, showing gradual progress but still representing less than one-third of the industry.
- Around 35% of the overall tech workforce is now made up of women, up significantly from single-digit representation in the early 2000s.
- U.S. tech degree programs produced 364,000 graduates in 2023, but only 27% were women.
- Underrepresented racial and ethnic groups represented 26% of U.S. tech graduates in 2023.
- Companies ranking in the top quartile for racial and ethnic diversity are 35% more likely to outperform financially than their peers.
- Women hold only 29% of C-suite positions across the technology sector.
- Female, Black, and Hispanic workers remain substantially underrepresented in high-tech occupations despite years of diversity initiatives.
Recent Developments
- Several major technology companies reduced or restructured diversity programs during 2025 amid changing corporate priorities and legal scrutiny.
- Meta previously doubled its number of Black and Hispanic employees by 2022, but the company announced an end to several DEI initiatives in early 2025.
- The proportion of women included in Time magazine’s list of influential AI figures dropped from 41% in 2023 to 28% in 2025.
- Around 20% of AI startups globally are founded by women, but only about 10% remain female-led as they scale.
- Mid-career women in technology face growing risks from automation and AI-driven hiring systems that may overlook candidates with non-linear career paths.
- More than 12,000 digital jobs remained unfilled in the UK during 2024, even as women remained underrepresented in technology roles.
- Six technology companies achieved representational parity in pay, opportunity, and representation during 2025, demonstrating measurable progress in inclusion efforts.
- Mid-sized technology companies now lead the industry in diversity initiatives, with more than 53% of leading employers reporting stronger representation metrics.
Global Tech Workforce Diversity Overview
- Women make up roughly 35% of the worldwide technology workforce, although representation varies significantly by role and geography.
- Females account for only 33% of all occupations within the tech industry, compared with 47% of total employment across all sectors.
- Asian professionals hold approximately 34% of U.S. technology jobs, making them the largest minority group in the sector.
- Hispanic or Latino workers represent just 5.9% of the U.S. technology workforce despite their larger share of the national labor force.
- Around 63% of U.S. technology employees are White, according to recent workforce estimates.
- Black workers account for approximately 7% of U.S. tech employment, remaining substantially underrepresented relative to the broader workforce.
- Native American, Native Hawaiian, and Pacific Islander workers collectively account for less than 1% of technology employment in the United States.
- The share of workers aged over 40 in technology declined from 55.9% in 2014 to 52.1% in 2022, indicating a younger workforce profile.
- Ethnic minority groups comprise around 25% of technology workers in the UK, though representation in leadership positions remains much lower.
Gender Diversity Insights Across Leading Tech Companies
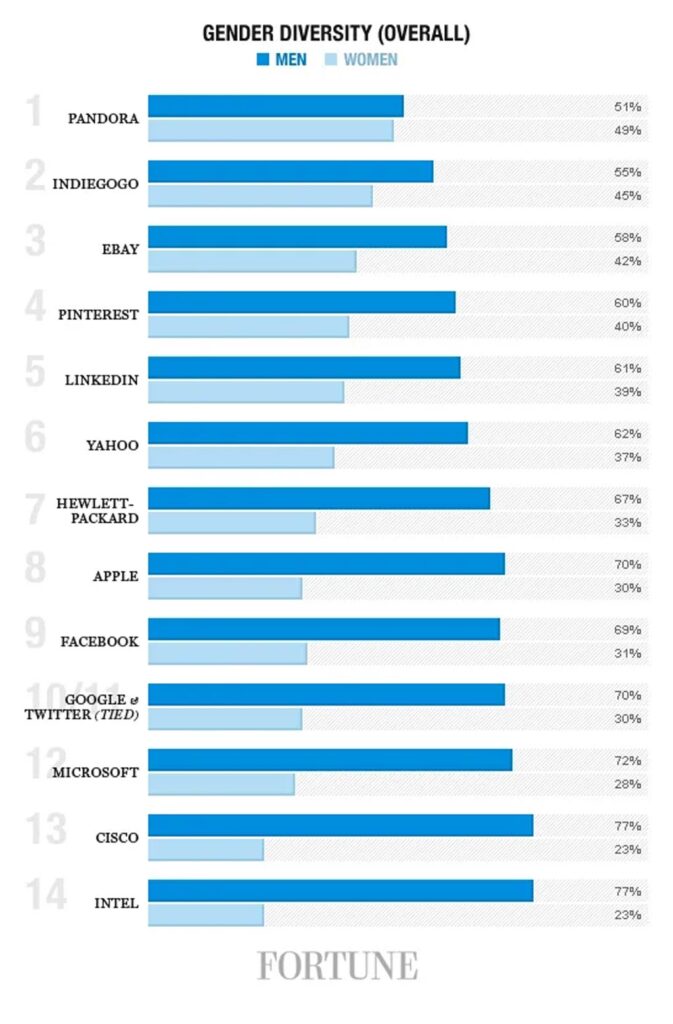
- Pandora has the most balanced workforce, with 51% men and 49% women, the smallest gender gap among the companies listed.
- Indiegogo reports 55% men and 45% women, making it one of the strongest performers for gender diversity.
- eBay employs 58% men and 42% women, keeping women above the 40% mark.
- Pinterest has a workforce consisting of 60% men and 40% women, reflecting relatively balanced representation.
- LinkedIn reports 61% men and 39% women, showing women account for nearly two-fifths of employees.
- Yahoo has 62% men and 37% women, indicating a moderate gender imbalance.
- Hewlett-Packard employs 67% men and 33% women, with women making up one-third of its workforce.
- Apple has a workforce split of 70% men and 30% women, highlighting a significant gender gap.
- Facebook reports 69% men and 31% women, with women representing nearly one in three employees.
- Google and Twitter (tied) each have 70% men and 30% women, demonstrating identical workforce gender distributions.
- Microsoft records 72% men and 28% women, with fewer than three in ten employees being women.
- Cisco has one of the widest gaps, with 77% men and 23% women in its workforce.
- Intel also reports 77% men and 23% women, tying Cisco for the lowest female representation among the companies shown.
- Across these leading tech companies, men consistently make up the majority, ranging from 51% to 77% of employees.
- Women’s representation ranges from 23% to 49%, showing that gender diversity remains uneven across much of the technology industry.
Women’s Participation in Technical Roles
- Women represent less than 25% of core technical positions such as software engineering and infrastructure.
- Only 18% of AI researchers and machine learning engineers worldwide are women.
- Women hold around 26% of computing occupations globally.
- Female participation in U.S. STEM jobs stands at approximately 35%.
- Women account for 27% of U.S. tech degree graduates, highlighting a continuing pipeline challenge.
- Promotion rates remain unequal, with only 87 women promoted to manager positions for every 100 men in technology companies.
- About 70% of women in technology report needing to work harder than male colleagues to prove their capabilities.
- Nearly 60,000 women leave technology jobs annually in the UK because of limited advancement opportunities and lack of recognition.
- Women are more than four times as likely as men to work part-time in IT specialist roles in the UK, at 13% versus 3%.
Racial and Ethnic Representation in Tech Jobs
- White professionals account for approximately 63% of the U.S. tech workforce, despite representing a smaller share of the country’s total population.
- Asian workers hold around 34% of technology jobs in the United States, making them the most represented minority group in the sector.
- Black professionals represent only 7% of U.S. tech employees, compared with roughly 13% of the national workforce.
- Hispanic and Latino workers account for just 8% of technology jobs, although they represent nearly one-fifth of the U.S. population.
- Native American, Native Hawaiian, and Pacific Islander employees collectively hold less than 1% of technology positions in the United States.
- Black and Hispanic workers together comprise just 16% of employees at major technology companies, despite representing more than 30% of the U.S. population.
- More than 50% of Black technology professionals report experiencing workplace discrimination or bias during their careers.
- Nearly 40% of Hispanic tech employees say they lack access to mentors and sponsors that could accelerate career advancement.
- Companies with higher ethnic diversity are 36% more likely to outperform financially than organizations with low diversity levels.
Representation of Gender Minorities in Tech
- Only 2-3% of the tech sector is comprised of people who openly identify as LGBTQ+.
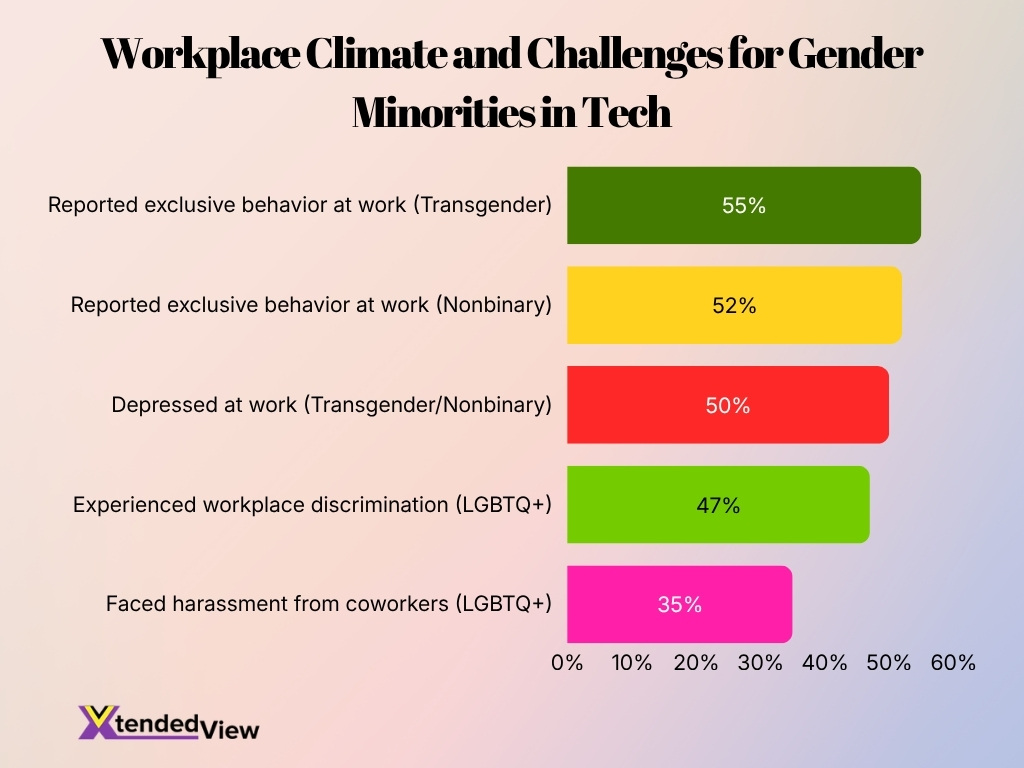
- More than 50% of transgender and nonbinary workers in tech report feeling depressed at work.
- Roughly 35% of LGBTQ+ tech workers report facing harassment from coworkers.
- Nearly 30% of LGBTQ+ youth avoid pursuing STEM careers due to fears of discrimination.
- Approximately 28% of LGBTQ+ scientists have considered leaving their workplace because of a hostile climate.
- Twenty-four percent of LGBTQ+ employees in tech reported experiencing public humiliation on the job.
- Less than half of surveyed tech professionals feel comfortable being out regarding their gender identity at work.
- Transgender students remain in STEM majors at a rate roughly 10% lower than their cisgender peers.
- Exclusive behavior at work was reported by 55% of transgender participants and 52% of nonbinary participants.
- Only one-third of tech companies currently recognize non-binary genders in their employee demographic data.
Intersectional Diversity in the Technology Industry
- Women of color represent only 4% of computing occupations in the United States.
- Black women account for approximately 3% of the U.S. technology workforce.
- Latina women hold less than 2% of computing jobs despite rapid demographic growth.
- LGBTQ+ workers in tech report a 47% rate of experiencing workplace discrimination in their careers.
- Nearly 50% of women in tech from underrepresented racial groups report experiencing microaggressions at work.
- For every 100 men promoted to managerial roles in tech, only 74 women of color receive similar promotions.
- About 57% of women in technology plan to leave their jobs within two years due to workplace exclusion.
- Female tech employees are 1.6 times more likely to face layoffs compared to their male counterparts.
- More than 33% of LGBTQ+ employees of color in technology report hiding aspects of their identities at work.
Diversity in Data, AI, and Analytics Roles
- Women represent only 22% of professionals working in artificial intelligence globally.
- Female representation among AI researchers remains below 20% worldwide.
- Less than 15% of AI research authors are women.
- Approximately 18% of machine learning engineers globally are female.
- Black and Hispanic professionals together account for less than 10% of workers in AI and advanced analytics roles in the United States.
- Around 80% of AI professors at leading universities are men.
- Diverse AI teams are significantly more likely to identify algorithmic bias and fairness issues during product development.
- Companies increasingly recruit talent from nontraditional educational backgrounds to diversify data science and AI teams.
- Demand for AI professionals grew by more than 20% year over year in 2025, intensifying competition for diverse talent pools.
Leadership Diversity by Organizational Level
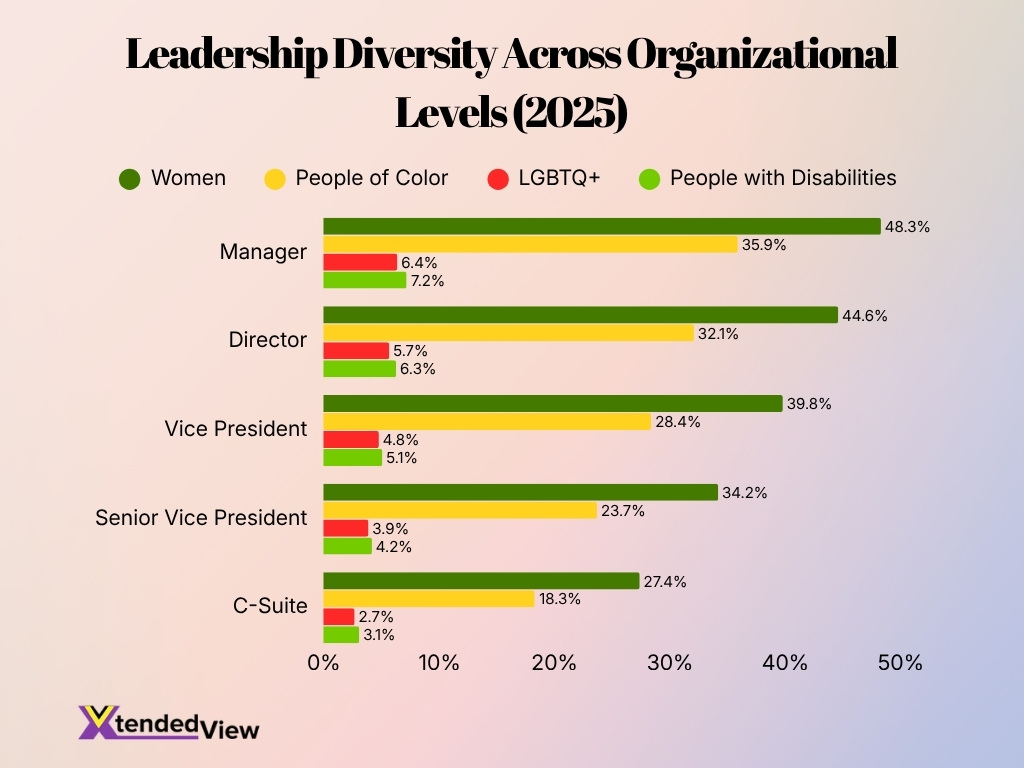
- Managers have the highest representation of women at 48.3%, nearly reaching gender parity.
- Women’s representation steadily declines from 48.3% at the manager level to 27.4% in the C-Suite.
- People of color account for 35.9% of managers, but only 18.3% of C-Suite executives.
- Vice Presidents include 39.8% women and 28.4% people of color, reflecting a more diverse mid-executive level.
- Senior Vice Presidents report 34.2% women and 23.7% people of color, showing a noticeable leadership gap.
- LGBTQ+ representation rises from 2.7% in the C-Suite to 6.4% among managers.
- People with disabilities represent 7.2% of managers, compared with only 3.1% of C-Suite leaders.
- Directors have 44.6% women, 32.1% people of color, 5.7% LGBTQ+ employees, and 6.3% people with disabilities.
- Every diversity category shows lower representation at higher leadership levels, indicating a shrinking pipeline toward executive roles.
- The data highlights that executive leadership remains significantly less diverse than lower management levels across all measured groups.
- The largest representation gap is observed in women, with a difference of 20.9 percentage points between Managers (48.3%) and the C-Suite (27.4%).
- The findings suggest organizations still face challenges in advancing diverse talent into senior leadership and executive positions.
Diversity in Software Development and Engineering Roles
- Women hold approximately 24% of software engineering positions in the United States.
- Around 91% of software developers worldwide identify as men, highlighting the industry’s persistent gender imbalance.
- Women account for less than 20% of senior software engineering roles globally.
- Black developers represent approximately 5% of software engineers in the United States.
- Hispanic professionals account for roughly 8% of software engineering positions across the country.
- More than 50% of software developers now work remotely or in hybrid arrangements, opening access to broader talent pools and increasing geographic diversity.
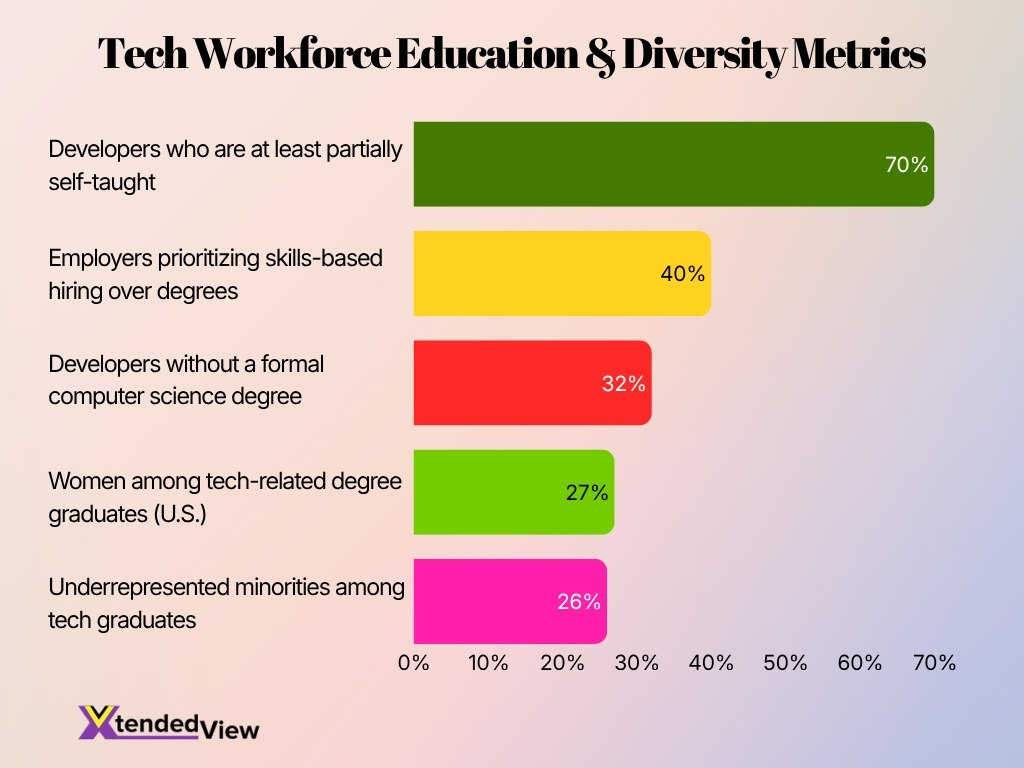
- About 32% of developers have no formal computer science degree, reflecting the growing importance of alternative career pathways.
- Nearly 70% of developers report that diverse teams improve problem-solving and product quality.
- Open-source communities continue to struggle with inclusion, with women accounting for fewer than 10% of open-source contributors worldwide.
Age Diversity in the Technology Workforce
- The median age of technology workers in the United States is approximately 38 years.
- Workers aged 25 to 44 account for nearly 60% of the technology workforce.
- Employees aged 55 and older represent approximately 15% of tech professionals.
- The proportion of technology workers over age 40 declined from 55.9% in 2014 to 52.1% in 2022.
- More than 60% of technology professionals believe age bias exists within the industry.
- Over 53% of IT professionals aged 45 and above report having experienced age discrimination.
- Just 15.3% of surveyed software developers are over the age of 45 years old.
- The average manager in the tech industry is 42 years old, compared to 47 years old in non-tech sectors.
Educational Background and Pathways Into Tech
- Around 32% of software developers do not hold a computer science degree, demonstrating the industry’s openness to alternative pathways.
- More than 70% of developers report being at least partially self-taught.
- Boot camp graduates now account for a growing share of entry-level technology hires in software development and data analytics.
- U.S. colleges awarded approximately 364,000 technology-related degrees in 2023, a record high.
- Women earned only 27% of technology-related degrees in the United States during 2023.
- Underrepresented minorities accounted for 26% of technology graduates in 2023.
- More than 40% of employers now consider skills-based hiring more important than formal degrees for many technology roles.
- Certifications in cloud computing, cybersecurity, and data analytics increasingly serve as alternative entry routes into technology careers.
- Apprenticeships and workforce development programs have expanded rapidly as employers seek more diverse talent pipelines.
Regional Diversity Trends in Tech
- North America remains the world’s largest technology labor market, employing more than 6.4 million tech workers in the United States alone.
- Women account for roughly 35% of tech workers in North America, one of the highest shares globally.
- The European Union reported that women represented only 19.4% of ICT specialists in 2024.
- About 9.8 million people worked as ICT specialists across the European Union in 2024, accounting for approximately 5% of total employment.
- India employed more than 5.8 million technology professionals in 2025, making it one of the world’s largest digital talent hubs.
- Women comprise nearly 36% of India’s technology workforce, significantly above the global average.
- Africa’s digital economy could create 230 million technology-related jobs by 2030, increasing opportunities for underrepresented groups.
- Latin America’s technology sector saw female participation exceed 30% of digital jobs in several major markets during 2025.
- Singapore and Australia continue to report some of the strongest progress in technology workforce inclusion through government-backed STEM initiatives.
Racial Pay Equity Statistics
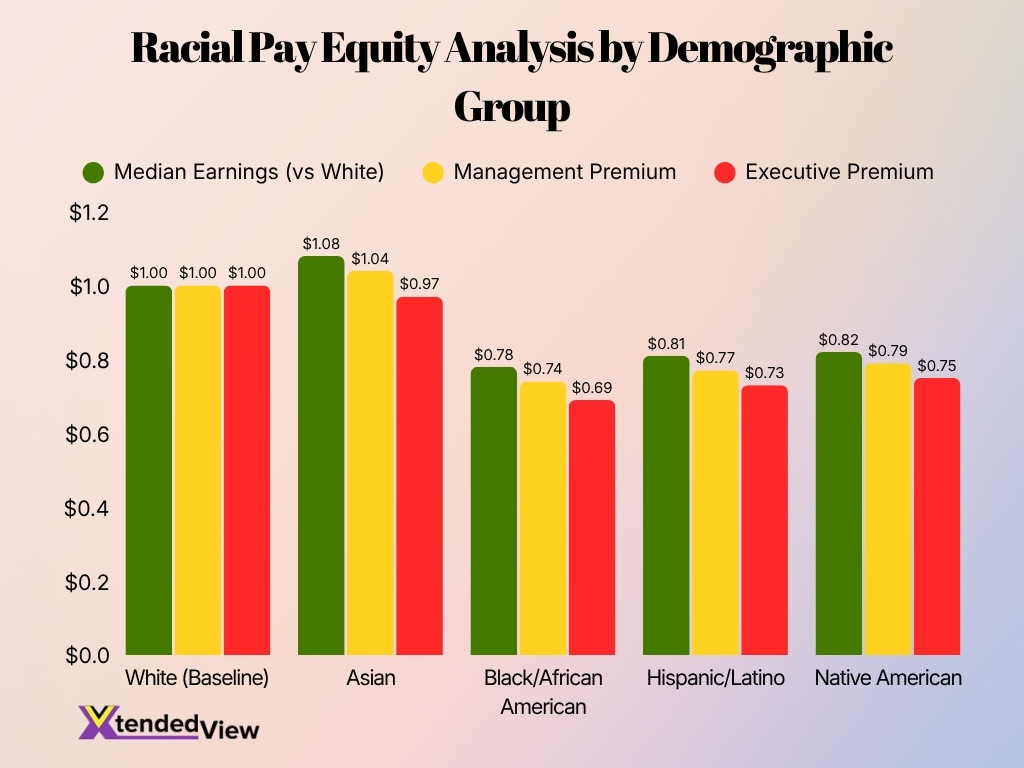
- Asian employees have the highest median earnings, earning $1.08 for every $1.00 earned by White employees.
- White employees serve as the baseline, with earnings and premiums set at $1.00 across all categories.
- Black/African American employees earn only $0.78 of the White median wage, highlighting a 22% pay gap.
- Hispanic/Latino employees receive $0.81 in median earnings compared to the White baseline.
- Native American employees earn $0.82, indicating an 18% earnings gap relative to White employees.
- Management premiums decline for every non-White demographic except Asian employees, who receive $1.04.
- Black/African American managers have the lowest management premium at $0.74.
- Hispanic/Latino managers earn a management premium of $0.77, below the White benchmark.
- Native American managers receive a management premium of $0.79, reflecting continued disparities.
- Executive pay gaps are widest for Black/African American executives, whose premium falls to $0.69.
- Hispanic/Latino executives receive an executive premium of $0.73, below the White baseline.
- Native American executives earn an executive premium of $0.75, showing persistent underrepresentation in top pay.
- Asian executives receive an executive premium of $0.97, slightly below the White executive benchmark despite leading median earnings.
- The data shows that pay disparities generally widen at higher leadership levels for most racial and ethnic groups.
- These figures emphasize the need for racial pay equity initiatives, fair promotion practices, and transparent compensation policies across organizations.
Diversity in Startup and VC-Funded Tech Companies
- Companies founded exclusively by women received only 2% of global venture capital funding in 2025.
- Mixed-gender founding teams secured approximately 17% of venture capital investment worldwide in 2025.
- Startups with at least one female founder generated 78 cents in revenue per dollar invested, compared with 31 cents for male-founded companies.
- Black founders received less than 1.5% of U.S. venture capital funding in 2025.
- Latino founders captured approximately 2% of venture capital funding in the United States.
- Women hold fewer than 15% of decision-making positions in venture capital firms globally.
- Startups with diverse leadership teams are 25% more likely to achieve above-average profitability than less diverse peers.
- More than 60% of venture capital firms introduced formal diversity initiatives or founder outreach programs between 2023 and 2025.
- The number of venture funds dedicated to women and underrepresented founders reached record levels in 2025, reflecting increasing investor demand for inclusive innovation.
Hiring, Promotion, and Retention Gaps in Tech
- For every 100 men promoted to manager, only 87 women receive similar promotions in technology organizations.
- Black and Hispanic employees remain less likely to advance into leadership positions despite similar qualifications and tenure.
- Nearly 50% of women in technology leave the industry by age 35 due to limited advancement opportunities and workplace culture challenges.
- Around 62% of technology employees from underrepresented groups report experiencing bias during hiring or promotion decisions.
- Women are more likely than men to leave technology careers after experiencing unequal pay or limited career development opportunities.
- More than 70% of employers acknowledge difficulties retaining diverse technology talent.
- Technology companies with mentorship and sponsorship programs report significantly better retention among women and minority employees.
- Employees who feel included at work are three times more likely to remain with their employer.
- Flexible work arrangements and remote opportunities have improved retention rates among caregivers and employees with disabilities.
Business Benefits of Workforce Diversity
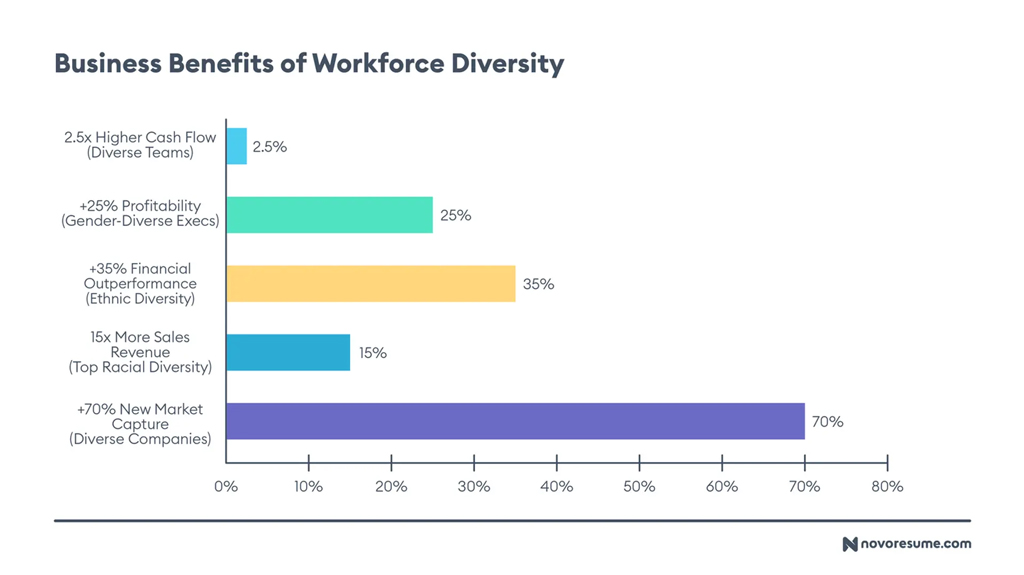
- Diverse teams generate 2.5x higher cash flow, highlighting the financial value of an inclusive workforce.
- Companies with gender-diverse executives are 25% more profitable than less diverse organizations.
- Organizations with strong ethnic diversity achieve 35% better financial performance than their peers.
- Businesses with the highest racial diversity report up to 15x more sales revenue, demonstrating the commercial impact of inclusion.
- Diverse companies are 70% more likely to capture new markets, strengthening long-term growth opportunities.
- The 70% new market capture rate is the highest reported business advantage among the diversity benefits shown.
- Financial outperformance (+35%) exceeds the profitability gain (+25%), suggesting diversity contributes beyond operational efficiency.
- Gender, ethnic, and racial diversity each provide measurable business advantages across profitability, revenue, and financial performance.
- The data indicates that greater workforce diversity is associated with stronger business growth, innovation, and competitive advantage.
- Investing in diversity and inclusion initiatives can help organizations improve revenue, profitability, cash flow, and market expansion simultaneously.
Frequently Asked Questions (FAQs)
Women make up approximately 26.7% of the global technology workforce as of 2025-2026.
Women occupy about 28% of computing and technology roles in the United States.
Female-only founded startups received just 2% of global venture capital funding in 2025.
Companies in the top quartile for ethnic diversity are 36% more likely to achieve above-average profitability than less diverse peers.
Women account for only 22% of the global artificial intelligence workforce, highlighting the persistent gender gap in emerging technologies.
Conclusion
Diversity in technology continues to improve, but the industry still faces substantial representation gaps across gender, race, age, and leadership. Women and underrepresented communities remain less visible in executive roles, venture funding, and high-growth technical specialties such as AI and software engineering. At the same time, organizations that prioritize inclusion continue to outperform peers in innovation, profitability, and employee retention.
The data also shows that progress requires more than hiring targets. Companies that invest in equitable promotion practices, alternative talent pathways, pay transparency, and inclusive leadership are building stronger and more resilient workforces. As artificial intelligence, cybersecurity, and digital transformation reshape the global economy, creating a diverse technology workforce will remain both a business imperative and a competitive advantage.