
Kitchen appliances have become a central part of modern households, helping consumers save time, reduce energy use, and improve food preparation. From connected refrigerators in smart homes to commercial-grade equipment used in restaurants and food service operations, these products influence how people cook, store, and manage food every day. As manufacturers invest in AI, IoT, and energy-efficient technologies, the industry continues to evolve rapidly. Explore the latest kitchen appliances statistics to understand market growth, consumer demand, and emerging technology trends.
Editor’s Choice
- The global kitchen appliances market is valued at $287.66 billion in 2026 and is forecast to reach $502.07 billion by 2034.
- Global kitchen appliance revenue reached approximately $254.7 billion in 2025.
- The kitchen appliances industry is projected to grow at a 7.21% CAGR between 2026 and 2034.
- Smart kitchen appliance revenue was estimated at $22.36 billion in 2024, up from $18.75 billion in 2023.
- North America accounted for 32.58% of the global home appliance market in 2025.
- Residential buyers represented 74.5% of kitchen appliance demand in 2025.
- The smart kitchen market is expected to reach $40.98 billion by 2031, reflecting strong consumer interest in connected cooking devices.
Recent Developments
- The smart home appliance market is projected to grow from $54.77 billion in 2026 to $166.83 billion by 2034.
- Smart kitchen appliances are forecast to generate $25.57 billion in revenue during 2026, compared with $22.97 billion in 2025.
- AI-powered ovens with integrated cameras and automatic cooking adjustments gained significant market attention throughout 2025.
- Manufacturers increasingly introduced induction cooktops with built-in extraction systems to improve space efficiency in modern kitchens.
- Multi-function coffee makers capable of pod, drip, and bean-to-cup brewing emerged as a growing premium category during 2025.
- Smart refrigerators equipped with larger displays and AI-assisted food management became one of the fastest-growing smart appliance categories.
- The global smart kitchen appliance market is expected to expand by $22.39 billion between 2023 and 2028.
- The market recorded an estimated 14.12% year-over-year growth rate between 2023 and 2024.
- Appliance makers increasingly integrated energy-management functions that allow devices to participate in connected home energy ecosystems.
General Kitchen Appliances Statistics
- The global kitchen appliances market was estimated at $178.1 billion in 2025 under a dedicated kitchen-appliance category analysis.
- Market value is expected to reach $186.9 billion in 2026.
- Industry revenue is forecast to climb to $295.5 billion by 2035.
- The sector is expected to maintain a 5.2% CAGR from 2026 to 2035.
- Another industry estimate places total kitchen appliance revenue at $254.7 billion in 2025.
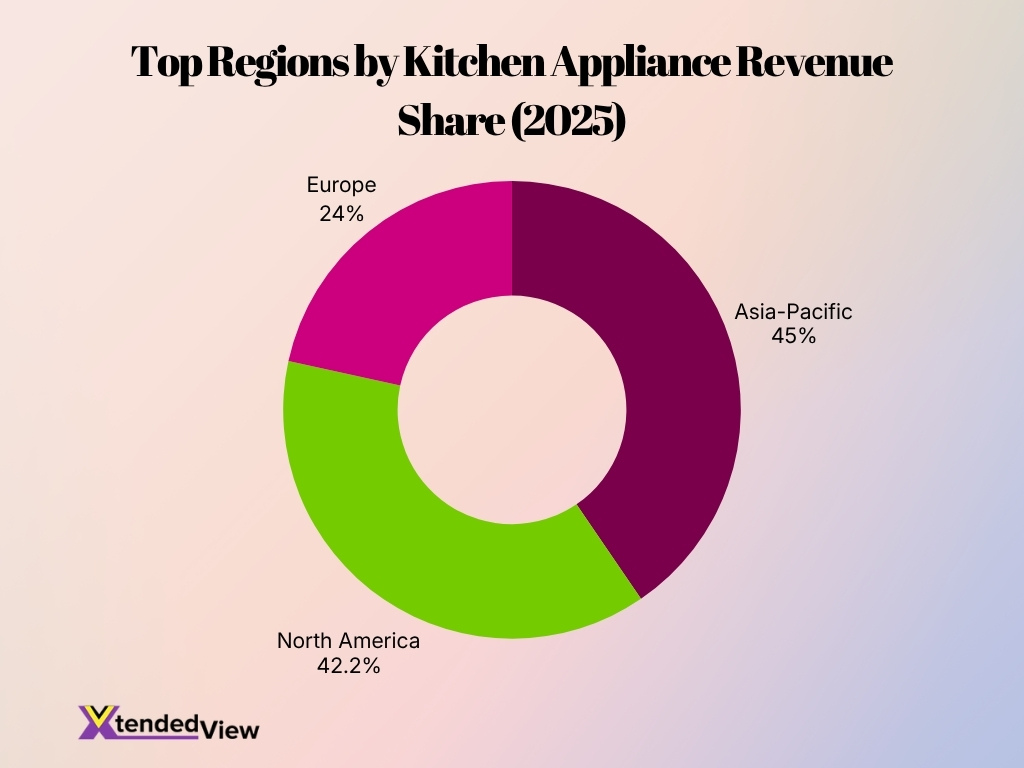
- North America held approximately 42.2% of global kitchen appliance sales in 2025.
- Large kitchen appliances generated around $98.5 billion in revenue during 2025.
- Asia-Pacific remained the largest regional market for kitchen appliances in 2025.
- Major manufacturers collectively controlled about 45% of the global market share in 2025.
Smart Kitchen Appliances Market Growth Statistics
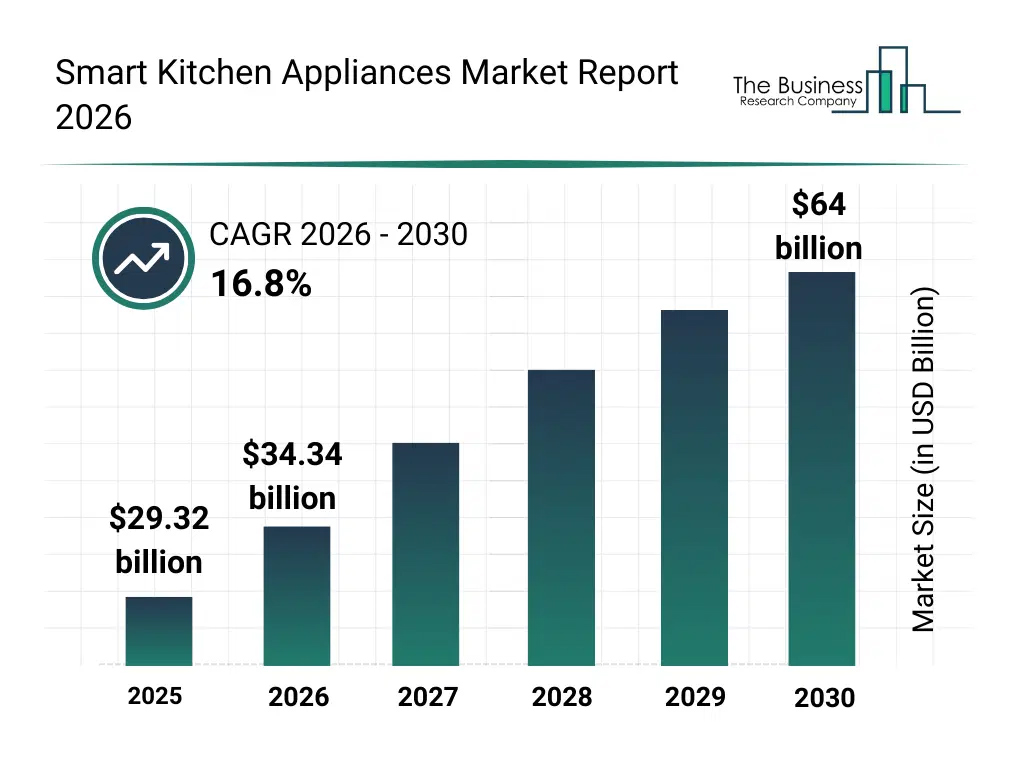
- The smart kitchen appliances market is projected to grow from $34.34 billion in 2026 to $64 billion by 2030, nearly doubling in value.
- The market is expected to expand at a strong 16.8% CAGR between 2026 and 2030.
- Global market size increased from $29.32 billion in 2025 to $34.34 billion in 2026, reflecting robust annual growth.
- By 2027, the smart kitchen appliances market is forecast to reach approximately $40.11 billion.
- Market value is expected to surpass $46.85 billion in 2028, highlighting accelerating consumer adoption.
- The industry is projected to reach around $54.72 billion in 2029 before crossing the $64 billion mark in 2030.
- Between 2025 and 2030, the market is forecast to gain approximately $34.68 billion in total value.
- The 2030 market size is expected to be about 2.2 times larger than the 2025 market value.
Kitchen Appliances Revenue Statistics
- Global kitchen appliance revenue reached approximately $254.7 billion in 2025.
- Revenue is projected to increase to $287.66 billion in 2026.
- Industry sales could surpass $380.9 billion by 2034, according to one forecast model.
- A separate forecast estimates revenue reaching $502.07 billion by 2034.
- Large kitchen appliances generated $98.5 billion in 2025 revenue.
- The U.S. kitchen appliance market alone was valued at $28.4 billion in 2025.
- The U.S. home appliance market is projected to reach $342.71 billion by 2032.
- Smart kitchen appliance revenue increased from $18.75 billion in 2023 to $22.36 billion in 2024.
- Smart appliance revenue overall is expected to reach $71.28 billion by 2030.
Smart Kitchen Appliances Statistics
- The global smart kitchen appliance market was valued at $18.75 billion in 2023.
- Revenue increased to $22.36 billion in 2024, representing strong annual growth.
- The market is projected to reach $60.20 billion by 2030.
- Smart kitchen appliances are forecast to grow at a 17.9% CAGR through 2030.
- Another forecast estimates the market at $26.25 billion in 2026.
- The market could reach $43.93 billion by 2031.
- Global smart kitchen revenues reached nearly $18.8 billion in 2023 and may rise to $91.5 billion by 2030.
- The U.S. smart kitchen appliance market was valued at $6.9 billion in 2025.
- U.S. smart kitchen appliance revenue is projected to reach $17.64 billion by 2033.
- Smart kitchen appliance adoption continues to rise due to growing smart-home penetration, IoT connectivity, and AI-enabled cooking assistance.
Online Sales and E-Commerce Kitchen Appliances Statistics
- Online channels accounted for approximately 37% of global home appliance sales in 2025, up from around 32% in 2022.
- E-commerce sales of kitchen appliances are projected to grow at a CAGR exceeding 8% through 2030, outpacing traditional retail channels.
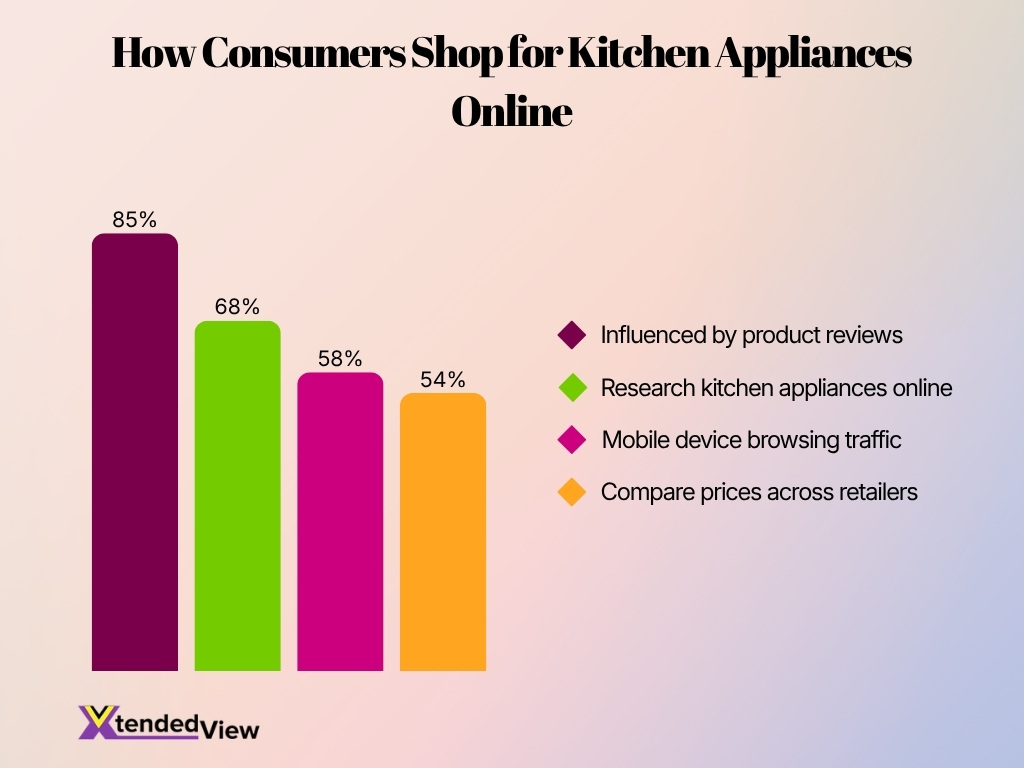
- More than 68% of U.S. consumers research kitchen appliances online before making a purchase decision.
- Around 54% of appliance shoppers compare prices across at least three online retailers before buying.
- Mobile devices generated nearly 58% of online appliance browsing traffic in 2025.
- Product reviews influence purchasing decisions for over 85% of online appliance buyers.
- Buy-now-pay-later financing options contributed to approximately 18% of online major appliance purchases in 2025.
- Same-day and next-day delivery availability increased online appliance conversion rates by more than 20% among U.S. shoppers.
- Online-exclusive appliance models represented roughly 12% of new product launches in 2025.
Residential vs. Commercial Kitchen Appliances Statistics
- Residential applications represented 74.5% of total kitchen appliance demand in 2025.
- Commercial kitchen appliances accounted for approximately 25.5% of global demand in 2025.
- The commercial kitchen equipment market exceeded $95 billion globally in 2025.
- Residential appliance sales benefited from growing home renovation activity, which increased by nearly 7% year over year in 2025.
- More than 64% of homeowners upgrading kitchens purchased at least one new appliance during remodeling projects.
- Restaurants and foodservice operators allocate approximately 15% to 25% of kitchen setup budgets toward equipment purchases.
- Commercial induction cooking equipment sales increased by more than 18% in 2025, driven by energy-efficiency goals.
- Cloud kitchens and delivery-focused food businesses contributed to a double-digit increase in commercial appliance demand across major cities.
- The average replacement cycle for residential kitchen appliances remains between 8 and 15 years, depending on appliance type.
Specialty Kitchen Appliances Statistics: Air Fryers and Coffee Makers
- Air fryer ownership in the United States reached approximately 67% of households in 2025, compared with 38% in 2022.
- The global air fryer market exceeded $1.5 billion in 2025 and continues to expand rapidly.
- Air fryer sales are projected to grow at a CAGR above 7% through 2030.
- Nearly 45% of consumers cite healthier cooking as the primary reason for purchasing an air fryer.
- Global coffee machine market revenue surpassed $18 billion in 2025.
- Single-serve coffee makers account for roughly 40% of household coffee machine sales in North America.
- Bean-to-cup coffee machine sales increased by more than 12% in 2025, reflecting demand for premium home coffee experiences.
- Around 73% of Americans drink coffee daily or weekly, supporting continued demand for coffee appliances.
- Smart coffee makers with app connectivity are expected to experience double-digit annual growth through 2030.
Regional Market Kitchen Appliances Statistics
- Asia-Pacific remained the largest kitchen appliance market in 2025, accounting for more than 45% of global revenue.
- North America held approximately 42.2% of the kitchen appliance market revenue in 2025.
- Europe represented nearly 24% of worldwide kitchen appliance sales during 2025.
- China continued to lead global appliance production, manufacturing over 35% of the world’s household appliances.
- India’s kitchen appliance market is expected to grow at a CAGR above 10% through 2030, one of the fastest rates globally.
- U.S. consumers spent more than $28 billion on kitchen appliances in 2025.
- The Middle East appliance sector is projected to expand by approximately 7% annually through 2030, supported by housing developments.
- Latin America’s appliance market recorded growth of roughly 6% in 2025, driven by Brazil and Mexico.
- Southeast Asian markets saw increasing demand for compact and multifunctional appliances due to urbanization trends.
Large Kitchen Appliances Statistics: Refrigerators and Ovens
- Large kitchen appliances generated approximately $98.5 billion in global revenue during 2025.
- Refrigerators remain the largest appliance category, accounting for nearly 30% of large appliance sales worldwide.
- Global refrigerator shipments exceeded 190 million units annually by 2025.
- Smart refrigerator sales increased by more than 15% year over year in 2025.
- French-door refrigerator models represented over 40% of premium refrigerator sales in North America.
- Built-in ovens experienced approximately 9% sales growth in 2025, driven by luxury kitchen renovations.
- Convection oven adoption surpassed 60% among newly installed residential ovens in the U.S. market.
- Energy-efficient refrigerators can reduce electricity consumption by up to 15% compared with standard models.
- Connected ovens capable of remote control and monitoring are projected to grow at a double-digit CAGR through 2030.
Small Kitchen Appliances Statistics
- The global small kitchen appliance market exceeded $135 billion in 2025.
- Small appliances are forecast to grow at a CAGR of approximately 6% through 2030.
- Coffee machines, blenders, air fryers, and mixers account for more than 55% of small appliance revenue.
- Over 70% of U.S. households own at least one countertop small kitchen appliance used daily.
- Blender ownership among U.S. households exceeded 60% in 2025.
- Electric kettle sales grew by approximately 8% year over year due to rising tea and specialty beverage consumption.
- Compact appliances designed for apartments and small kitchens experienced demand growth above 12% in urban markets.
- Multi-cookers maintained strong popularity, with ownership rates approaching 30% of U.S. households.
- Cordless kitchen appliances emerged as a fast-growing category, supported by advances in battery technology.
Kitchen Appliance Brand Market Share Statistics
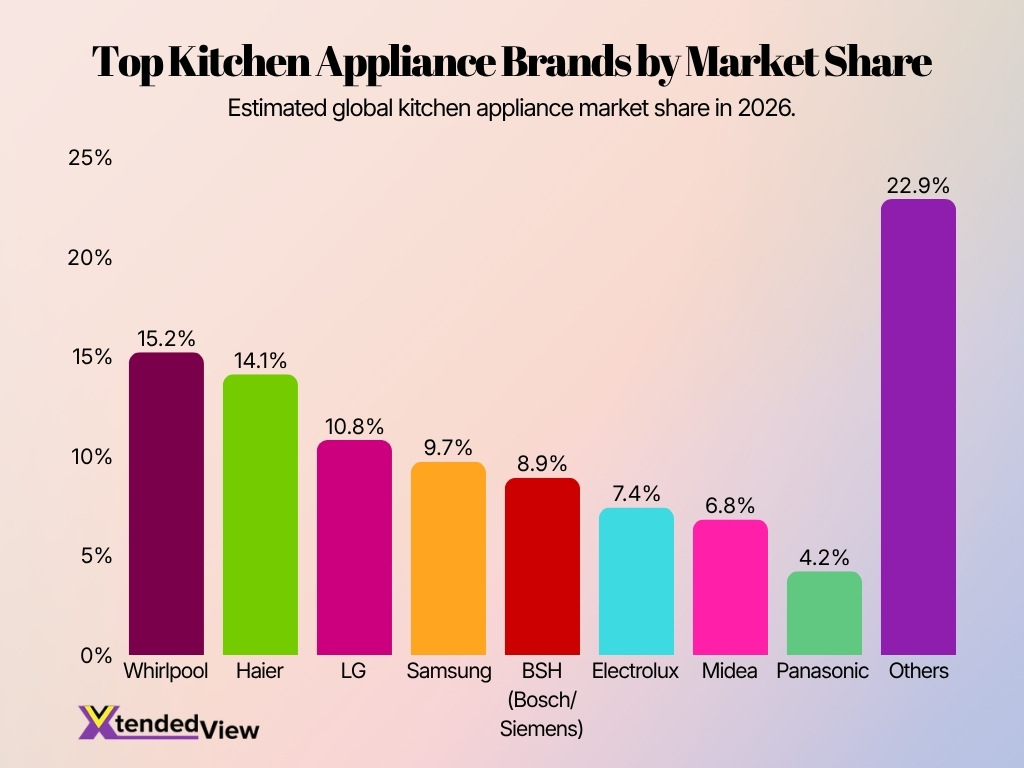
- Others collectively hold the largest market share at 22.9%, highlighting the fragmented nature of the global kitchen appliance market.
- Whirlpool leads among individual brands with a 15.2% market share, making it the top standalone kitchen appliance manufacturer.
- Haier ranks second with 14.1%, trailing Whirlpool by just 1.1 percentage points.
- LG captures 10.8% of the market, securing a position among the top three global appliance brands.
- Samsung accounts for 9.7% of global market share, remaining a major competitor in the kitchen appliance industry.
- BSH (Bosch/Siemens) holds 8.9% of the market, reflecting strong demand for its premium appliance portfolio.
- Electrolux represents 7.4% of global kitchen appliance sales, maintaining a solid international presence.
- Midea controls 6.8% of the market, demonstrating the growing influence of Chinese appliance manufacturers.
- Panasonic has the smallest share among listed brands at 4.2%, yet it remains a recognized global player.
- The top four brands, Whirlpool, Haier, LG, and Samsung, collectively command 49.8% of the global kitchen appliance market.
Energy-Efficient Kitchen Appliances Statistics
- Appliances certified under modern efficiency standards can consume 10% to 50% less energy than conventional models.
- Households replacing older refrigerators with efficient models can save approximately $220 over the appliance’s lifetime.
- ENERGY STAR-certified refrigerators use roughly 9% less energy than federal minimum standards require.
- Induction cooktops can transfer up to 90% of energy directly to cookware, compared with approximately 40% to 55% for gas cooking.
- More than 60% of consumers consider energy efficiency an important factor when purchasing a kitchen appliance.
- Global demand for energy-efficient appliances is projected to grow at a CAGR above 8% through 2030.
- Efficient dishwashers can save over 5,000 gallons of water during their operational life.
- Smart energy-monitoring features were included in approximately 30% of newly launched premium appliances in 2025.
- Government rebate and incentive programs contributed to increased adoption of energy-efficient appliances across North America and Europe in 2025.
Consumer Purchasing Behavior in Kitchen Appliances Statistics
- Approximately 68% of consumers research appliances online before making a purchase.
- Product reviews influence purchasing decisions for more than 85% of appliance buyers.
- Around 72% of shoppers compare multiple brands before selecting a major kitchen appliance.
- Energy efficiency ranks among the top three purchase factors for over 60% of consumers.
- More than 50% of buyers wait for seasonal promotions or holiday discounts before purchasing major appliances.
- Appliance replacement remains the leading purchase driver, accounting for approximately 70% of major appliance sales.
- Smart features influence purchasing decisions for nearly 40% of younger consumers aged 25–44.
- Financing options increase conversion rates for high-ticket appliances by more than 20%.
- Consumers spend an average of two to four weeks researching major appliances before purchase.
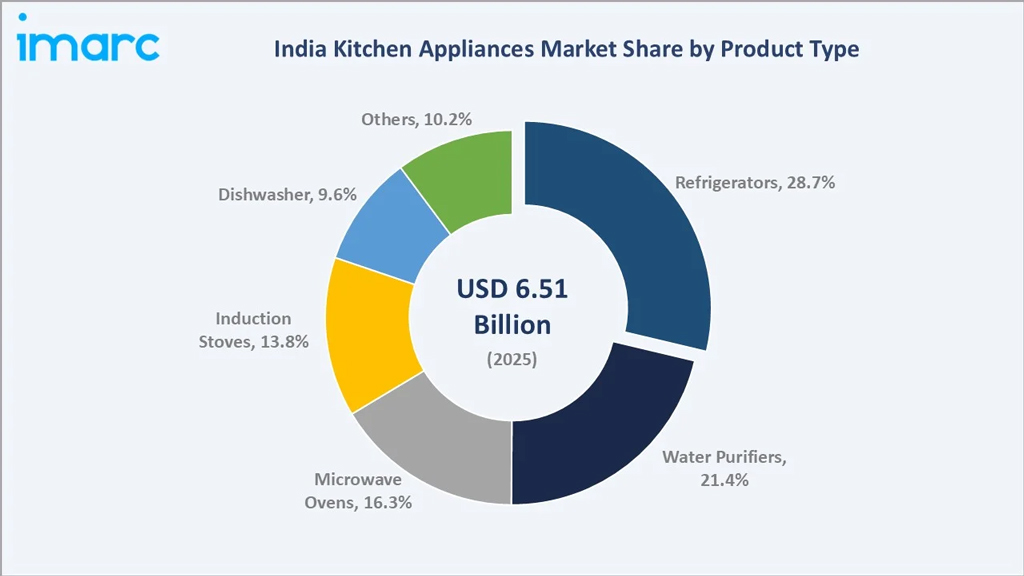
India Kitchen Appliances Market Share Statistics
- Refrigerators dominated the Indian kitchen appliances market with a 28.7% share in 2025.
- Water Purifiers accounted for 21.4% of the market, making them the second-largest segment.
- Microwave Ovens captured 16.3% of the total Indian kitchen appliances market share.
- Induction Stoves held a 13.8% share, reflecting growing demand for energy-efficient cooking appliances.
- The other category contributed 10.2% of the market, representing a diverse range of kitchen products.
- Dishwashers represented 9.6% of the market, making them the smallest segment among the listed categories.
- The Indian kitchen appliances market was valued at $6.51 billion in 2025.
- The combined share of Refrigerators and Water Purifiers reached 50.1%, accounting for over half of the market.
- The top three categories, Refrigerators, Water Purifiers, and Microwave Ovens, together captured 66.4% of the market.
- Cooking appliances such as Microwave Ovens and Induction Stoves jointly held a 30.1% market share in 2025.
AI and IoT Kitchen Appliances Statistics
- The global smart kitchen appliance market is expected to reach $60.2 billion by 2030.
- Smart kitchen appliances are forecast to grow at a 17.9% CAGR through 2030.
- More than 30% of smart appliance owners actively use mobile applications to monitor or control appliances remotely.
- AI-powered cooking assistants have become a standard feature in many premium ovens launched since 2024.
- Smart refrigerators capable of inventory tracking represent one of the fastest-growing connected appliance categories.
- Approximately 70% of smart appliance buyers cite convenience as the primary reason for adoption.
- IoT-enabled appliances can reduce household energy usage by up to 15% through automated optimization.
- Voice-assistant compatibility is included in more than 50% of premium smart kitchen appliances released in 2025.
- The broader smart home appliance market is projected to surpass $166 billion by 2034.
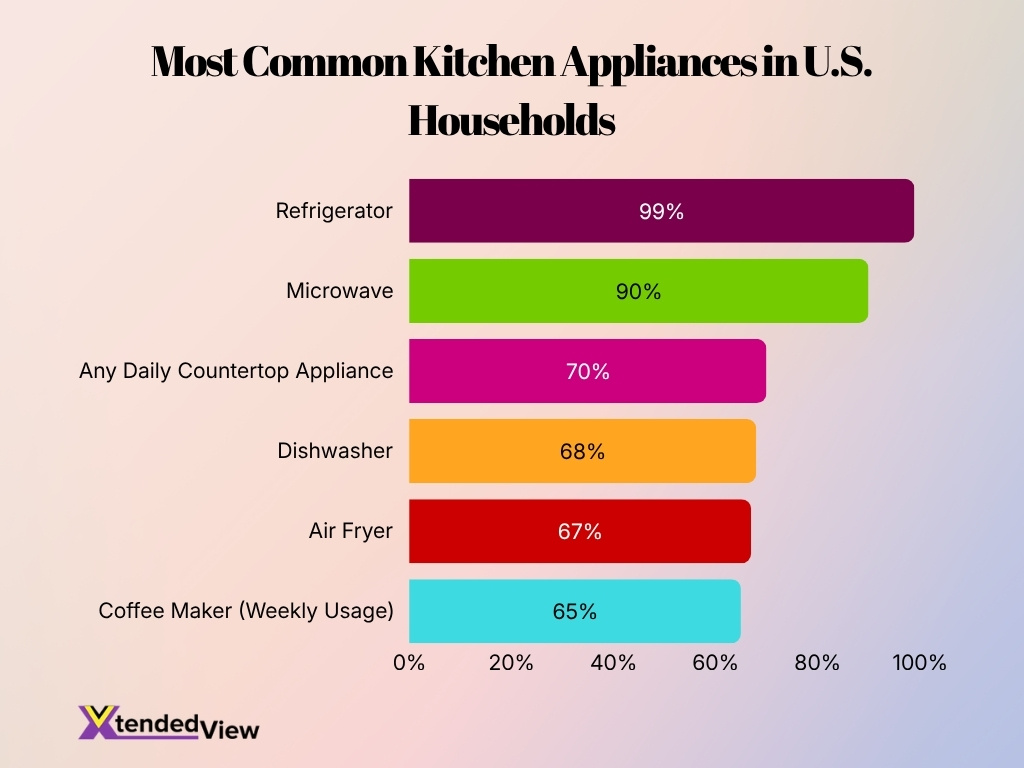
Kitchen Appliance Usage Statistics
- More than 99% of U.S. households own a refrigerator, making it one of the most widely used household appliances.
- Microwave ownership exceeds 90% of American households.
- Dishwashers are present in approximately 68% of U.S. homes.
- Coffee makers are used in more than 65% of households every week.
- Air fryer ownership reached approximately 67% of U.S. households in 2025.
- More than 70% of households use at least one countertop appliance daily.
- Refrigerators operate continuously and account for roughly 13% of household electricity consumption related to appliances.
- Consumers use microwave ovens an average of five or more times per week in most households.
- Smart appliance users interact with connected features at least once weekly in nearly 60% of connected homes.
Sustainability and Eco-Friendly Kitchen Appliances Statistics
- More than 60% of consumers prefer products that offer lower environmental impact and reduced energy consumption.
- Appliance manufacturers increased recycled-material usage in new products by an estimated 15% to 20% over the past five years.
- Energy-efficient appliances can lower household carbon emissions by hundreds of pounds annually, depending on appliance type.
- Refrigerators manufactured today consume approximately 75% less energy than comparable models produced in the 1970s.
- Water-efficient dishwashers use as little as 3 gallons per cycle, compared with significantly higher levels in older models.
- Sustainable packaging initiatives expanded across major appliance manufacturers throughout 2025.
- Circular economy programs involving appliance recycling and refurbishment increased participation rates across North America and Europe.
- Consumers under age 40 are significantly more likely to prioritize sustainability when purchasing appliances compared with older demographics.
- Environmental certifications influence purchasing decisions for approximately 40% of appliance shoppers.
Frequently Asked Questions (FAQs)
The global kitchen appliances market is valued at $287.66 billion in 2026 and is projected to reach $502.07 billion by 2034, growing at a 7.21% CAGR.
The global smart kitchen appliances market is expected to reach $60.20 billion by 2030, up from $22.36 billion in 2024, at a 17.9% CAGR.
Residential consumers accounted for 74.5% of the total kitchen appliance market demand in 2025.
The large kitchen appliances segment generated approximately $98.5 billion in revenue in 2025 and is forecast to grow at a 4.8% CAGR through 2035.
The top manufacturers, including Haier, Midea, BSH, LG Electronics, and Samsung, collectively held about 45% of the global kitchen appliance market share in 2025.
Conclusion
The kitchen appliances industry continues to expand as consumers prioritize convenience, efficiency, connectivity, and sustainability. Market growth reflects strong demand for smart refrigerators, AI-powered cooking devices, air fryers, premium coffee makers, and energy-efficient appliances. At the same time, online shopping channels are reshaping how consumers research and purchase products, while manufacturers invest heavily in IoT integration and eco-friendly innovations.
Looking ahead, the combination of connected technologies, energy optimization, and changing consumer lifestyles is expected to drive the next phase of industry growth. Companies that balance performance, sustainability, and smart functionality will likely capture the greatest share of future demand.