
The mobile‑app sector continues to reshape how businesses engage with consumers and how people access services. From enterprise‑level productivity tools that streamline workflows to gaming apps monetising billions, the industry is demonstrating a broad impact. For example, a global retailer deployed a mobile commerce app that increased checkout conversions by 25% within six months; likewise, a fitness startup used a mobile health app to double monthly subscriptions in a single year.
Editor’s Choice
- Global mobile‑app industry revenue for 2024 reached around $530‑540 billion, with estimates of ≈ $585 billion in 2025.
- In Q1 2025, in-app purchase(IAP) revenue across iOS and Google Play hit $40 billion, an 11% year‑over‑year increase.
- Global app downloads in 2024 were approximately 137.8 billion (apps + games) and projected to rise in 2025.
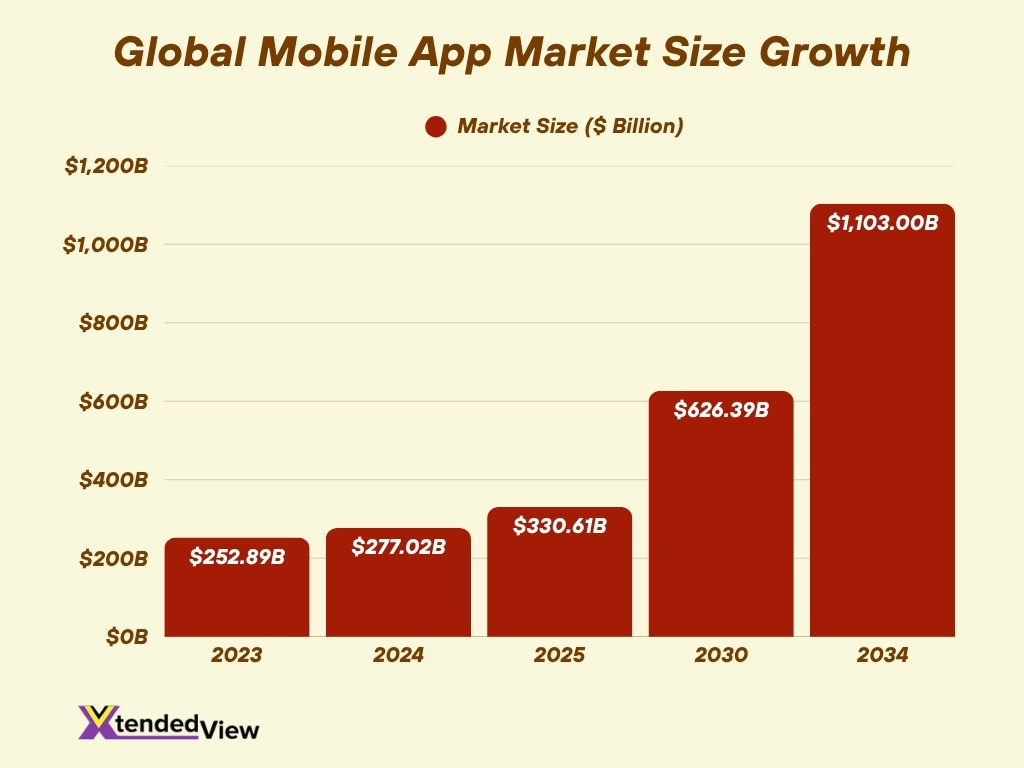
- The global mobile‑application market size in 2025 is estimated at $330.61 billion, with a forecast to exceed $1 trillion by 2034.
- In 2024, the Apple App Store generated $103.4 billion in revenue, while the Google Play Store generated $46.7 billion.
- Free apps dominate: one source shows 98% of mobile‑app revenue comes via free apps (monetised via in‑app purchases or ads).
- The average smartphone user has about 40 apps installed, uses 9–10 apps daily, and 30 apps monthly.
Recent Developments
- In Q1 2025, app‑store IAP revenue reached a record $40 billion, showing that the consumer spend on apps continues to grow strongly.
- A shift toward AI‑powered mobile apps is already visible, with generative-AI-enabled apps gaining download traction.
- Growth in health & fitness apps: in 2024, global in‑app purchase revenue rose 14.1%, and downloads rose 6.2% in that segment.
- The total number of app downloads globally is projected to exceed 300 billion by 2025.
- The mobile application development platform market is valued at $243.55 billion in 2025, signalling elevated investment in infrastructure.
- Smartphone and network advances (5G, edge computing) are driving more complex app experiences and thus higher‑value apps.
- Emerging markets continue to gain prominence: the Asia‑Pacific region is expected to generate the highest demand for mobile apps through the forecast period.
- The retail behaviour of consumers continues migrating to mobile: 70% of all US digital‑media time now comes from mobile apps, per one 2025 forecast.
Global Mobile App Market Overview
- The global mobile application market size is estimated at USD 252.89 billion in 2023 and is projected to reach USD 626.39 billion by 2030, CAGR ~14.3%.
- Another source projects the market at USD 330.61 billion in 2025, with a potential to exceed USD 1,103 billion by 2034.
- The market size, according to a different study, grows from USD 277.02 billion in 2024 to USD 313.88 billion in 2025, CAGR ~13.3%.
- The U.S. mobile‑app market is projected to grow at a CAGR of ~14.1% from 2024 to 2030.
- By region, Asia‑Pacific held over 32% of the revenue share in 2023 and remains the fastest‑growing market.
- The Apple Store segment accounted for over 62.8% of global revenue share in 2023.
- The gaming‑application segment held the largest revenue share, over 40% of the total market in 2023.
- The full value chain (apps + games + in‑app commerce + advertising) is increasingly interlinked, one analysis projects ~$2.2 trillion revenue generation from 2021 to 2030 across apps.
Mobile App Downloads Statistics
- In 2024, there were 137.8 billion apps and games downloaded globally.
- Of those, 91.3 billion were apps and 46.9 billion were games.
- For 2024, Google Play Store downloads reached 102.4 billion, while the Apple App Store had 35.4 billion.
- Global downloads in 2025 are projected to reach 300+ billion.
- The average smartphone user has 40 apps installed, uses 9‑10 apps daily, and 30 monthly.
- Free apps account for an estimated 98% of mobile‑app revenue.
- Q1 2024 downloads were steady at around 21.2 billion, similar to prior quarters.
- Emerging markets (e.g., India, Brazil) lead overall country‑wise download volume.
Global Mobile App Market Revenue Growth
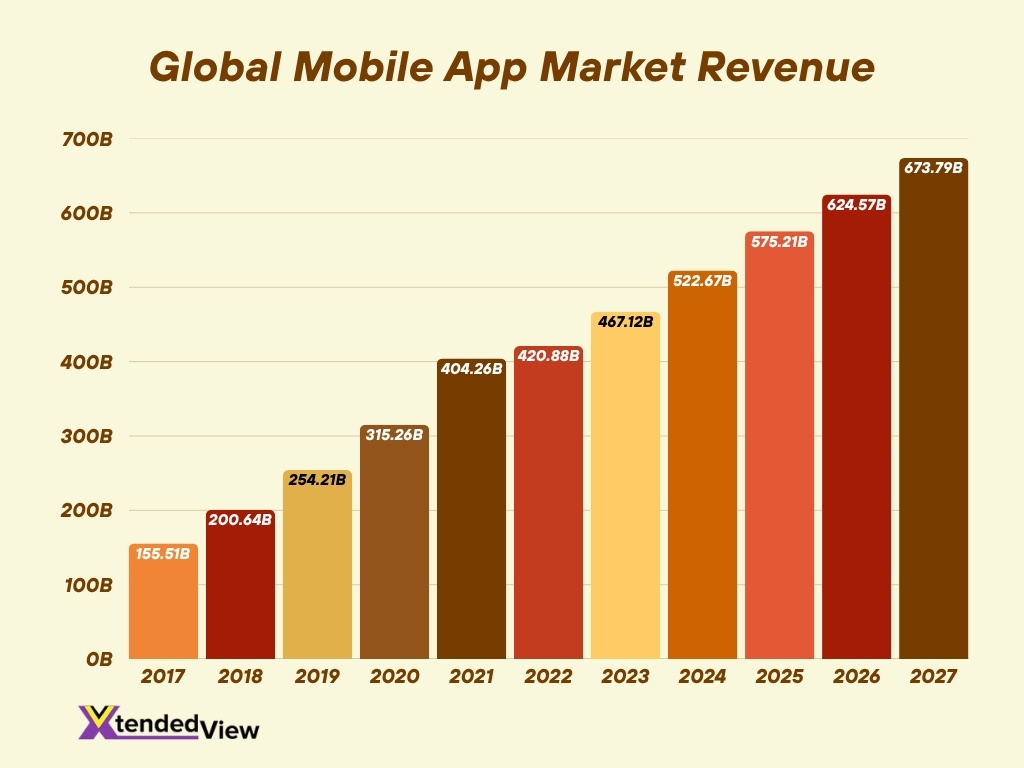
- The global mobile app market revenue shows a powerful upward trend, growing from $155.51 billion in 2017 to $673.79 billion in 2027.
- This represents a more than fourfold increase in just 10 years, highlighting the rapid expansion of the mobile economy.
- 2017–2020: Early-stage growth phase, revenue rose from $155.51 billion to $315.26 billion, driven by the rise of smartphones, app stores, and mobile gaming.
- 2021–2024: Acceleration period, revenue jumps from $404.26 billion to $522.67 billion, boosted by subscription models, streaming services, and social media engagement.
- 2025–2027: Mature expansion phase, the market is projected to hit $673.79 billion by 2027, maintaining a strong CAGR of 15–16%.
- Gaming apps remain the largest revenue segment, dominating overall app store spending.
- Rapid growth is also seen in entertainment, social networking, photo & video, and health & fitness categories.
- The surge reflects global shifts toward mobile-first lifestyles, 5G adoption, AI-powered apps, and in-app monetisation models.
- Overall, the data underscores how mobile apps have become a cornerstone of the global digital economy, spanning both consumer and enterprise sectors.
Mobile App Usage & Engagement Statistics
- Global mobile users spent approximately 4.2 trillion hours engaging with apps in 2024.
- On average, people spent around 4 h 37 m per day on their smartphones in 2025.
- Over 49% of users reported opening an app 11 or more times per day.
- Only about 16% of active users access any given app daily.
- Session length: social networking apps average 44 minutes per day.
- Average session duration continues to rise modestly.
- The DAU/MAU ratio is emerging as a key “stickiness” metric for app‑makers in 2025.
- Engagement remains challenging in mature markets.
App Store Comparison: iOS vs Android
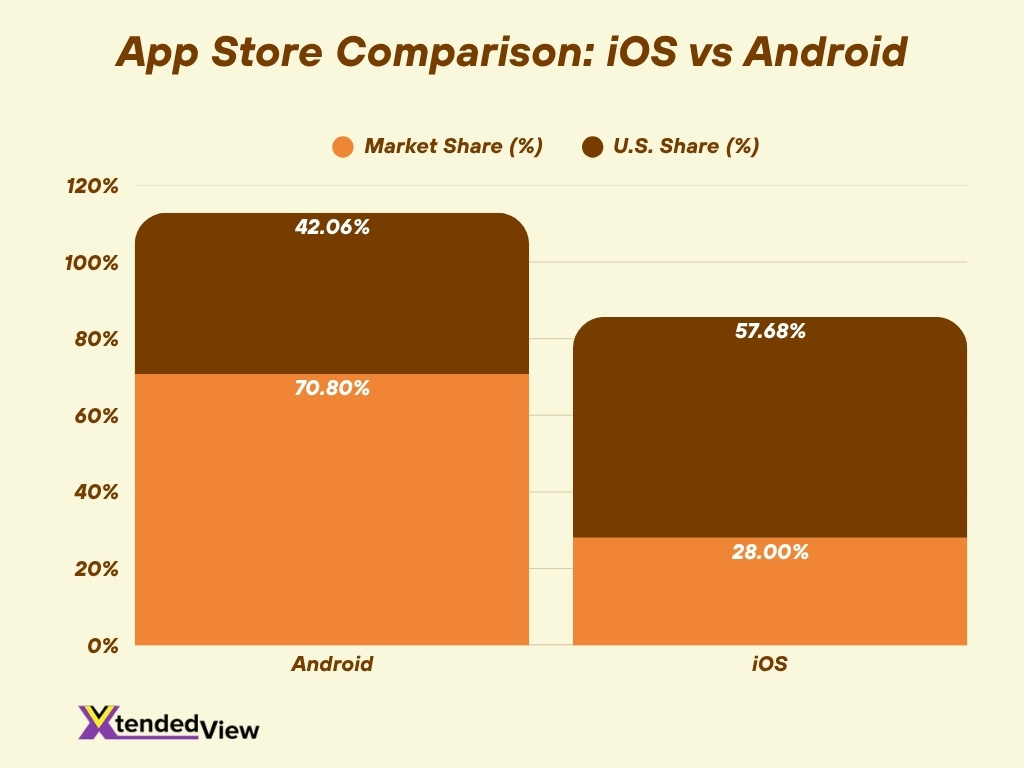
- Android holds approximately 70.8‑72% of the mobile OS market in 2025, while iOS holds about 28‑29.2%.
- In the U.S., iOS has a higher share: about 57.68% vs Android’s ~42.06%.
- Together, they control over 95% of the global app‑store market share.
- Google Play had around 1.58 million active apps in September 2025.
- iOS users spend a higher average per app (~$12.77) vs Android users (~$6.19).
- iOS consumer spending in 2025 was ~$89.3 billion vs Google Play’s ~$40 billion.
- ~1,458 Android apps and ~1,710 iOS apps were published in one 24‑hour period.
- iOS tends to have stricter app‑review guidelines.
User Demographics & Behaviour
- iPhone users earn a ~43.7% higher average salary than Android users.
- Millennials and Gen Z are more likely to use iOS devices.
- Users install 30 apps per month and use about 9–10 apps per day.
- Approximately 98% of mobile‑app revenue comes from free apps.
- There were over 8.66 billion mobile subscriptions globally in 2025.
- 63% of consumers globally used mobile devices to access the internet.
- Users check their phones 58 times per day, ~30 during work hours.
- ~92% of mobile screen time is spent within apps.
Mobile App Retention & Abandonment Rates
- Day‑1 retention for Android apps is ~21.1%, and ~23.9% on iOS.
- 25% of users abandon an app after a single use.
- Day‑7 retention averages ~10.7%.
- Day‑30 shopping app retention is about 5.6%.
- Approximately 71% of users have churned within three months.
- Social‑media apps may have Day‑30 retention as low as 1.37%.
- Poor experience drives ~75% of users to abandon in the first week.
- Downloads alone do not equate to long‑term engagement.
Industry‑Specific App Statistics (Gaming, Finance, Health, etc.)
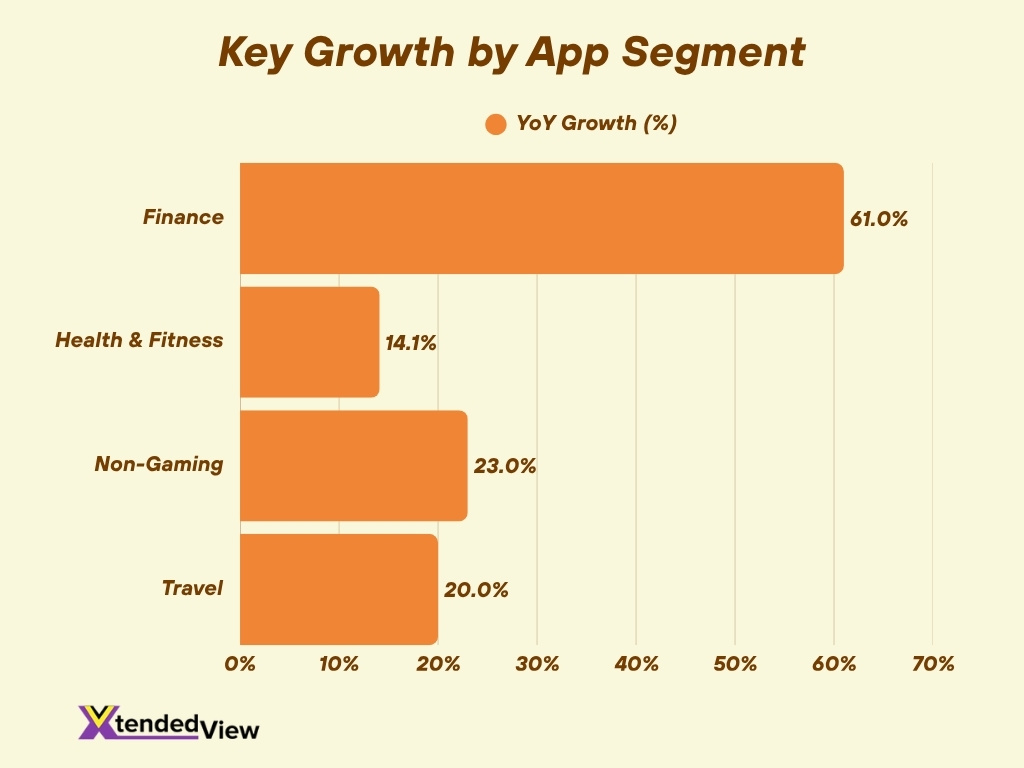
- Finance apps saw a 61% year‑over‑year surge in 2025.
- Health & fitness in‑app purchase revenue grew 14.1% in 2024.
- Gaming accounted for 56% of total downloads in the mobile‑app industry.
- Non‑gaming apps drove revenue growth of +23% year‑over‑year.
- Mobile gaming apps lose ~94% of new players within one month.
- Travel apps saw ~20% growth in 2025.
- Users expect data syncing across apps and wearables.
- Subscription models are growing in productivity and wellness apps.
Mobile App Monetisation Trends
- In‑app advertising spend is projected to reach $390 billion by 2025.
- Free apps account for roughly 98% of all mobile app revenue.
- 82% of non‑gaming apps use subscription models.
- The top 5% of apps make over 400× more revenue than the bottom 25%.
- Behaviour-based ads are replacing user‑targeted ads.
- IAP models expand beyond gaming to wellness and finance.
- Hybrid monetisation models are now the norm.
- Developers focus on ad creative testing and lifetime value.
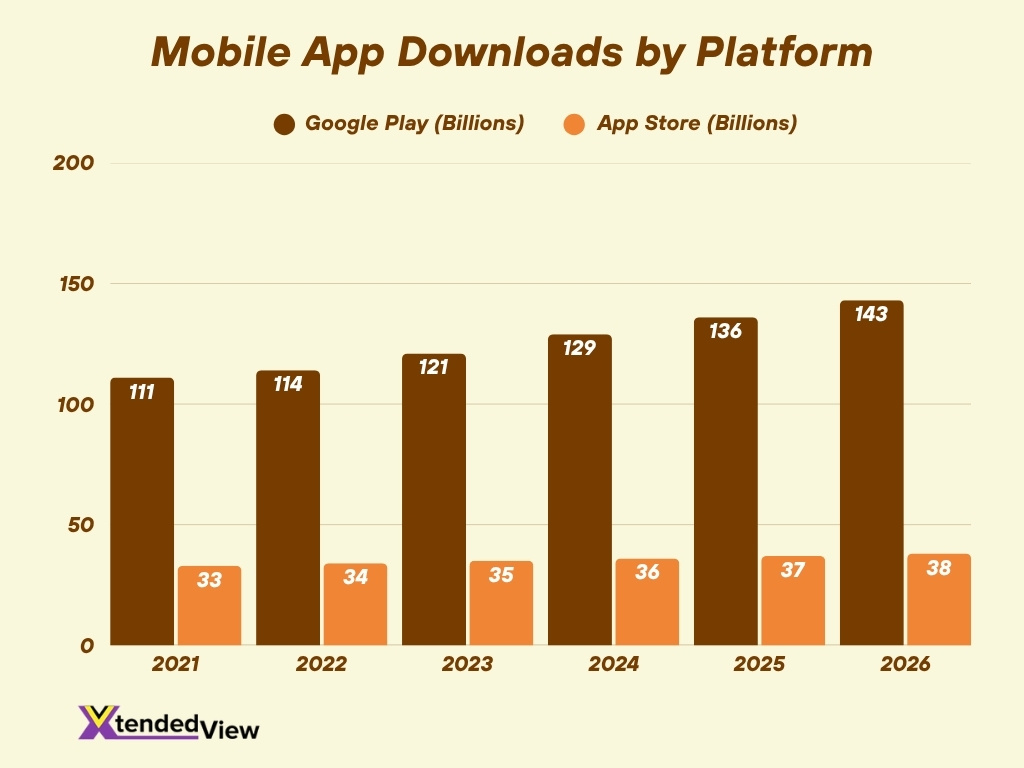
Global Mobile App Downloads by Platform
- The total number of global mobile app downloads is expected to grow from 144 billion in 2021 to 181 billion by 2026.
- Google Play leads the market consistently, with downloads increasing from 111 billion in 2021 to 143 billion in 2026.
- Apple’s App Store also shows steady growth, rising from 33 billion downloads in 2021 to 38 billion by 2026.
- This reflects a 4.6% average annual growth rate, showing the continued expansion of the global app ecosystem.
- Despite slower growth, App Store downloads represent higher revenue per user, underscoring the stronger monetisation potential of iOS users.
- Android’s dominance is driven by its widespread adoption in emerging markets, while Apple’s stability is maintained by its loyal user base and premium ecosystem.
- By 2026, Google Play will account for roughly 79% of total global app downloads, highlighting its massive global reach.
- The sustained increase across both platforms underscores a rising global dependence on mobile applications for entertainment, productivity, shopping, and communication.
- Overall, the data points to a robust, upward trend in mobile app engagement and the ever-expanding digital economy.
Mobile App Advertising & Marketing Statistics
- The mobile advertising market will exceed $228 billion in 2025.
- 82.3% of mobile ad spend will go to in‑app ads.
- 50% of app marketers increased acquisition budgets in 2025.
- 60% of marketers have seen audience shifts in the past 2 years.
- Automation, micro‑influencers, and personalisation are rising.
- In‑app ads have 150% higher conversion than mobile web ads.
- Paid installs increase organic install volume.
- SMS marketing in the U.S. is worth $12.6 billion by 2025.
Mobile App Development Trends
- The market is projected to grow from $269.5 billion in 2024 to $302 billion in 2025.
- Over 1.5 billion people used 5G by end‑2023.
- No‑code platforms are reducing time‑to‑market.
- AI/ML integration is now standard in many apps.
- Budgets increasingly focus on retention and performance.
- Modular SDKs support AR/VR and IoT features.
- Top challenges include performance monitoring (50%) and OS changes (44%).
- Developer demand is rising; outsourcing is common.
Regional & Country‑Wise Statistics
- Asia‑Pacific holds 33% of global app revenue; North America ~30%, Europe ~27%.
- U.S. consumer spend on in‑app purchases reached $52 billion.
- India and MENA saw over 55% app install growth YoY.
- The smartphone market in India is growing at a 6.9% CAGR.
- Latin America apps show ~$14 ARPMAU.
- Emerging markets now lead global download growth.
- Localized monetization and payment models are key.
- Regional regulations are reshaping privacy and app-store rules.
Impact of Emerging Technologies (AI, AR/VR) on Apps
- AI chatbot apps saw 112% YoY growth in 2025.
- AR/VR use cases include gaming, retail, and training.
- AI/ML supports onboarding and predictive analytics.
- AI tools lower development barriers for small teams.
- 5G powers real-time and immersive experiences.
- Apps are integrating with IoT, wearables, and the metaverse.
- AI helps with threat detection in mobile security.
- ROI is now measured by AI-driven outcomes.
App Security & Privacy Statistics
- The mobile security market is expected to grow from $8.1 billion to $9.78 billion in 2025.
- Cyber‑attacks on mobile apps rose 80% YoY.
- 82.78% of iOS apps track user data; 31.73% link it to identity.
- The average breach cost is $6.99 million.
- Mobile phishing (“mishing”) makes up one‑third of threats.
- 79% of the global population is covered by data/privacy laws.
- App stores add verified badges to increase transparency.
- Security, monetisation, and analytics now intersect as strategic risks.
Future Forecasts & Market Projections
- The mobile‑app market will exceed $1 trillion by 2034.
- iOS & Android store revenue to grow at ~19.5% CAGR by end‑2025.
- Mobile ad spend to grow 14.3% CAGR through 2029.
- The app development tools market will hit ~$750 billion by 2033.
- Smartphone subscriptions to reach 9.4 billion by 2030.
- AR/VR and AI apps will drive double-digit sector growth.
- Monetisation focus shifts from installs to lifetime value.
- Security and compliance costs will grow with user expectations.
Frequently Asked Questions (FAQs)
Around 299 billion downloads are projected globally in 2025, up from 257 billion in 2023.
Consumer spending on mobile apps reached $40 billion in Q1 2025, marking an 11 % year‑over‑year increase.
The global mobile application market size is estimated at USD $330.61 billion in 2025, with a forecast to reach USD $1,103.48 billion by 2034 (CAGR ~14.33 %).
In 2024, of the ~137.8 billion apps and games downloaded, 46.9 billion were games and 91.3 billion were non‑games.
Approximately 98% of mobile app revenue worldwide comes from free apps monetised through in‑app purchases or advertising.
Conclusion
The mobile app industry stands at a pivotal moment. With billions of downloads, hundreds of billions in revenue, and rapidly evolving monetisation models, the ecosystem is thriving, but also becoming more complex. Developers, marketers, and businesses must balance growth strategies with increasing demands for engagement, security, and privacy.
Whether you’re targeting the U.S. market, tapping emerging economies, or strengthening retention, the numbers show both opportunity and challenge. Dive into the sections above for a detailed breakdown of the trends shaping the future of mobile apps.