
The Internet of Things (IoT) continues to reshape how we live, work, and interact with the world. From smart home ecosystems that automate everyday tasks to industrial networks optimizing entire supply chains, the impact of connected devices is both broad and deep. In sectors like healthcare and agriculture, IoT technologies are driving breakthroughs in efficiency, safety, and real-time decision-making. This report dives into the latest IoT statistics, offering a data-rich look at adoption, growth, and emerging trends across industries and regions. Let’s explore the numbers that are defining the future of connectivity.
Editor’s Choice
- The number of connected IoT devices is projected to reach 17.08 billion globally in 2025.
- The global IoT market is estimated to hit $1.39 trillion by the end of 2025.
- Consumer IoT devices account for approximately 58% of total IoT deployments in 2025.
- Industrial IoT (IIoT) now generates over 70% of all IoT data despite fewer device units.
- The healthcare IoT market is projected to reach $243.4 billion in 2025.
- Smart cities are expected to account for 30% of all connected devices by 2030.
- 60% of all IoT breaches in 2025 are due to unpatched firmware or outdated software.
Recent Developments
- IoT-related venture capital funding exceeded $26 billion globally in 2024, setting a record for the sector.
- Over 68% of enterprises globally plan to increase IoT investments in 2025.
- By Q1 2025, over 21.5 million potentially malicious objects were detected in IoT-connected systems.
- The rollout of Wi-Fi 6E and Wi-Fi 7 is boosting data speeds and efficiency across IoT networks in consumer and enterprise spaces.
- IoT adoption is expanding rapidly in edge-computing environments, with a 44% increase in edge data centers in 2025.
- Integration of IoT with AI is powering smarter systems in healthcare, manufacturing, and retail.
- LPWAN technologies like LoRaWAN and NB-IoT are becoming the default in rural and agricultural deployments.
- Smart infrastructure initiatives under government stimulus packages are accelerating IoT growth in smart cities.
Global IoT Market Size and Growth Trends
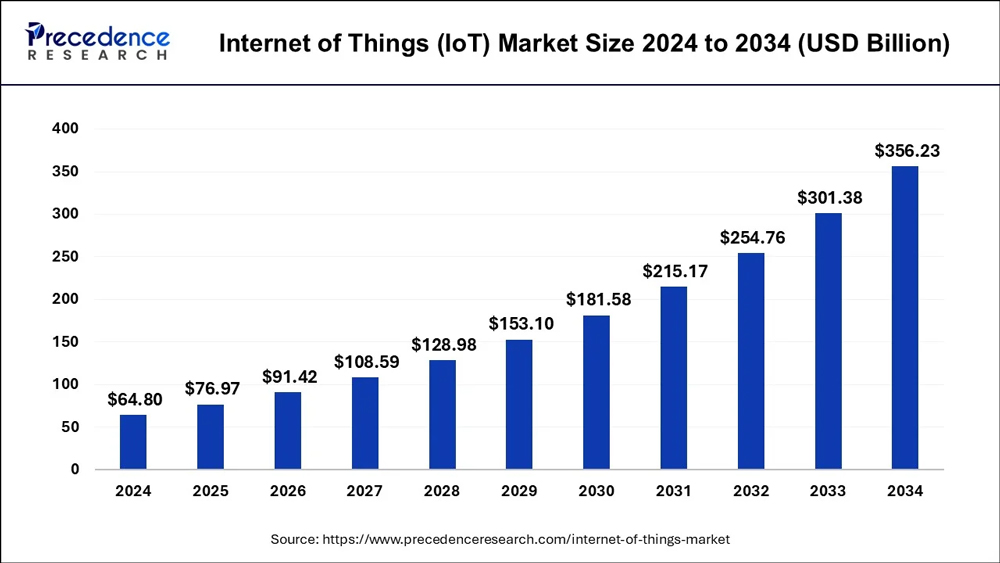
- The IoT market is projected to experience consistent growth from 2024 to 2034, reflecting expanding adoption across industries.
- In 2024, the market size is estimated at $64.60 billion.
- By 2025, it will increase to $78.97 billion, marking a steady upward trajectory.
- Growth continues through 2026 ($91.42B) and 2027 ($108.59B).
- The market is expected to surpass the $100 billion mark by 2027.
- By 2028, it is forecasted to reach $128.95 billion, driven by increased connectivity and smart device integration.
- The mid-decade milestone (2030) projects a market size of $161.58 billion.
- Substantial expansion occurs from 2031 ($215.17B) to 2032 ($264.78B), indicating accelerated adoption in manufacturing, healthcare, and smart cities.
- By 2033, the market could reach $307.38 billion.
- Finally, by 2034, the IoT market is expected to grow to $359.23 billion, reflecting a compound annual growth rate (CAGR) of approximately 18–20% over the decade.
Number of Connected IoT Devices Worldwide
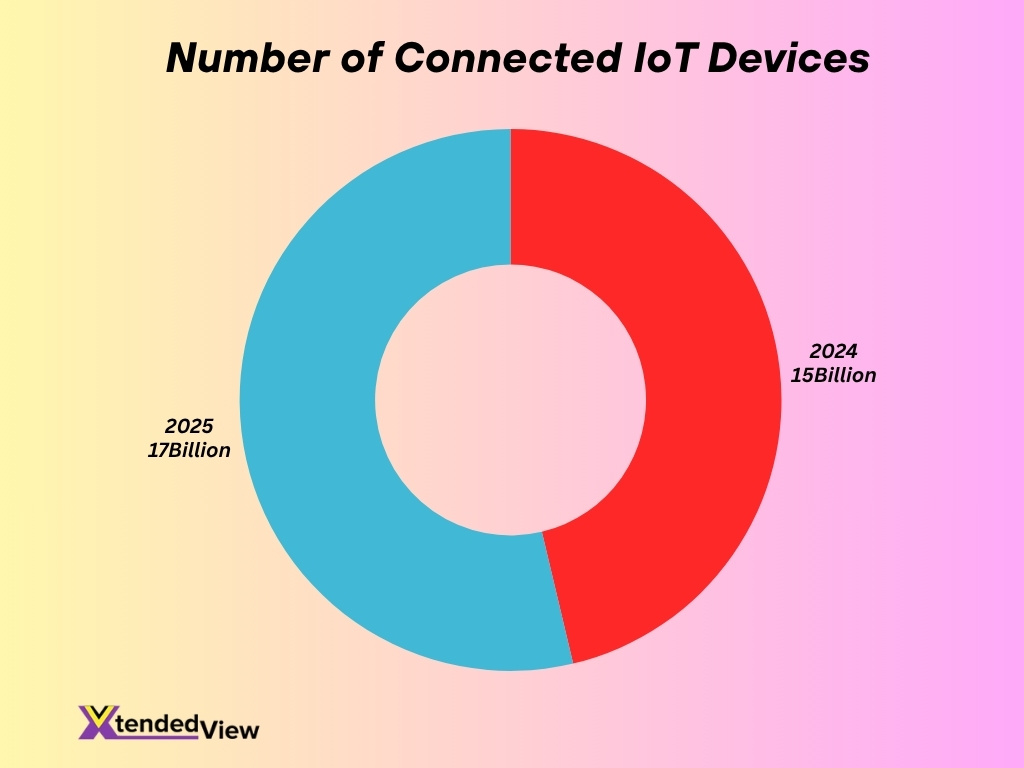
- In 2025, there are an estimated 17.08 billion connected IoT devices globally.
- This represents a 16% increase from 14.72 billion devices in 2024.
- The average household in the U.S. now has 22 connected devices, up from 14 in 2022.
- Industrial IoT devices now account for 42% of total global device volume.
- Connected car devices are projected to exceed 410 million globally in 2025.
- Wearable devices account for 1.4 billion units in 2025.
- Smart home devices like thermostats, lights, and cameras reached 1.9 billion globally in 2025.
- Agricultural IoT installations are expected to surpass 75 million units by the end of 2025.
- Utilities and smart grid deployments added 480 million new devices in 2025 alone.
- Consumer device growth is strongest in Asia-Pacific and Latin America.
Industry-Wise IoT Adoption
- Manufacturing, healthcare, transportation, and utilities are the top four verticals for IoT deployment.
- Manufacturing alone represents 25% of global IoT investment in 2025.
- The healthcare sector’s IoT adoption rate exceeded 87% by early 2025.
- Retail IoT adoption has grown by 41% year-over-year, with a heavy focus on supply chain tracking.
- Smart agriculture saw a 35% increase in connected solutions among large farms.
- Utility companies use IoT for grid monitoring, energy usage forecasting, and outage detection.
- Transportation systems adopted IoT to improve route optimization and reduce fuel consumption.
- Hospitality and tourism are using IoT to enhance customer experience via automation.
- Education sectors report a 22% increase in IoT-enabled devices on campuses.
- Energy companies are implementing IoT solutions for oil rig monitoring and energy efficiency.
IoT in Smart Homes: Penetration and Usage Rates
- Over 63% of U.S. homes had at least one IoT-enabled smart home device in 2025.
- Smart speakers like Amazon Echo or Google Nest are present in 55% of homes.
- Smart thermostats saw a 12% increase in installation year-over-year in North America.
- The smart lighting segment is expected to surpass $28 billion globally by 2025.
- Connected security systems are used in 47% of smart homes in the U.S.
- Home automation systems can lower energy bills by up to 30% through usage optimization.
- 71% of smart home device owners say the tech improves quality of life.
- Voice assistants integrated with IoT devices handle an average of 12 commands daily per household.
- Smart kitchen appliances grew by 38% year-over-year due to convenience and health tracking.
- Data privacy remains a concern, with 43% of users disabling at least one data-sharing feature.
IoT in Healthcare: Market and Device Statistics
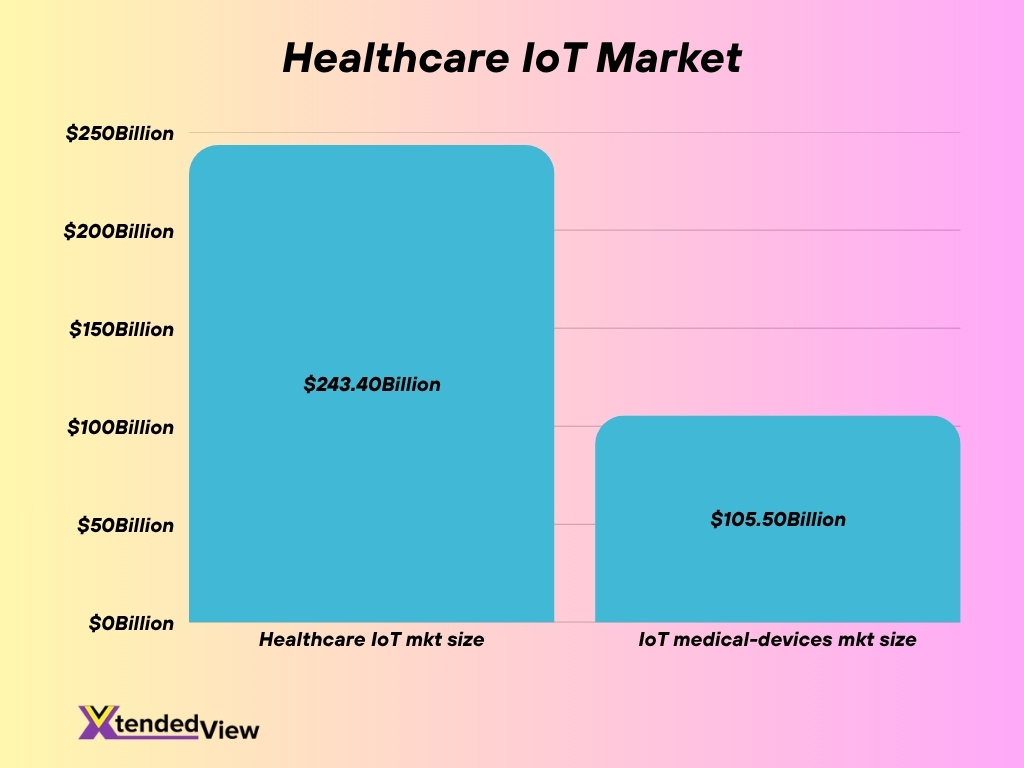
- The global IoT in healthcare market is projected to be worth $243.4 billion in 2025.
- One source estimates growth from $231.7 billion in 2024 to $282 billion in 2025.
- IoT adoption by healthcare organisations is expected to reach 87% by 2025.
- Use of IoT-enabled remote patient monitoring has reduced hospital readmissions by roughly 45%.
- IoT-based medication-management systems have improved adherence rates by 30%.
- The global IoT medical-devices market is forecast to grow from $105.5 billion in 2025 to $971.3 billion by 2034.
- Wearables dominate growth in IoT medical devices, while elderly care shows the fastest CAGR.
- North America held over 36% share of the IoT medical devices market in 2024.
- The expansion is driven by chronic-disease growth, digital health investments, and better internet access.
IoT in Manufacturing and Industrial Automation
- The industrial IoT (IIoT) segment shows Asia-Pacific growth at a CAGR of over 26% from 2024–2030.
- By 2025, the number of IIoT devices per industrial establishment in North America is expected to reach 365.
- The industrial automation market is projected at $226.8 billion in 2025.
- Global IIoT deployments have increased productivity and reduced downtime.
- Asia-Pacific is expected to account for 58% of IIoT-generated data in 2025.
- Europe is projected to capture 23% of global IIoT-generated data in 2025.
- Talent acquisition is a key obstacle, cited by 600 manufacturers in a recent survey.
- Hardware remains the largest share of industrial IoT spend.
- Asset-performance management is shifting from pilot to scale-up phase.
IoT in Transportation and Automotive
- The global IoT in transportation market is estimated at $344.14 billion in 2025.
- Connected vehicle telematics and fleet management are primary growth drivers.
- Autonomous mobility and V2X communication are increasing IoT demand in automotive.
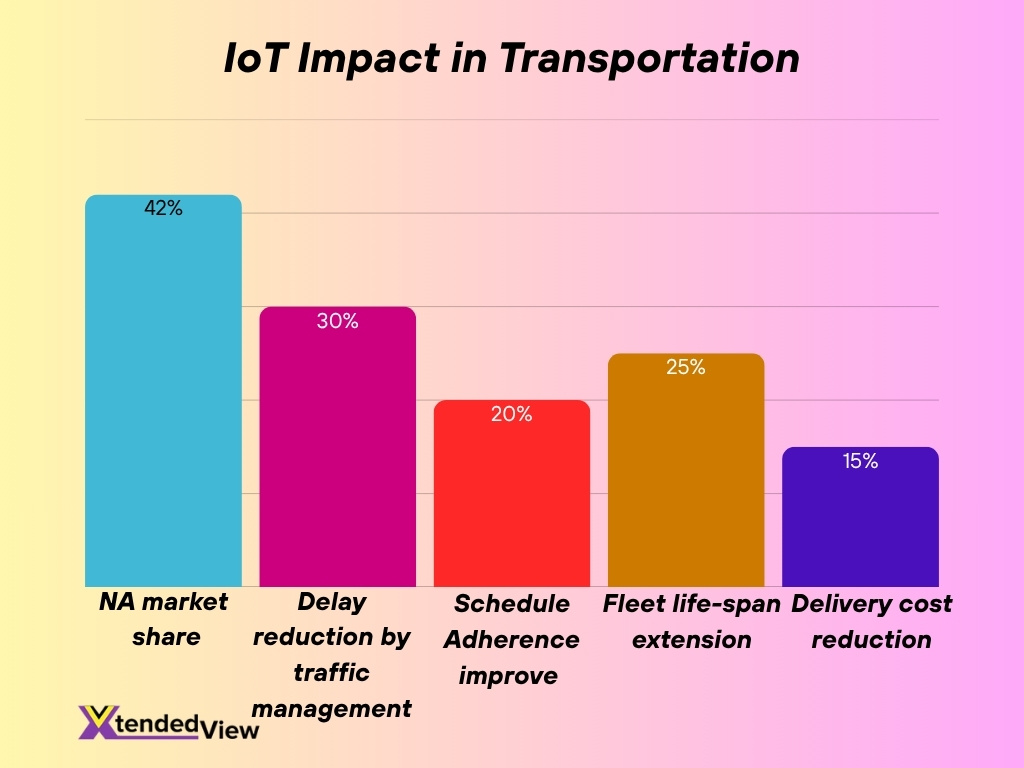
- North America holds over 42% of the global IoT-transportation market share.
- IoT-based traffic management solutions have reduced delays by 30% in pilot programs.
- Hardware like vehicle sensors and connectivity modules dominate implementation.
- IoT-enabled public transit systems improve schedule adherence by 20%.
- Predictive maintenance using IoT has extended fleet life spans by 25%.
- Smart logistics with real-time tracking has cut delivery costs by 15%.
IoT in Agriculture and Precision Farming
- The global IoT-in-agriculture market is projected at $16.22 billion in 2025.
- Over 75 million IoT devices will be used in precision farming by 2025.
- IoT systems have improved crop yield by 20% through real-time monitoring.
- Water usage has dropped 30% in farms using smart irrigation systems.
- IoT animal-tracking devices are used in 45% of large-scale livestock operations.
- Soil sensors are adopted by 65% of precision farms in North America.
- Drone integration with IoT systems is expected to reach 40% usage in large farms.
- IoT weather stations provide hyper-local forecasting for pesticide timing and watering.
- The global precision farming market is growing at 11.5% CAGR from 2025 to 2034.
- Asia-Pacific and North America lead IoT-agriculture adoption.
IoT in Energy and Utilities
- The IoT in utilities market is estimated at $43.5 billion in 2025.
- Platform-based solutions dominate, with 41.8% market share.
- Asset-monitoring accounts for 32.4% of utility IoT use cases.
- Utilities use IoT for predictive maintenance and energy-usage optimization.
- IoT solutions have cut operational costs by up to 18% in some utility firms.
- Grid resiliency improved by 22% with real-time fault detection systems.
- IoT has facilitated 24/7 monitoring of renewable energy generation.
- The rollout of smart meters has exceeded 1.3 billion units globally.
- Regulations on emissions and efficiency are accelerating IoT deployments.
IoT Applications in Smart Cities
- The global smart-cities market is projected to reach $942.74 billion in 2025.
- IoT applications in cities include smart lighting, waste management, and water systems.
- Over 60% of urban leaders say real-time data has reshaped city operations.
- Smart-city IoT is expected to represent 30% of connected devices by 2030.
- IoT-driven infrastructure has cut energy usage in cities by up to 17%.
- Public safety systems using IoT have reduced emergency response time by 12%.
- U.S. infrastructure programs are accelerating urban IoT deployments.
- Asia-Pacific urbanisation is the fastest-growing segment for smart cities.
- Digital twins and edge computing are major tech trends in urban IoT.
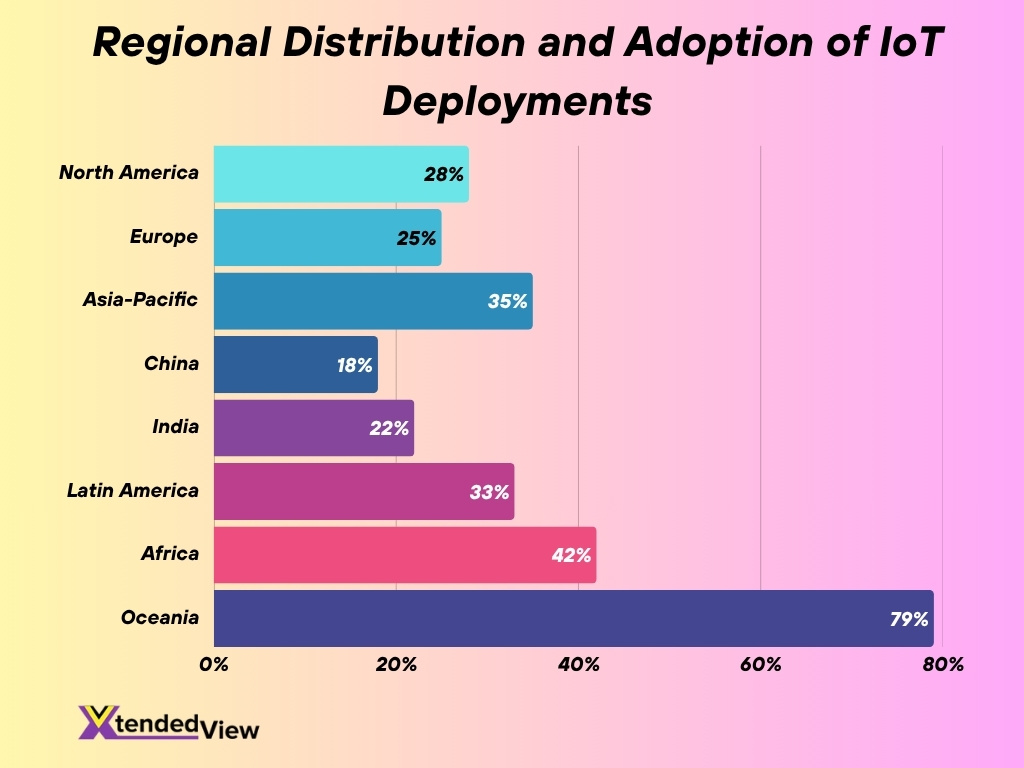
Regional Analysis of IoT Deployments
- North America accounts for 28% of global IoT deployments in 2025.
- Europe holds 25%, driven by sustainability-focused initiatives.
- Asia-Pacific leads with 35% share and the fastest growth rate.
- China contributes 18% of global IoT traffic due to industrial automation.
- India’s IoT adoption grew 22% year-over-year.
- Latin America achieved smart utility usage in 33% of urban centers.
- Africa’s mobile health and irrigation IoT grew 42% in key markets.
- Oceania integrated IoT into 79% of new construction projects.
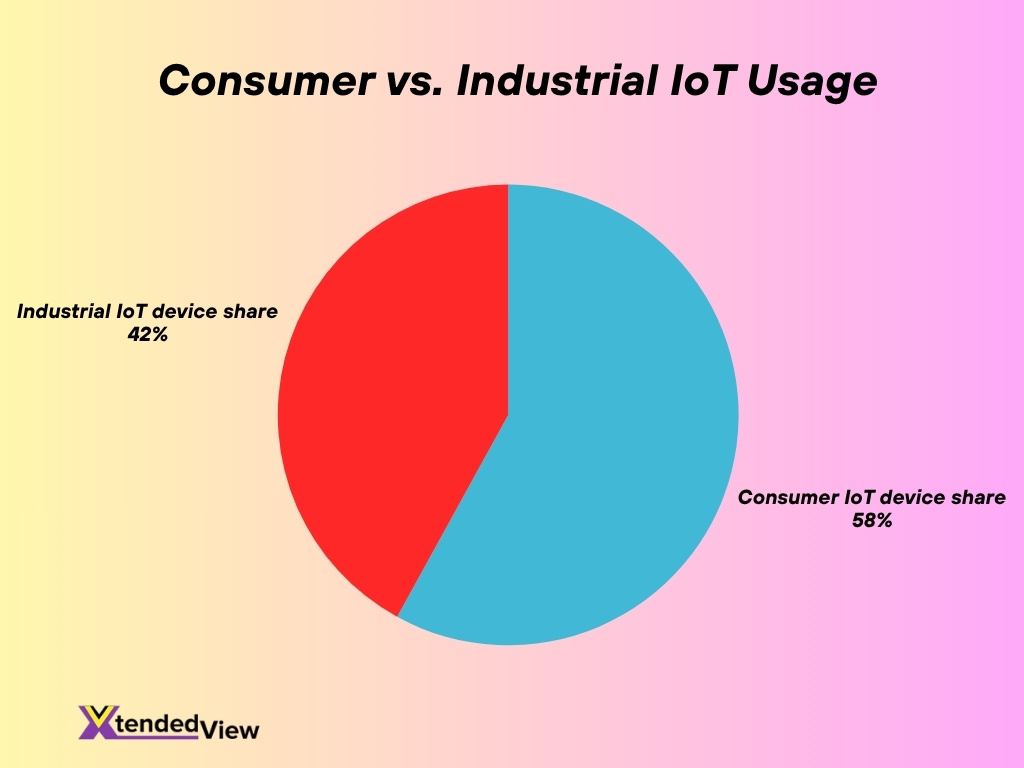
Consumer vs. Industrial IoT Usage
- Consumer IoT makes up 58% of devices; industrial IoT accounts for 42%.
- Industrial IoT generates over 70% of total data despite fewer devices.
- The average enterprise spends $2.3 million on IoT annually.
- Industrial use prioritizes automation and remote monitoring.
- Consumer IoT focuses on smart homes, wearables, and appliances.
- IIoT deployments are scaling up; consumer IoT adds new product lines.
- Security is a top barrier for 67% of enterprises in IIoT.
- Private networks dominate IIoT, while consumer IoT uses Wi-Fi and Bluetooth.
IoT Device Data Traffic and Network Usage
- IoT devices will generate over 300 zettabytes of data globally in 2025.
- Wi-Fi handles 32% of IoT connections; Bluetooth handles 24%.
- Average data generation per device is 4.2 GB/month.
- LPWAN is used in 58% of rural IoT deployments.
- IoT accounts for 19% of mobile network traffic in some regions.
- Edge computing facilities grew by 44% in response to IoT demand.
- Wi-Fi 6E and Wi-Fi 7 now power 52% of new IoT devices.
- 37% of enterprises monetize anonymized IoT data.
Most Popular Connectivity Protocols for IoT Devices
- Wi-Fi, Bluetooth, and Cellular account for 80% of connections.
- BLE dominates wearables and short-range devices.
- LoRaWAN and NB-IoT are used for low-power long-range applications.
- MQTT and CoAP are popular for lightweight data transmission.
- Ethernet is still used in industrial fixed IoT environments.
- Multi-protocol support is common in industrial IoT.
- Protocol selection depends on power, range, and latency requirements.
IoT Security and Privacy Statistics
- IoT cyberattacks rose by 124% year-over-year in 2024.
- 60% of breaches are due to outdated firmware or software.
- 1 in 5 IoT devices still uses a default password.
- The average breach cost in 2025 is $2.17 million.
- Zero-trust architecture adoption reached 38%.
- 71% of consumer IoT devices now default to encryption at rest.
- Over 21.5 million threats were detected in Q1 2025.
- Risk scores increased by 33% across devices.
- Industrial environments face the highest potential financial losses.
Environmental and Sustainability Impact of IoT
- IoT can increase emissions if not optimized for energy use.
- Sensor networks help reduce energy waste in utilities and transport.
- Smart cities save up to 17% in energy via IoT.
- Sustainable agriculture IoT adoption exceeds 70% in large farms.
- Green IoT practices include lifecycle extension and e-waste reduction.
- Digital systems, including IoT, represent 3.4% of global emissions.
- Policy frameworks are pushing IoT sustainability worldwide.
Leading IoT Vendors and Market Share
- The top 5 vendors account for 73% of global cellular IoT module shipments.
- U.S. IoT platforms have a 52.6% share in 2025.
- Chinese and Taiwanese firms are gaining ground in module shipments.
- Specialized vendors in edge AI and security are scaling fast.
- Partnerships are forming across chipsets, networks, and platforms.
- Vendors are being evaluated for ecosystem strength and cybersecurity.
- Cellular and LPWA device shipments are expected to hit 866 million by 2029.
Frequently Asked Questions (FAQs)
About 21.1 billion connected IoT devices are expected globally by the end of 2025.
The global IoT market is projected to reach approximately US$599.39 billion in 2025, growing at a CAGR of 15.0%.
There were around 4 billion cellular IoT connections at the end of 2024, with a forecasted CAGR of about 11% through 2030.
The IoT monetization market was valued at US $1.01 trillion in 2024, with a projected CAGR of 46.4% from 2025 to 2034.
The IoT devices market is estimated at US $83.33 billion in 2025, with a CAGR of 16.8% expected between 2025 and 2030.
Conclusion
The scale and diversity of the Internet of Things are unmistakable. From consumer wearables in millions of homes to industrial sensor networks driving billions in operational savings, the data and deployment footprints continue to expand. Yet this growth brings complexity, connectivity protocols, network traffic, security risks, sustainability implications, and vendor ecosystems, all of which demand careful navigation.
For organisations and consumers alike, understanding the key statistics highlighted here offers a clearer view of where opportunity lies and where caution is required. I invite you to explore the full article and dive deeper into each section to assess how these trends might affect your industry, strategy, and technology roadmap.