
The mobile application landscape continues its rapid evolution, with expanding user bases and shifting monetization strategies driving change across industries. From retail brands using mobile apps to streamline customer engagement and purchase to healthcare providers leveraging apps for remote patient monitoring, the real-world impact is clear.
Editor’s Choice
- The global mobile application market size is estimated at $289 billion in 2025.
- Worldwide mobile app downloads across major stores reached approximately 137.8 billion in 2024.
- Combined consumer spending on mobile apps crossed $150 billion in 2025.
- On average, users now spend around 3.5 hours per day within mobile apps.
- Free apps represent approximately 97–98 % of total app downloads globally.
- E-commerce app installs grew by about 17 % year-over-year in 2024.
- In 2024, installs for finance apps rose by 27 % YoY.
Recent Developments
- In 2024, e-commerce app installs increased by 17 % compared with 2023.
- Financial services mobile apps achieved a 27 % year-over-year increase in installs in 2024.
- Strategy games within mobile gaming saw an 83 % install growth in 2024.
- The mobile commerce segment is forecast to reach around US $2.5 trillion in revenue by 2025, up 21 % YoY.
- Nearly 90 % of smartphone screen time is now spent in mobile apps rather than web browsers.
- The number of smartphone users globally is projected to exceed 6.9 billion by 2025.
- Growth of 5G mobile data traffic reached about 35 % of global mobile data in 2024.
- Developers increasingly rely on AI-powered mobile apps, recording double-digit growth in adoption.
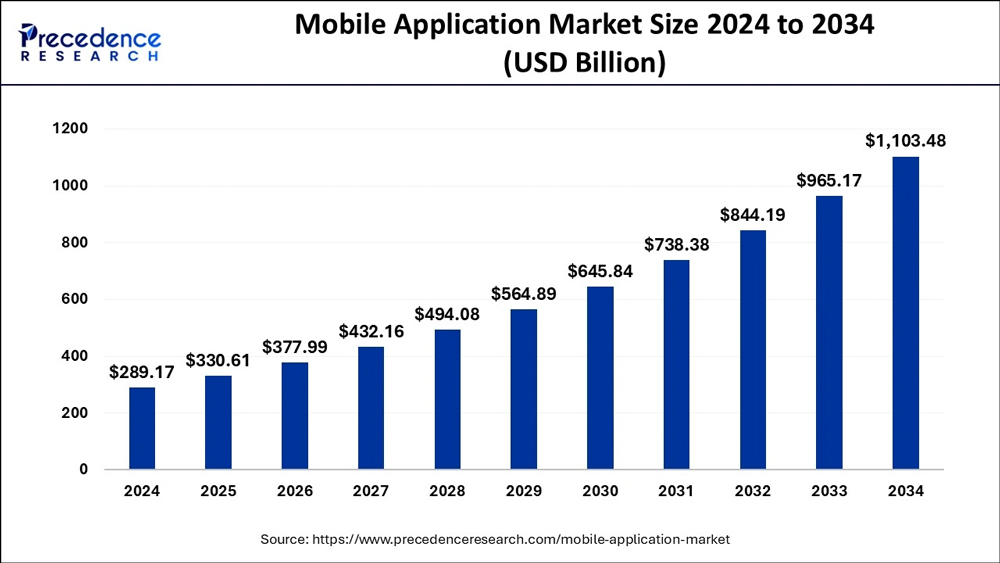
Mobile Application Market Growth
- The global mobile application market is projected to experience strong, consistent growth from 2024 to 2034.
- In 2024, the market size stands at $289.17 billion.
- By 2034, it is expected to reach $1,103.48 billion, marking a nearly fourfold increase over the decade.
- The compound annual growth rate (CAGR) implied by this data suggests rapid expansion driven by continued smartphone adoption, app monetization models, and digital transformation.
- Milestone years and projections:
- 2025: $330.61 billion
- 2027: $432.16 billion
- 2030: $645.84 billion
- 2033: $965.17 billion
- The biggest surge occurs between 2030 and 2034, when the market grows by $457.64 billion, reflecting accelerating investment and innovation.
- This trajectory highlights the increasing importance of mobile ecosystems, including gaming, e-commerce, fintech, and productivity applications.
Top Countries by Mobile App Downloads
- In India, several mobile apps achieved leading download rankings in Q2 2025, including Instagram and ChatGPT.
- Brazil’s top-download app in Q2 2025 was ChatGPT, followed by TikTok and Instagram.
- In Australia in Q2 2025, ChatGPT led downloads, followed by streaming and commerce apps.
- Growth in smartphone adoption in developing regions is accelerating downloads; for example, the smartphone user base in 2025 is expected to reach 4.69 billion.
- The U.S. remains a major download market but shows signs of saturation compared with emerging markets.
- Regions like MENA (Middle East & North Africa) saw e-commerce app install growth of 55 % in 2024.
- North America experienced a plateau or slight decline in certain app install categories during 2024.
- Emerging economies now contribute a growing share of download volume, driven by improved mobile internet access and affordable devices.
App Store vs Google Play Performance
- In 2024, the combined global downloads show that the Google Play Store continues to dominate in volume compared with the Apple App Store.
- The Apple App Store offered approximately. 1.96 million apps, while Google Play had around 2.87 million apps globally.
- Free apps make up 97 % of downloads on Android stores, and paid downloads remain a small fraction overall.
- Consumer spend in the U.S. traced for iOS shows strong growth, with the U.S. recording US $52 billion in consumer spend for in-app purchases and subscriptions in 2024.
- Average session lengths and engagement tend to be higher among iOS users in mature markets.
- Google Play’s broader device base in developing markets gives it higher download volume but lower average revenue per download compared with Apple.
- Android’s global OS market share is roughly 71%, and iOS 28% in smartphones as of early 2025.
- App developers increasingly adopt a dual-store strategy, but allocate more budget per-user spend toward iOS given higher monetization potential.
Leading Mobile App Categories by Downloads
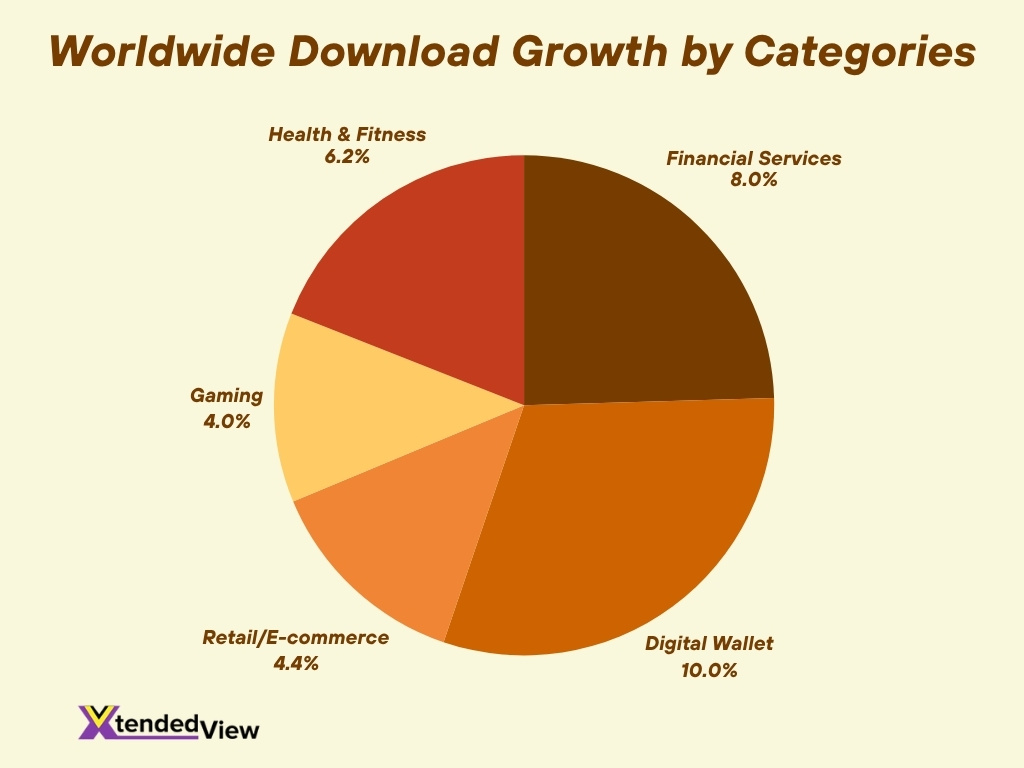
- In 2024, the financial-services app category surpassed 7 billion global downloads, marking an 8 % year-over-year rise.
- The digital wallet and peer-to-peer payment sub-categories grew 10 % YoY in 2024.
- Retail and e-commerce apps rose 4.4 % in global downloads in 2024, though in the United States, downloads declined by 9.6 %.
- From October 2024 to September 2025, some Google Play categories saw major declines, e.g., “Libraries & demo” categories dropped 18.8 % and “Education” 9.7 %.
- Strategy games within the mobile gaming segment reported an 83 % YoY increase in installs in 2024.
- Within the “shopping” vertical in the MENA region, installs grew by 55 %, and sessions rose by 21 % in one recent year.
- Gaming apps overall saw a modest 4 % lift in installs in 2024, indicating a slower growth phase for that category.
- Health & fitness apps recorded 6.2 % growth in downloads in 2024, and their in-app purchase revenue rose 14.1 %.
- Some sub-genres faced contraction; for example, antivirus/VPN apps saw downloads drop by 32 % in 2024.
Leading Mobile App Categories by Revenue
- In 2024, global consumer spend on mobile apps reached approximately. US $150.1 billion.
- Apps on iOS accounted for 68 % of that consumer spending in 2024.
- The global mobile app market is projected to hit over US $1 trillion by 2034, driven in part by monetisation in high-engagement categories.
- Gaming apps claim a high share of revenue; for example, mobile gaming apps were responsible for nearly 49 % of total app-store revenue early in 2025.
- Health & fitness apps enjoyed a 14.1 % increase in in-app purchase revenue in 2024.
- Video-streaming mobile apps saw 36 % higher in-app purchase revenue in 2024 compared with the prior year, but user engagement in that category dropped.
- Free-to-download apps continue to dominate downloads, shifting monetisation to subscriptions, in-app purchases, and ads rather than upfront purchase.
- In-app advertising is increasingly important; global in-app ad spending is projected to reach $390billion by 2025, capturing 82 % of mobile-ad spending.
Consumer Spending on Mobile Apps
- In Q1 2025, the global consumer spend on mobile apps was around US $40 billion.
- For 2024 as a full year, combined Android + iOS consumer spending was about US $150 billion.
- It is projected that consumer spending on mobile apps will continue to rise toward US $150 billion in 2025.
- The average smartphone user globally opened an app 11+ times each day, 49 % of users hit that mark in one recent survey.
- Free apps account for 97 % of downloads, hence consumer spend is concentrated in the minority of apps that monetise via in-app purchases or subscriptions.
- In the U.S., mobile apps account for 70 % of all digital-media time.
- Mobile commerce is forecast to see 59 % of total retail e-commerce sales in 2025, estimated at US $4.01 trillion globally.
Mobile App Revenue Statistics
- The global mobile app market size is evaluated at approximately. US $289 billion in 2025.
- In 2024, the global user-time across apps was 4.2 trillion hours, showing the scale of consumption that drives monetisation.
- iOS users contributed 68 % of total app-store consumer spending in 2024.
- The average number of apps downloaded per user globally per month was 9.2 as of Q2 2025.
- The share of smartphone screen time spent in apps is 88%.
- Mobile advertising inside apps is projected to reach US $390 billion in 2025.
- Despite a slowdown in download growth, revenue per user is rising, evidence of deeper monetisation and user engagement rather than raw volume.
App Usage and Engagement Metrics
- The average smartphone user spends 4.9 hours per day interacting with mobile apps, and approximately 89 % of that time is spent in apps.
- Globally, 49 % of users open an app 11 or more times each day.
- There is a clear shift from mobile web to apps; 88 % of mobile time is now spent inside apps rather than browsers.
- Among Millennials, 21 % open an app 50+ times per day, indicating very high engagement in that demographic.
- App session frequency and duration continue to rise, reinforcing that the market is more about “depth of usage” than just “number of downloads.”
- Mobile commerce apps in some regions enjoy significantly higher session counts and durations compared to mobile sites, e.g., 4.2× more product-view sessions.
- The penetration of apps as the primary channel is notable; 55 % of consumers globally prefer apps rather than the web for brand interaction and digital transactions.
Daily Time Spent on Mobile Apps
- The average daily time spent on mobile apps among global users is 4.9 hours in 2025.
- In the U.S., mobile apps account for 70 % of all digital-media time.
- The global total user-time in mobile apps for 2024 was 4.2 trillion hours.
- In shopping apps, each session often leads to more product views; in-app shopping sessions can be 4× mobile website sessions.
- Users who open an app 11+ times daily comprise 49 % of smartphone users.
- Millennial users are among the highest time-spenders, 21 % open apps 50+ times each day.
- App usage continues to increase even as download growth slows, indicating that existing users are spending more time.
Mobile App Retention Rates
- On Android globally, average day-1 retention is 21.1 %, dropping to 2.1 % by day 30 in 2025.
- On iOS globally, average day-1 retention is 23.9 % and drops similarly by day 30.
- For marketplace apps, day-1 retention dropped from 27 % in 2023 to 25 % in 2024, day-7 fell from 16 % to 15 %, and day-30 from 9 % to 8 %.
- Industry-specific benchmarks for day-30 retention (Android) in 2025: Finance 3 %, Shopping 4 %, Gaming 1.7 %.
- Retail and shopping category day-30 retention for iOS 4 %.
- Some categories, like Education and Photography, show very low retention, 2.1 % and 1.5 % respectively (day-30) in recent benchmarks.
- The high attrition rates underscore the challenge for app developers to retain users, not just acquire downloads.
- Time-of-notification matters; sending push notifications at inappropriate hours, e.g., 3 a.m., can lead to a 37 % drop in active users.
Monetization Models in Mobile Apps
- In 2025, many mobile apps are moving toward hybrid monetization models that combine ad support and premium tiers.
- The most common monetization models listed for 2025 include freemium, in-app advertising, subscriptions, in-app purchases (IAP), transaction fees, and licensing/white-label models.
- According to one report, the in-app purchase market was valued at $209.133 billion in 2024 and projected to reach $257.23billion in 2025.
- In the U.S., mobile ad spend within apps is projected to hit about US $288.11 billion in 2025.
- Subscription-based apps are considered more sustainable, with recurring revenue and higher user lifetime value (LTV).
- Free-to-download apps make up a very large share of installs (97%), hence monetisation strategies are key for converting free users into paying users or ad-revenue streams.
- Developers are increasingly using behavioral analytics and AI-driven pricing optimisation to tailor monetization offers per user segment.
- In markets with mature competition, there is a noticeable shift away from upfront paid apps toward “pay-as-you-go”, micro-transactions, and dynamic pricing.
- Apps with multiple revenue streams (ads + IAP + subscriptions) tend to outperform those relying on a single model.
Generative AI and Chatbot App Statistics
- The “AI apps” sector reached approximately US $4.5 billion in revenue in 2024, with projections up to US $156.9 billion by 2030.
- In April 2025, the ChatGPT app registered about 52 million downloads worldwide, making it the most downloaded mobile app in that period.
- As of October 2025, ChatGPT held around 81% global market share among AI-chatbot apps.
- AI chatbots and assistants are increasingly integrated into mobile apps across categories, not just standalone chat apps, for example, image editing, productivity, and finance apps.
- The rise in generative AI apps is driving new user behaviours, more frequent sessions, higher expectations of instant assistance, and increasing pressure on app infrastructure.
- Developers report that AI-powered apps must also manage data privacy and guard against user mistrust because of increased complexity and sensitivity of the features.
- Some apps are shifting monetisation to AI capabilities, e.g., premium chatbot features, in-chat commerce, enterprise integrations, rather than simple IAP for game items.
- The user adoption of AI-chatbot apps is accelerating faster than many other categories, reflecting a broader trend of “app functionality meets AI.”
Most Downloaded Apps
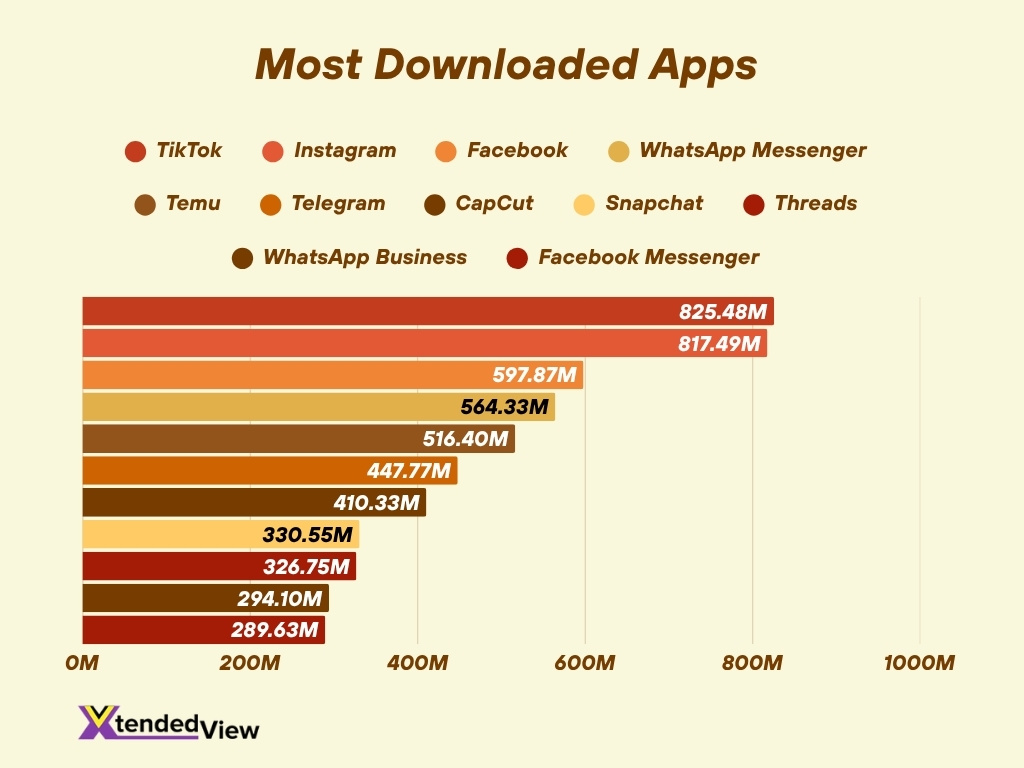
- TikTok leads the global ranking with a massive 825.48 million downloads, maintaining its dominance as the most downloaded app worldwide.
- Instagram follows closely with 817.49 million downloads, reflecting strong user engagement through Reels and social commerce.
- Facebook ranks third with 597.87 million downloads, showing its continued relevance across generations.
- WhatsApp Messenger takes fourth place at 564.33 million downloads, confirming its position as a leading global communication tool.
- Temu, the e-commerce sensation, climbs to fifth place with 516.4 million downloads, highlighting the rapid rise of online shopping apps.
- Telegram ranks sixth with 447.77 million downloads, popular for its privacy features and large group capabilities.
- CapCut, a video editing app often used by TikTok creators, has recorded 410.33 million downloads, emphasizing the content creation boom.
- Snapchat holds 330.55 million downloads, maintaining its foothold among younger audiences.
- Threads, Meta’s text-based platform, reached 326.75 million downloads, indicating strong adoption in its debut year.
- WhatsApp Business (294.1M) and Facebook Messenger (289.63M) round out the top list, showcasing Meta’s broad ecosystem strength.
Most Popular Social Media Apps
- In July 2025, TikTok and Instagram led social-media app downloads worldwide with 39 million and 38 million, respectively.
- Social media apps account for a large share of mobile time; for example, about 35% of mobile time was spent on social media apps in 2024.
- The dominance of a few platforms continues; Instagram, TikTok, Facebook, WhatsApp, and Telegram maintain multi-billion monthly active user bases.
- The strong engagement of social apps makes them attractive for monetisation (ads, creator economy, e-commerce), which in turn raises the bar for new entrants.
- Short-form video formats (Reels, TikTok-style) remain top drivers of download growth and engagement in the social-media category.
- Social-media apps increasingly integrate other functionalities (commerce, payments, AI features), creating “super-apps” with multiple revenue streams.
- User retention in social apps tends to be higher compared with lesser-known apps because of network effects and habitual use.
Mobile Gaming App Statistics
- Global mobile game downloads in 2024 were about 49 billion, marking a 7 % decline from the previous year.
- The mobile games market revenue is projected to exceed US $125 billion in 2025, showing steady monetization growth despite slowing installs.
- Average Revenue Per User (ARPU) in mobile gaming is estimated at $1.95 in 2025 globally.
- Strategy games, although accounting for only 4 % of total downloads, generate over 21 % of total gaming revenue due to in-app purchases.
- The number of mobile gamers worldwide is projected to surpass 3.3 billion in 2025, representing nearly 42 % of the global population.
- Casual games such as puzzle and simulation titles remain the largest segment by downloads, while RPGs and strategy lead in revenue.
- Mobile game ad spend is increasing rapidly, with projections nearing $130 million in 2025 for performance-based campaigns.
- In developed markets such as the U.S. and Japan, growth has slowed, prompting developers to focus on retention, live-ops, and seasonal events.
- Emerging markets in Asia and Latin America are the biggest contributors to new mobile gamer growth in 2025.
- Cross-platform integration between mobile and console ecosystems is expected to boost engagement and retention across regions.
Regional and Country-wise App Market Insights
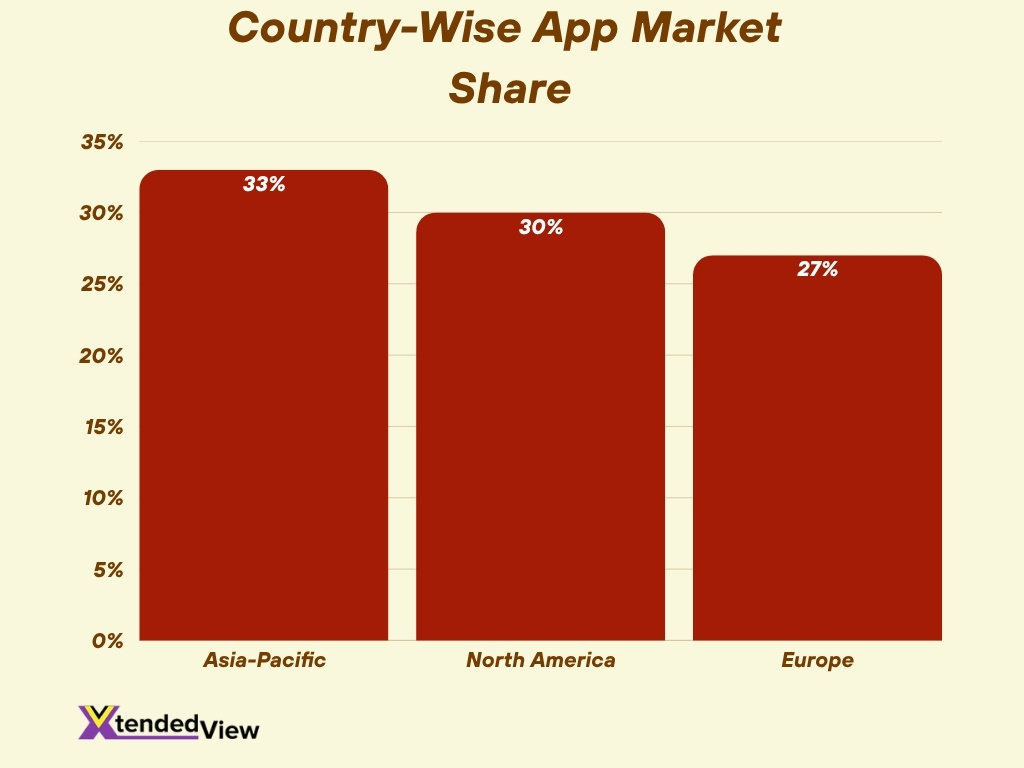
- The Asia-Pacific region remains dominant, holding about 33 % of the global app market in 2024, followed by North America (30 %) and Europe (27 %).
- Global mobile subscriptions exceeded 8.66 billion in 2025 and are projected to reach 9.4 billion by 2030.
- Android (71 %) maintains a commanding global OS share, while iOS (28 %) drives higher per-user spending.
- The MENA region experienced 55 % growth in e-commerce app installs in 2024, signaling high regional adoption potential.
- North America shows maturity, with slower download growth but higher average revenue per user and stronger subscription uptake.
- In India and Brazil, social-media and AI-enabled apps, including ChatGPT and TikTok, remain the most downloaded.
- Europe’s mobile-app market growth is stabilizing, but strong regulation and data-privacy frameworks are shaping monetization strategies.
- 5G penetration, which carried 35 % of global mobile traffic in 2024, continues to expand mobile usage in emerging economies.
- The U.S. remains a high-value market, accounting for about one-third of total iOS consumer spending in 2025.
- Regional trends show a shift toward localized content, payment systems, and region-specific engagement features to improve retention.
Frequently Asked Questions (FAQs)
Approximately 4.69 billion people own a smartphone worldwide in 2025.
Global mobile app downloads are projected to reach about 299 billion in 2025.
Global consumer spending on mobile apps reached around $40 billion in Q2 2025.
Downloads on Google Play dropped by approximately 3.2 % in 2024 compared to the previous year.
The mobile app market is projected to be worth about US $756 billion by 2027, at a growth rate of roughly 8.6 % CAGR.
Conclusion
The mobile app ecosystem reflects maturity, innovation, and diversification. While overall download growth is stabilizing, user engagement, retention, and monetization are deepening across categories. Hybrid revenue models combining ads, subscriptions, and in-app purchases are now the standard. Generative AI applications and chatbots are redefining functionality and user experience, driving massive adoption across sectors.
Social media and mobile gaming continue to dominate user time, while regional dynamics reveal new opportunities in emerging markets. For developers and marketers, success in 2025 hinges on sustained user value, personalization, and data-driven monetization strategies.