
Google Shopping has become a critical hub for online product discovery, comparison, and purchasing. From enterprise retailers to local merchants, the platform is shaping how users interact with products before they buy. Two industry applications showcase their impact: brands leveraging Performance Max campaigns to dynamically serve Shopping ads across Google’s ecosystem, and retail chains using product feed optimisation to improve in-store conversions via online research. Google Shopping continues to evolve with AI enhancements, shifting user behaviours, and expanded global availability. Dive into this report to uncover the latest data and trends driving Google Shopping’s growth and performance.
Editor’s Choice
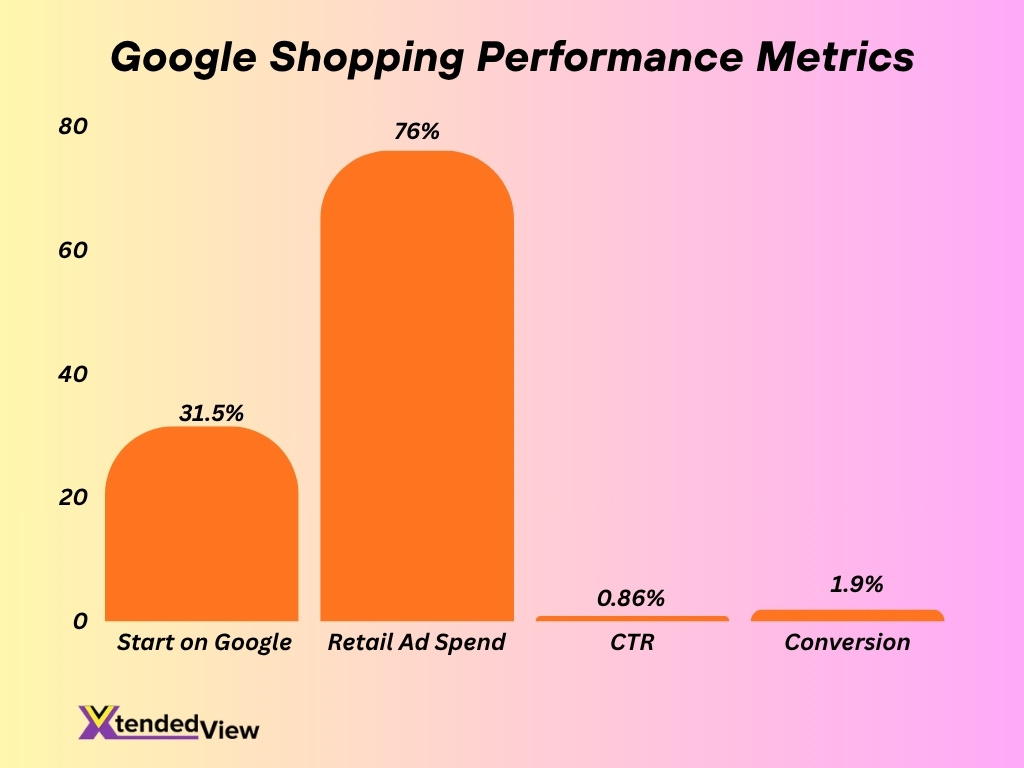
- In 2025, 31.5% of shoppers report starting their product search on Google Shopping.
- The platform sees about 1.2 billion searches per month on its commercial shopping tab.
- Shopping ads via Google contribute roughly 76% of all retail search‑ad spend.
- The average click‑through rate (CTR) for Google Shopping ads is approximately 0.86%.
- Conversion rate for Shopping ads hovers around 1.9%.
- The average cost‑per‑click (CPC) for a Shopping ad is about $0.66.
- New reporting changes for the Google Merchant Centre click‑metrics take effect on April 21, 2025, affecting transparency and alignment.
Recent Developments
- On April 8, 2025, Google updated its Merchant Centre product data specification, including new requirements for AI‑generated content disclosure in listings.
- Starting April 21, 2025, Google aligned its Merchant Centre click‑reporting with Google Ads metrics to standardise measurement.
- In its Spring 2025 trends update, Google highlighted a shift toward shoppable video and visual search within Shopping listings.
- AI and personalisation features are being integrated into Google Shopping, enabling smarter product recommendations and dynamic ad formats in 2025.
- The Merchant Centre emphasises higher‑quality structured data feeds; businesses must prepare for increased scrutiny and feed-optimisation demands.
- Several updates seek to support new ad formats and bidding strategies, reflecting evolving user behaviours and ad‑ecosystem competition.
- Retail search advertising is predicted to become more competitive in 2025 as brands shift budgets toward Google Shopping and away from traditional text ads.
- Data privacy and measurement changes (e.g., deprecation of third‑party cookies, attribution shifts) are driving transformation in Shopping campaign performance.
Overview of Google Shopping
- Google Shopping offers a product‑listing experience within the broader Google LLC Search ecosystem, letting users view, compare, and purchase products directly from search results.
- It functions both as a free listing service (for merchants via Merchant Centre) and a paid ad channel offering product‑listing ads (PLAs) and Shopping campaigns.
- In 2025, Google Shopping remains central for e‑commerce strategies, and it is positioned as a “product discovery engine” rather than just search ads.
- The platform reaches users across device types (desktop, mobile) and includes integrations with other Google properties such as Google Search, Google Images, and YouTube.
- Merchants supply product‑feed data (via Merchant Centre), which is then surfaced in the Shopping tab, Search results, and partner surfaces.
- The growth of Shopping is tied to broader e‑commerce expansion, and global online retail sales are projected to hit $7.4 trillion in 2025.
- For U.S. audiences, Shopping is a key interface for retail research; 70% of smartphone users search online before an in‑store purchase.
- The platform supports dynamic retargeting, feed optimization and performance reporting, making it critical for merchants because nearly 85% of clicks on retail ads are via Shopping ads rather than traditional text ads.
Basic Features of Google Shopping
- Product feed management, Merchants upload data attributes (title, price, availability, image) via Merchant Centre.
- Shopping tab and Search integration, Products appear in a dedicated Shopping tab and within general Google Search results when users search for merchandise.
- Paid Shopping campaigns, Advertisers can run Shopping campaigns via Google Ads, using feed data and bidding strategies like manual CPC, tROAS, etc.
- Free listings, Google enables free product listings (for eligible merchants) that appear without cost for clicks, broadening reach beyond paid ads.
- Visual and discovery‑driven formats, Richer visuals, product carousels, and AI‑driven recommendations are increasingly prominent in 2025.
- Performance metrics, Key metrics include impressions, clicks, CTR, conversion rate, cost per click (CPC), and return on ad spend (ROAS).
- Device/mobile optimisation, Mobile‑first design is essential since 65% of clicks on paid Google search results come from mobile devices.
- Feed and data quality requirements. In 2025, merchants must comply with updated feed specifications (e.g., AI content disclosure, price-instalment rules).
- Integration with other Google tools, Shopping feed data can support cross‑channel placements (Search, YouTube, Display) via the Merchant Centre.
Google Shopping’s Contribution Statistics
- About 76% of retail search‑ad spend is estimated to flow into Google Shopping ads.
- Approximately 85% of clicks on retail ads originate from Shopping ads rather than traditional text ads.
- The platform registers around 1.2 billion monthly product searches via Shopping listings.
- For every $1 spent on Google Ads (including Shopping), businesses typically earn about $2 in return, according to one data set.
- E‑commerce brands often allocate 80% of their paid‑search budget to Google Shopping and 20% to standard PPC ads.
- On the feed upload side, rapid adoption, more than 1 million businesses reportedly use Google Ads (with many leveraging Shopping).
- Mobile devices account for 65% of clicks on paid Google search results, indicating Shopping’s mobile lift.
- The total global e‑commerce market value projected at $7.4 trillion in 2025 underscores the scale of opportunity for Shopping.
Google Shopping Growth Statistics
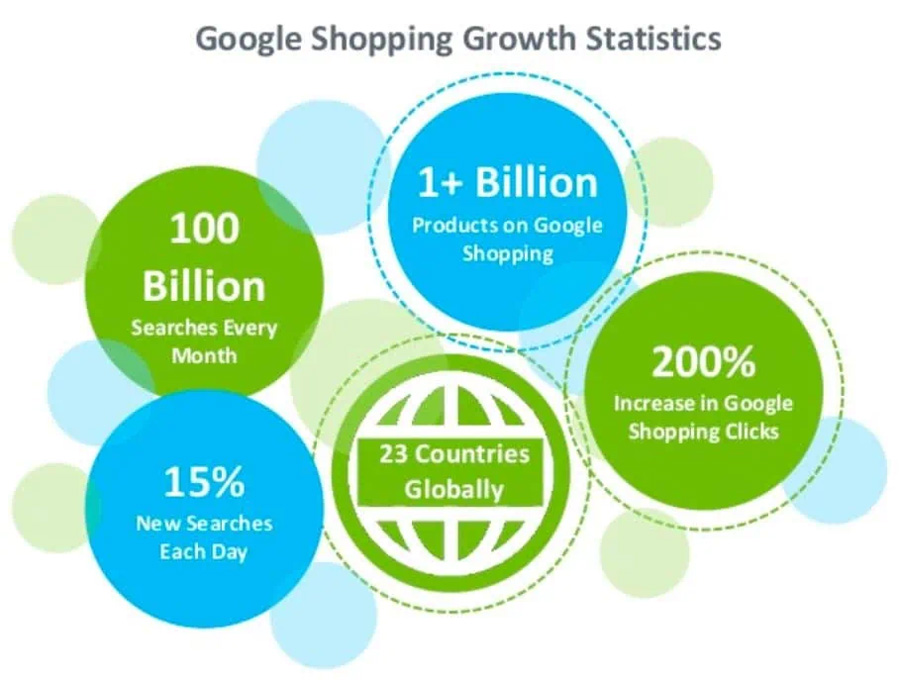
- 100 billion searches are conducted on Google every month.
- 15% of searches made each day are new, never-before-seen queries.
- Over 1+ billion products are listed on Google Shopping.
- Google Shopping ads have seen a 200% increase in clicks.
- Google Shopping currently operates in 23 countries globally.
Google Shopping User Statistics
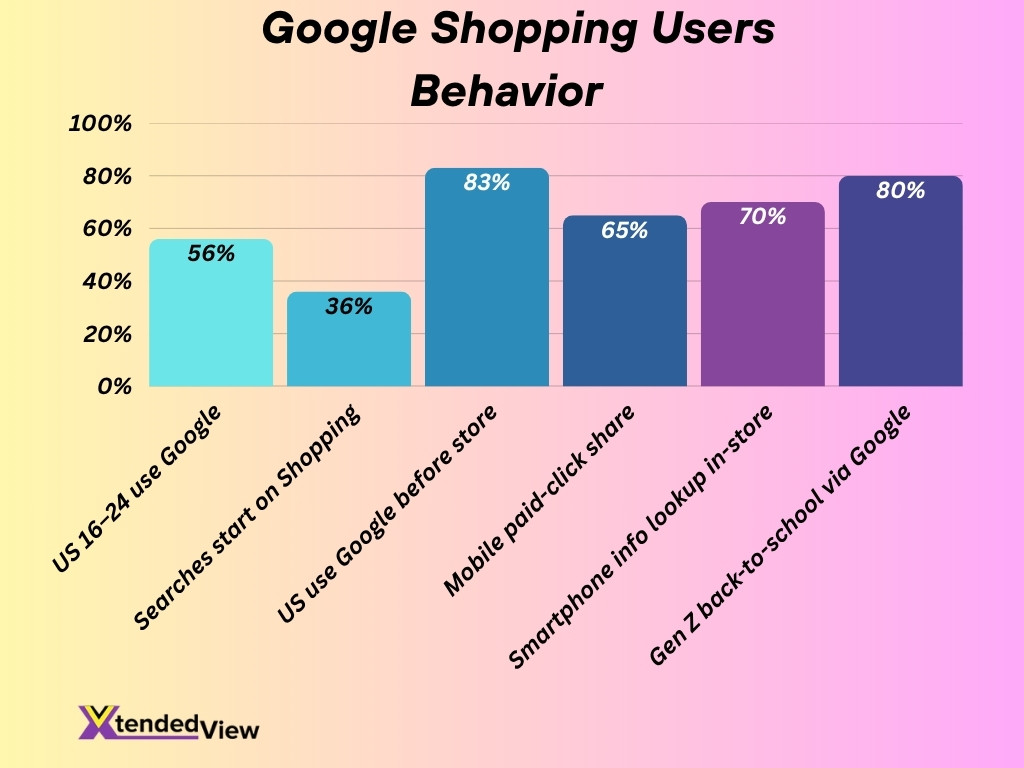
- Among U.S. shoppers aged 16‑24, 56% use Google Search, YouTube or Gemini first for product research, up 4 points year‑over‑year.
- An estimated 36% of all product discovery searches start on Google Shopping in 2025.
- In the U.S., roughly 83% of online shoppers use Google Search before visiting an online store.
- Mobile devices generate around 65% of clicks on paid Google search results, reflecting strong mobile‑shopping behaviour.
- Nearly 70% of smartphone users look up product information online before an in‑store purchase.
- In a cross‑market survey, 80% of Gen Z consumers used Google for at least one part of their back‑to‑school shopping journey (discovering, browsing, researching or purchasing).
- Merchant data suggest that more than 1 billion shopping sessions per day occur via Google surfaces (Search + Shopping tab) in late 2024/25.
- Device and context matter. Users on mobile are changing their queries more frequently and reformulating searches at a higher rate than desktop users.
Google Shopping Ads Statistics
- The average click‑through rate (CTR) for Google Shopping ads is about 0.86%.
- The average conversion rate (CVR) for Shopping ads in 2025 is approximately 1.91%.
- The average cost‑per‑click (CPC) for Shopping ads is around $0.66.
- The average cost‑per‑acquisition (CPA) for Shopping ads is about $38.87.
- Among industry verticals, the highest conversion rate is for HVAC & Climate Control at 3.30%.
- The highest average CPC by vertical is for Office & Business Needs at about $1.09.
- Shopping ads account for roughly 76% of all retail search‑ad spend.
- Shopping ads generate about 85% of all clicks on retail‑related Google Ads campaigns (versus text ads).
Average Monthly Budget, Cost Per Click (CPC), and Click‑Through Rate (CTR) by Industry
- For the “Office & Business Needs” vertical, average CPC is $1.09.
- For “Computers & Technology, the average CPC is $0.89.
- For “Health & Beauty”, the average CPC is $0.87.
- For “Child & Infant Care”, the average CPC is $0.36 (among the lowest).
- The average conversion rate across verticals for Shopping ads, HVAC & Climate Control (3.30%), Medical Supplies (2.94%), Health & Beauty (2.78%).
- The lowest conversion rates by vertical are Chemical & Industrial (0.83%), Pet Care (1.07%), and Automotive Supplies (1.29%).
- The average budget for a Shopping ad campaign (per some data) is around $770.41.
- Advertisers report that Shopping ad clicks are 30% more likely to convert than standard text ads.
Google Shopping Statistics by User Behaviour
- The average mobile user reformulates a search query 29.3% of the time, compared to 17.9% for desktop.
- Approximately 19% of product‑search users click on a result from Google Shopping.
- Among Gen Z (16‑24), 40% start price‑comparison searches at Google, versus 25% at Amazon.
- More than 70% of smartphone users are more likely to buy from brands whose mobile site or app delivers location‑specific customisation.
- Around 65% of clicks on paid Google search results come via mobile devices.
- In a global survey, mobile commerce accounted for 72% of global e‑commerce sales (2023), with the expectation of further growth.
- Shoppers who start their product research on Google tend to have higher purchase intent, e.g., 36% start with Google Shopping.
- Among online shoppers, women (72%) shop at least once a month online compared with men (68%).
- Adult users aged 18‑24 comprised 47% of mobile e‑commerce shoppers in the U.S. in recent data.
Google Shopping Conversion Statistics
- The average conversion rate for Shopping ads is 1.91%.
- Conversion rate in the Medical Supplies vertical 2.94%.
- Conversion rate in the Health & Beauty vertical 2.78%.
- Conversion rate in the HVAC & Climate Control vertical 3.30%.
- Conversion rate in the Pet Care vertical 1.07%.
- Conversion rate in the Clothing & Apparel vertical 2.70%.
- Conversion rate in the Chemical & Industrial vertical 0.83%.
- A comparison of the average conversion rate for Google Ads (search) is 7.52% in 2025, far higher than Shopping ads, underscoring the difference in intent and format.
- E‑commerce benchmarks show average conversion rates across retailers in 2025 range between 2%‑4%, depending on industry and device.
Google Shopping Brand Awareness Statistics
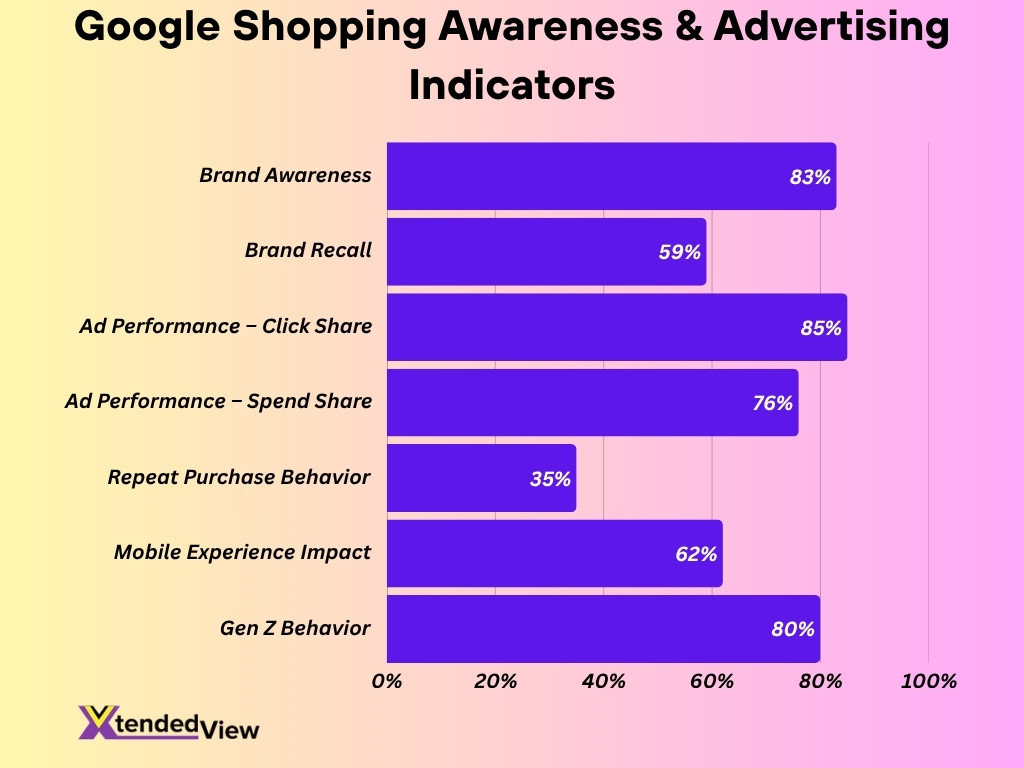
- In the U.S., brand awareness for Google Shopping among price‑comparison‑portal users is about 83%.
- Among U.S. price‑comparison‑portal users, 59% cited Google Shopping when asked about comparison platforms.
- More than 85% of clicks on retail‑related Google Ads are attributed to Shopping ads, signalling strong brand visibility for advertisers using the channel.
- Shopping ads drive 76% of retail search ad spend, which implies brand‑advertiser prioritisation of the channel.
- Data suggest that shoppers who discover a product via Google are more likely to make repeat purchases; 35% of surveyed users stated they made repeat purchases from brands discovered online.
- Mobile-optimised brands gain higher recall. 62% of shoppers say they prefer brands whose mobile experience is optimised.
- Among Gen Z shoppers, 80% reported using Google for at least one stage of their shopping journey, including brand discovery.
Website Traffic Statistics
- Google Shopping is estimated to account for 55% of online shopping traffic share in certain markets.
- Approximately 41% of U.S. online shoppers reported using Google Shopping at least once.
- Globally, more than 33% of the population is now online shoppers, contributing to a total e‑commerce industry value of $6.8 trillion in 2025.
- In broader search traffic terms, the U.S. leads with 21.3 billion monthly visits to Google (all services), representing 21% of global Google traffic.
- The average budget for a Google Shopping campaign is around $770.41 in industry data.
- The ratio of clicks to impressions in Shopping ads sits at a 0.86% click‑through rate benchmark.
- Mobile devices contribute heavily; one source cites mobile generating 65%+ of paid Google search clicks (including Shopping).
- Of all clicks on Google Ads or Google Shopping campaigns, Shopping ads reportedly account for 85%.
- Nearly 70% of smartphone users looked something up online before making an in‑store purchase.
Google Shopping by Country
- Google Shopping and free product listings are available in 94+ regions and territories as of recent counts.
- For measuring offline conversions like store visits, Google Ads supports data from many countries, including the U.S., India, Mexico, Brazil, and Canada.
- Country‑level targeting is increasingly refined; merchants can now exclude specific countries using feed attributes for Shopping campaigns.
- One country ranking data shows the U.S. alone accounted for 20.98% of global Google traffic in 2025.
- Google Shopping feed uploads now often require language/currency compliance tailored per country for free listings and ads.
- Expansion into beta markets is ongoing, enabling early‑entry retailers to test via free listings in newer countries.
- Regional adoption varies, while Google Shopping is established in North America and Europe, faster growth is seen in Asia‑Pacific and Latin America in recent years.
- Localisation matters; product feed attribute requirements differ by country, e.g., tax/shipping rules in the U.S. vs. other regions.
Google Shopping by Marketing Channels
- Shopping ads are reported to consume 76% of all retail search‑ad spend.
- Among the major marketing channels for e‑commerce, search (including Shopping) remains dominant, with 43% of e‑commerce traffic coming from Google search (organic).
- Multichannel shoppers, 73% of consumers use multiple channels before buying online.
- Mobile optimisation across channels is key; 59% of surveyed shoppers said mobile shopping capability is important when selecting a retailer.
- Shopping ads blended with other channels (e.g., display, video) are increasingly common via formats like Performance Max.
- Social media and marketplaces continue to grow as channels, but Shopping remains central for product discovery and search‑based acquisition.
- Clicks from Shopping ads are approx. 85% of total clicks on Google Ads retail campaigns, reflecting heavy channel allocation.
- The share of product‑discovery searches started on Google is 36%, indicating channel overlap with organic and paid search.
Advertising Performance Metrics
- For Shopping ads in 2025, the average CTR 0.86%, the average CPC is $0.66, average conversion rate 1.91%.
- On average, Shopping campaign spending per campaign is around $38.87, though it varies by industry.
- In the broader PPC market (search ads), average CTR is 6.66%, and average CPC is $5.26 in 2025.
- Conversion‑rate increases were observed in 65% of industries in 2025, despite rising CPCs.
- Cost per lead (CPL) across Google Ads averaged $70.11 in 2025.
- Shopping ads drive higher‑intent traffic. Shopping clicks are 30% more likely to convert than standard search ads.
- Mobile clicks still dominate, with>65% of paid‑search clicks coming via mobile devices.
- Return on ad spend (ROAS) for search remains about $2 for every $1 spent, according to some data.
Regional Variations & Growth Markets
- While North America and Western Europe remain mature markets for Shopping, growth momentum is accelerating in Asia‑Pacific and Latin America.
- With availability in 90+ countries, advertisers targeting growth markets have expanded reach significantly.
- Mobile commerce penetration is higher in growth markets, amplifying Shopping‑ad efficacy when optimised for mobile.
- Merchants in newer markets often face fewer legacy competitors, enabling better performance early, but also must localise product‑feeds, shipping & tax info to succeed.
- Emerging markets may see lower CPCs but also lower conversion rates initially until feed quality, trust, and logistics improve.
- Regional differences in consumer behaviour, e.g., higher mobile‑first shopping in India/SEA vs. desktop-led in some Western markets.
- Per‑country ad‑regulation and data‑privacy laws vary, impacting the performance and measurement of Shopping campaigns locally.
- Attribution complexity in cross‑border campaigns increases with varied user journeys and regional conversion paths.
Challenges & Limitations of Google Shopping
- One well‑documented issue, feed‑data errors, Many advertisers face disapproved products, missing attributes, or “not ready to serve” statuses.
- High competition, CPCs, and ad costs continue to rise, making efficient bidding and margins more difficult.
- Attribution and measurement, with privacy changes (e.g., cookie deprecation), tracking true ROAS from Shopping campaigns becomes harder.
- International/Regional expansion brings complexity, language, currency, tax, shipping, and feed attributes differ by country.
- While average conversion rates are 1.9% for Shopping ads, many industries may perform lower, making scalability and profitability a challenge.
- Mobile‑first dynamics. Although mobile drives many clicks, conversion rates are often lower on mobile vs. desktop, requiring optimisation.
- Dependence on product margins, Low‑margin products may make high‑CPC Shopping campaigns unprofitable unless optimised carefully.
- Platform policy changes, feed‑spec updates, AI disclosure requirements, and country‑availability changes can disrupt campaigns.
Frequently Asked Questions (FAQs)
Approximately 31.5% of shoppers start their product search on Google Shopping.
The average CTR for Google Shopping Ads is about 0.86%.
The average CPC for Google Shopping Ads is approximately $0.66.
About 76% of retail search ad spend goes to Google Shopping ads.
Mobile devices generate roughly 65% of paid Google search clicks.
Conclusion
Google Shopping continues to play a central role in e‑commerce and retail‑search strategies. For U.S. and global advertisers alike, the platform offers high‑visibility touchpoints, robust channel integration, and measurable performance benchmarks. That said, success is not automatic; careful feed‑management, channel mix optimisation, regional sensibility, and margin‑aware bidding remain crucial.
As online shopping evolves, with mobile, AI, and new regional markets taking centre‑stage, merchants who stay agile and data‑driven will gain the most from Google Shopping.