


Google Shopping has become one of the most important product discovery channels for online retailers. Millions of consumers now compare prices, read reviews, and purchase products directly from Shopping listings before visiting a retailer’s website. Retailers also rely on Google Shopping campaigns to drive product visibility and increase online sales during peak shopping seasons.
The platform plays a major role in industries such as fashion, electronics, and home goods, where product comparisons and price transparency directly influence buying decisions. In addition, Google’s AI-powered advertising tools continue to reshape how brands manage product campaigns and customer acquisition. The statistics in this article reveal how Google Shopping is evolving and what these changes mean for advertisers and e-commerce businesses.
Editor’s Choice
- Google processed more than 8.5 billion searches per day in 2025, creating one of the world’s largest audiences for Shopping advertisers.
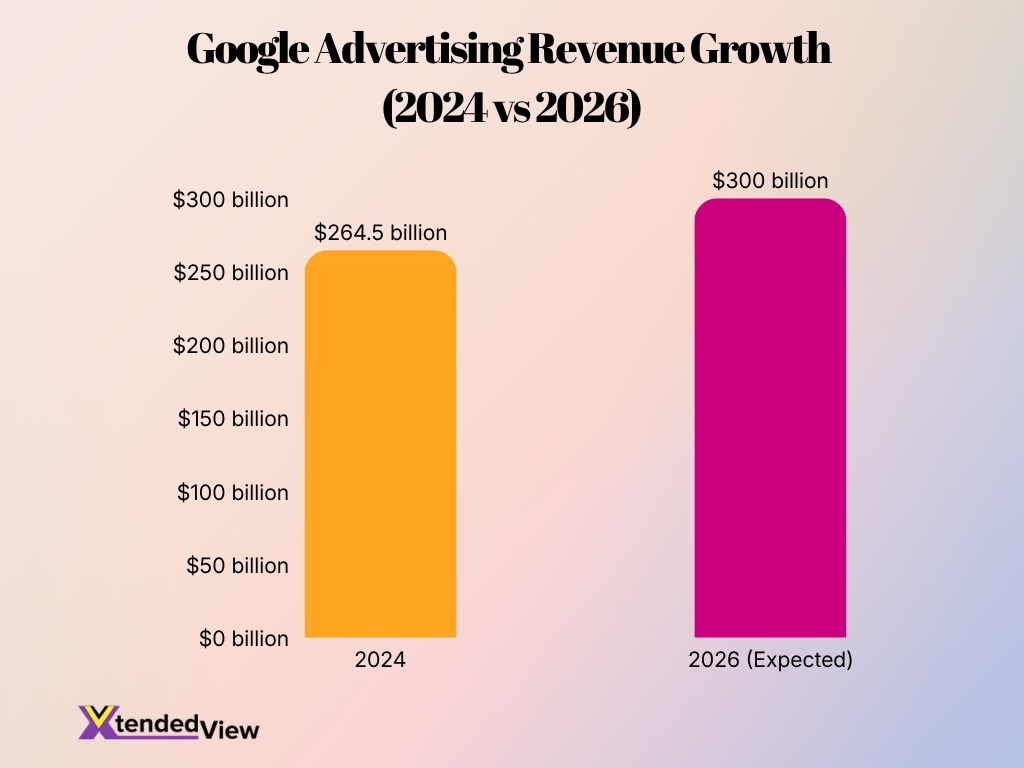
- Google’s advertising business generated approximately $264.5 billion in revenue during 2024, with analysts expecting it to surpass $300 billion by the end of 2026.
- More than 7 million businesses worldwide actively use Google Ads, including Shopping campaigns.
- Google controls roughly 80.2% of the global PPC advertising market, making it the dominant platform for product advertising.
- The average global Google Shopping click-through rate (CTR) reached 0.86% in 2026, while high-performing campaigns exceeded 1.2%.
- Average Shopping campaign conversion rates stood at 1.91% globally in 2026.
- Top-performing e-commerce brands generated approximately 6x return on ad spend (ROAS) from Google Shopping campaigns in 2026.
- Shopping campaign cost per click averaged $0.66 globally in 2026, remaining lower than traditional search advertising costs.
Recent Developments
- Google continued its push toward automation by expanding Performance Max features for Shopping campaigns throughout 2025 and 2026.
- Performance Max campaigns generated approximately 19% higher ROAS than Standard Shopping campaigns in benchmark studies.
- Performance Max achieved a 14% higher conversion rate than Standard Shopping campaigns in 2025 testing.
- The platform delivered around 20% higher impression share for advertisers using Performance Max.
- New customer acquisition rates improved by nearly 20% when advertisers adopted Performance Max campaigns.
- Google continued integrating AI-generated creative recommendations and automated product feeds into Merchant Center management during 2025 and 2026.
- Industry data showed that 87% of sectors experienced rising advertising costs in 2025, prompting retailers to focus more heavily on automation and optimization tools.
- Median Google Ads ROAS declined by approximately 10% in 2025, increasing demand for more efficient Shopping campaign strategies.
- Google Ads’ overall conversion rates still increased by 6.84% year over year, highlighting continued advertising effectiveness despite higher costs.
Overview of Google Shopping in 2026
- Google Shopping remains one of the most influential e-commerce advertising channels because product listings appear directly in search results with pricing, images, and reviews.
- More than 7 million businesses now advertise products across Google’s ecosystem.
- Google maintains approximately 80% of worldwide PPC market share, giving Shopping campaigns access to a massive audience.
- Analysts expect Google’s advertising business to exceed $300 billion in annual revenue by 2026, driven partly by AI-powered campaign products.
- Shopping ads continue to cost significantly less than traditional search campaigns, averaging between $0.50 and $0.95 per click.
- Benchmark data indicates that top-performing Shopping advertisers generate ROAS exceeding 8x, especially in mature e-commerce categories.
- Average Shopping campaign conversion rates remain near 1.9% globally, with top-performing campaigns exceeding 4% to 7%.
- Google’s growing use of AI and machine learning has shifted campaign management away from manual bidding and toward automated optimization.
- Mobile shopping behavior continues to drive Shopping campaign growth as more consumers complete purchases directly from smartphones.
Google Shopping Market Size and Growth Statistics
- Google’s advertising revenue reached approximately $264.5 billion in 2024, up from $237.86 billion in 2023.
- Industry forecasts expect Google’s ad business to surpass $300 billion in annual revenue by 2026.
- More than 8.5 billion searches occur every day on Google, providing enormous product discovery opportunities.
- Google remains the world’s largest PPC platform with approximately 80.2% market share.
- E-commerce brands allocated approximately 23.03% of total digital ad spending to Google Ads in 2025, second only to Meta.
- The average Search CPC increased by 12% year over year in 2026, reflecting growing advertiser competition.
- Around 87% of industries experienced higher advertising costs during 2025.
- Median cost per acquisition rose by 12.35% in 2025, demonstrating increasing competition for customer acquisition.
- Shopping campaigns still remain cost-efficient because their CPC rates are approximately 40% to 55% lower than standard Search campaigns.
Google Shopping Share of Retail Search Ad Spend
- Google Ads accounted for approximately 23.03% of total digital advertising spend among e-commerce brands in 2025.
- Google continues to dominate the PPC market with an 80.2% share globally, giving Shopping ads substantial retail reach.
- Analysts estimate that retail advertisers continue to increase Shopping investment because of strong purchase intent and measurable returns.
- Google’s average ROI data shows businesses generate roughly $8 in revenue for every $1 spent on Google Ads.
- Median Google Ads ROAS stood near 3.68x in 2025, despite higher acquisition costs.
- Shopping campaigns produced a median ROAS of approximately 2.88x in 2025 benchmark studies.
- Search campaigns still delivered the highest median ROAS at 5.17x, creating strong competition for retail budgets.
- Performance Max campaigns generated approximately 2.57x median ROAS, encouraging retailers to diversify Shopping investments.
- Rising CPCs and declining efficiency prompted many brands to rebalance spending between Shopping, Search, and social advertising channels during 2025.
Google Shopping Click-Through and Engagement Rates
- The average Google Shopping CTR reached 0.86% globally in 2026.
- Strong Shopping campaigns generally achieve CTR above 1.2%, while top-performing advertisers can exceed 4% in niche categories.
- Benchmark data suggests standard e-commerce Shopping campaigns typically deliver 1% to 2% CTR.
- Automotive Shopping campaigns achieved an average 1.2% CTR in 2025 benchmark studies.
- Home and furniture retailers reported an average Shopping CTR of approximately 0.90%.
- Pet supply advertisers generated an average Shopping CTR of approximately 0.68%.
- Average Search campaign CTR across all industries measured around 3.41% in 2026, considerably higher than Shopping campaigns due to keyword intent.
- The travel and hospitality industry produced one of the highest Search CTRs at 4.68%.
- Average CTR across Google Ads declined slightly by around 1% year over year, indicating increasing competition for user attention.
US Google Shopping Ads Impression Share
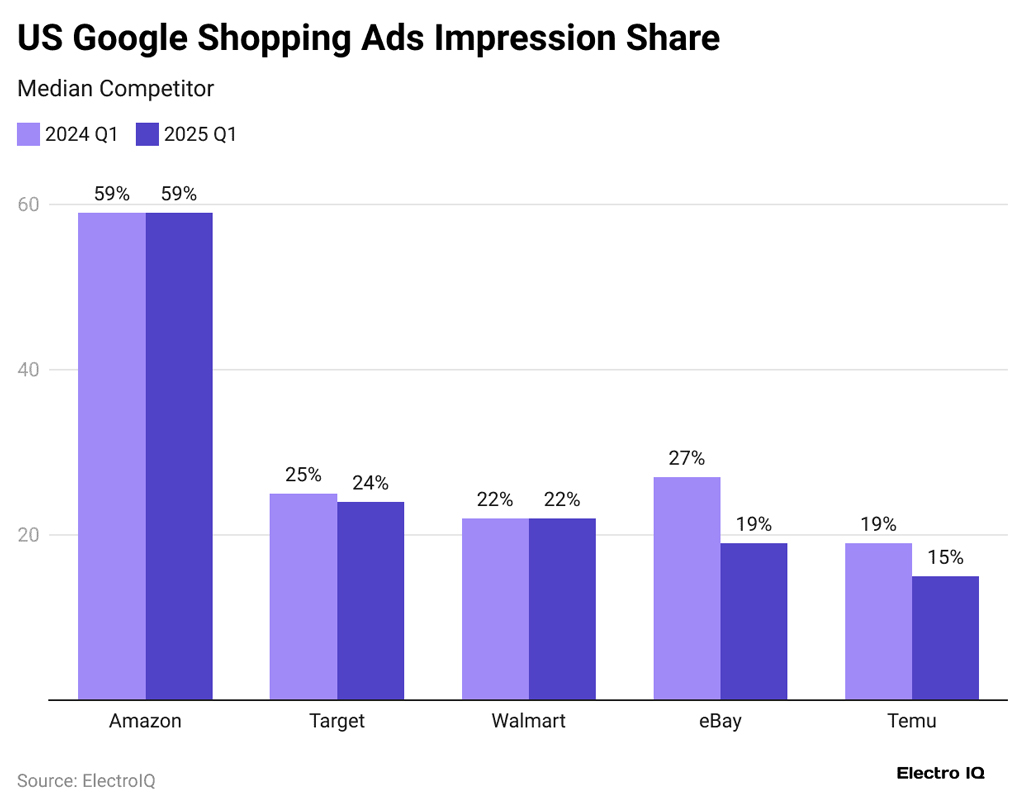
- Amazon maintained the highest impression share at 59% in both 2024 Q1 and 2025 Q1, showing no year-over-year change.
- Target’s impression share declined slightly from 25% in 2024 Q1 to 24% in 2025 Q1.
- Walmart held a steady 22% impression share across both quarters, indicating consistent ad visibility.
- eBay recorded the largest decline, falling from 27% in 2024 Q1 to 19% in 2025 Q1, an 8 percentage point drop.
- Temu also experienced a notable decrease, with its impression share dropping from 19% to 15% year over year.
- Amazon remained the clear market leader, with an impression share more than double that of every other competitor.
- Among the five retailers, only Amazon and Walmart maintained unchanged impression shares between 2024 Q1 and 2025 Q1.
- The combined data suggests greater stability for Amazon and Walmart, while eBay and Temu lost visibility in Google Shopping Ads.
- Target continued to rank as the second strongest competitor despite its 1 percentage point decline.
- The 2025 Q1 rankings were Amazon (59%), Target (24%), Walmart (22%), eBay (19%), and Temu (15%).
Google Shopping Revenue and Sales Statistics
- Google’s advertising business generated approximately $264.59 billion in revenue in 2024, up from $237.86 billion in 2023, reflecting continued growth in search and Shopping advertising demand.
- Analysts expect Google’s ad revenue to exceed $300 billion by 2026, supported by AI-driven campaign automation and retail advertising growth.
- Businesses earn an average of $8 in revenue for every $1 spent on Google Ads, making Shopping campaigns one of the most profitable acquisition channels for e-commerce brands.
- E-commerce advertisers recorded a median 3.68x return on ad spend (ROAS) from Google campaigns in 2025.
- Retail brands using optimized Shopping campaigns often generate 5x to 8x ROAS, especially in consumer electronics and home goods categories.
- U.S. e-commerce sales surpassed $1.19 trillion in 2024, creating a larger addressable market for Google Shopping advertisers.
- Online retail sales are projected to reach $1.35 trillion in the United States by 2026, increasing demand for product listing ads and Shopping campaigns.
- Shopping ads continue to account for a substantial share of retail search revenue because users who click product listings generally display higher purchase intent than general search users.
- More than 70% of online shoppers begin their buying journey through search, reinforcing Google’s role in product discovery and sales generation.
Google Shopping Adoption by E-commerce Brands
- More than 7 million businesses worldwide actively advertise on Google, including retailers running Shopping campaigns.
- Approximately 80% of U.S. retailers use Google Ads products as part of their digital acquisition strategy.
- Google Ads represented 23.03% of total digital advertising spend among e-commerce brands in 2025.
- Small and midsize retailers increased Google Shopping investment by nearly 18% year over year in 2025 to offset rising customer acquisition costs on social platforms.
- Nearly 65% of online retailers now use automated campaign formats such as Performance Max alongside Shopping ads.
- More than 60% of merchants rely on product feeds from Merchant Center as their primary inventory advertising channel.
- Fashion and apparel brands remain among the largest users of Shopping campaigns because visual product ads improve click and conversion rates.
- Direct-to-consumer brands increased Shopping ad budgets by approximately 15% in 2025, reflecting confidence in Google’s ability to drive high-intent traffic.
- Retailers using Shopping ads with product ratings and reviews reported significantly higher engagement compared with brands that omitted trust signals.
Google Shopping Budget, CPC, And CTR Statistics by Industry
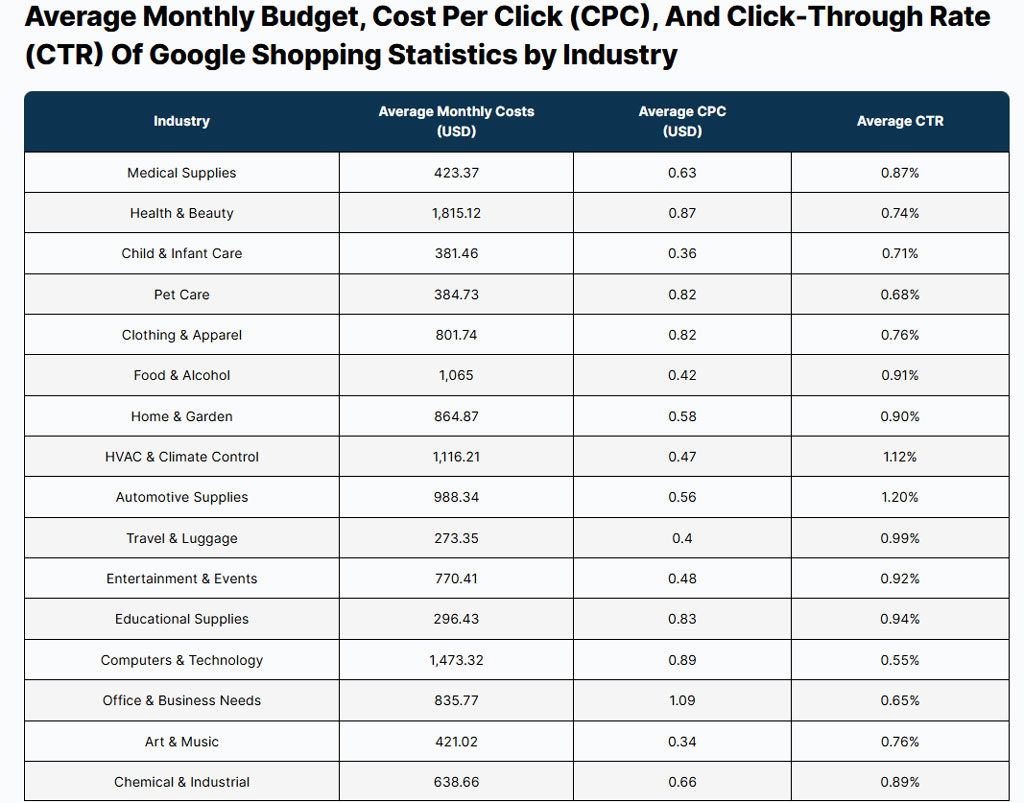
- Health & Beauty recorded the highest average monthly budget at $1,815.12 among all industries.
- Computers & Technology ranked second in monthly ad spend with an average budget of $1,473.32.
- HVAC & Climate Control businesses spent an average of $1,116.21 per month on Google Shopping campaigns.
- Food & Alcohol advertisers allocated an average monthly budget of $1,065.00.
- Travel & Luggage had the lowest average monthly budget at just $273.35.
- Office & Business Needs recorded the highest average CPC at $1.09 per click.
- Computers & Technology followed with a relatively high average CPC of $0.89.
- Health & Beauty reported an average CPC of $0.87, one of the highest across industries.
- Art & Music had the lowest average CPC at just $0.34.
- Automotive Supplies achieved the highest average CTR at 1.20%.
- HVAC & Climate Control followed closely with a strong CTR of 1.12%.
- Travel & Luggage maintained a competitive CTR of 0.99% despite its low advertising budget.
- Educational Supplies generated a healthy CTR of 0.94% with a modest monthly spend of $296.43.
- Entertainment & Events recorded an average CTR of 0.92%, outperforming several higher-spending industries.
- Computers & Technology posted the lowest CTR at 0.55%, despite having one of the highest advertising budgets.
- Pet Care also experienced a relatively low CTR of 0.68%, with an average CPC of $0.82.
Geographic Expansion of Google Shopping Ads
- Google Shopping ads are currently available in more than 100 countries globally.
- The Asia-Pacific region accounts for nearly one-third of global e-commerce sales.
- Global cross-border e-commerce sales are projected to exceed $7.9 trillion by 2030.
- Latin American e-commerce sales grew by more than 20% year over year.
- India is expected to surpass 500 million online shoppers by 2030.
- The United States is home to 50% of all e-commerce sites globally.
- Google Merchant Center expanded to support 15 new countries and 7 local languages in 2026.
- Utilizing a certified CSS partner in new regions saves advertisers up to 20% on click prices.
- Global retail e-commerce sales are forecast to reach $7.41 trillion in 2026.
- Over 52% of online shoppers actively look for products on international websites.
Cost-Per-Click and Cost-Per-Acquisition Benchmarks
- The average Google Shopping CPC reached approximately $0.66 globally in 2026.
- Typical Shopping CPCs remain 40% to 55% lower than standard Search campaign costs.
- Across all industries, average Google Search CPC increased by approximately 12% year over year in 2026.
- Median cost per acquisition (CPA) for Google Ads increased by around 12.35% in 2025.
- Shopping campaigns typically deliver CPA figures ranging from $38 to $65, depending on industry and competition.
- Consumer electronics campaigns frequently experience higher CPCs because of intense competition and higher average order values.
- Home and furniture retailers generally record lower CPCs and stronger efficiency than apparel advertisers.
- Automated bidding strategies reduced CPA by approximately 18% for many retailers adopting machine learning optimization.
- Retailers using audience segmentation and first-party data generally report lower acquisition costs than advertisers using broad targeting.
Mobile Usage and Performance on Google Shopping
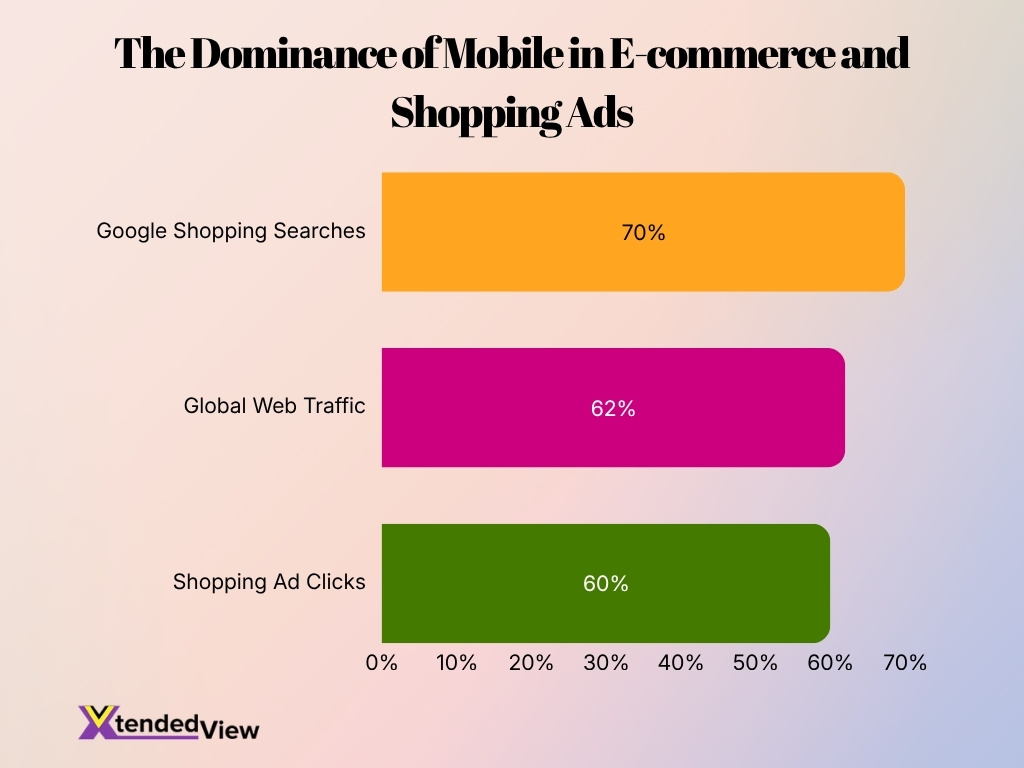
- Mobile devices account for approximately 62% of global web traffic in 2026, directly influencing Shopping campaign performance.
- More than 70% of Google Shopping searches now occur on smartphones and tablets.
- Mobile commerce is projected to generate nearly $710 billion in U.S. retail sales during 2026.
- Retailers report that over 60% of Shopping ad clicks originate from mobile devices.
- Mobile Shopping campaigns generally achieve lower CPCs than desktop campaigns, averaging around $0.55 to $0.70 per click.
- Consumers spend an average of 4 hours and 30 minutes per day on mobile devices, increasing opportunities for product discovery.
- More than 53% of mobile users abandon websites that take longer than three seconds to load, making mobile optimization essential for Shopping campaigns.
- Retailers with mobile-optimized landing pages report conversion improvements of 20% or more compared with poorly optimized experiences.
- Shopping campaigns with fast-loading mobile pages often generate higher Quality Scores and lower acquisition costs.
Average Return on Ad Spend From Google Shopping Campaigns
- Businesses generate an average of $8 in revenue for every $1 spent on Google advertising.
- The median Google Ads ROAS reached approximately 3.68x in 2025.
- Shopping campaigns delivered a median ROAS of around 2.88x, in industry benchmarks.
- Top-performing retailers consistently achieve 6x to 8x ROAS from highly optimized Shopping campaigns.
- Brands using audience signals and first-party data often improve ROAS by 20% or more.
- Automated bidding strategies have helped retailers increase ROAS while reducing manual campaign management.
- Performance Max campaigns generated approximately 19% higher ROAS than Standard Shopping campaigns.
- Rising advertising costs caused median Google Ads ROAS to decline by nearly 10% in 2025, increasing pressure on retailers to optimize spending.
- Retailers that continuously improve product feed quality and pricing competitiveness generally report stronger long-term ROAS performance.
Performance Max vs Standard Shopping Campaign Results
- Performance Max campaigns generated approximately 19% higher return on ad spend (ROAS) than Standard Shopping campaigns in 2025 and early 2026 benchmark studies.
- Advertisers using Performance Max recorded a 14% increase in conversion rates compared with Standard Shopping campaigns.
- Performance Max campaigns achieved around 20% more impressions and conversion value at a similar cost per action, according to Google’s reported benchmarks.
- Retailers that adopted Performance Max reported an average 18% increase in incremental conversions while maintaining similar budgets.
- More than 65% of e-commerce advertisers now run Performance Max campaigns alongside or instead of Standard Shopping campaigns.
- Standard Shopping campaigns continue to offer greater control over search terms and product segmentation, making them popular among large retailers with complex catalogs.
- Performance Max uses machine learning across Search, Shopping, YouTube, Display, Gmail, and Maps, allowing advertisers to reach customers across multiple channels from a single campaign.
- Retailers using first-party customer data and audience signals in Performance Max campaigns frequently achieve double-digit improvements in ROAS.
- Despite automation benefits, many brands still maintain Standard Shopping campaigns for testing, inventory control, and keyword-level reporting.
Conversion Rate Statistics for Google Shopping Ads
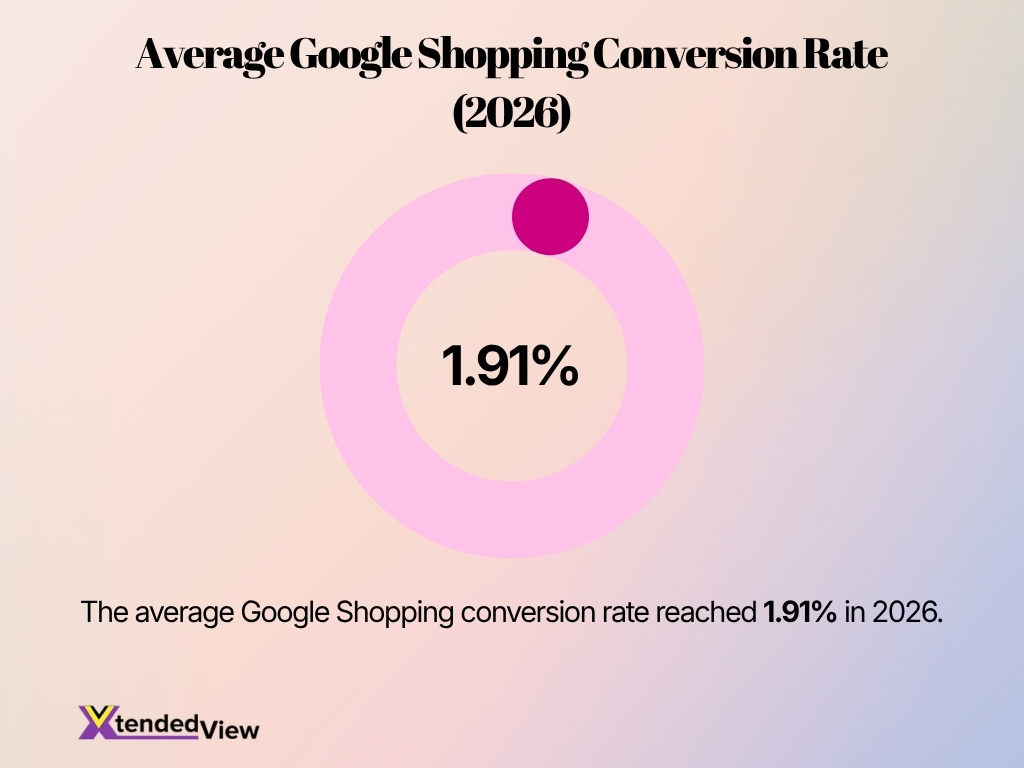
- The average Google Shopping conversion rate reached 1.91% in 2026.
- Top-performing Shopping campaigns frequently achieve conversion rates between 4% and 7%.
- Retail campaigns with optimized product feeds outperform average benchmarks by more than 50%.
- Campaigns featuring customer ratings and reviews experience conversion improvements of up to 15%.
- Mobile-optimized landing pages improve Shopping conversion rates by approximately 20%.
- Performance Max campaigns produce conversion rates 14% higher than Standard Shopping campaigns.
- Combining Shopping campaigns with remarketing yields stronger conversion performance than prospecting alone.
Audience Targeting and Remarketing Statistics for Shopping Ads
- Remarketing campaigns can improve conversion rates by up to 161% compared with standard prospecting campaigns.
- Consumers who see retargeted ads are approximately 70% more likely to convert than first-time visitors.
- Retailers using audience segmentation in Shopping campaigns report 20% to 30% higher ROAS than advertisers using broad targeting.
- Customer Match campaigns powered by first-party data often generate significantly lower acquisition costs than campaigns targeting new audiences only.
- More than 80% of marketers consider first-party data a critical component of future advertising strategies due to tightening privacy regulations.
- Dynamic remarketing campaigns frequently deliver 2x higher click-through rates than standard display retargeting ads.
- Shoppers who revisit a retailer’s website after seeing a remarketing ad generally have a much higher average order value than first-time visitors.
- E-commerce brands that segment audiences by purchase behavior and product interest often experience higher engagement and stronger conversion performance.
- Google continues to expand AI-powered audience signals, enabling advertisers to identify new customers who resemble existing high-value buyers.
Product Ratings, Reviews, and Trust Signals Statistics
- Product listings that include reviews can receive up to 35% higher click-through rates than listings without ratings.
- Approximately 98% of consumers read online reviews before making a purchase decision.
- Around 49% of shoppers trust online reviews as much as personal recommendations from friends and family.
- Products with ratings of 4 stars or higher generally experience significantly better conversion performance than lower-rated listings.
- More than 90% of consumers say that positive reviews influence their purchasing decisions.
- Retailers displaying product ratings in Shopping ads often report conversion improvements of 10% to 15%.
- About 76% of consumers pay attention to recent reviews when evaluating products online.
- Product listings with multiple images, reviews, and detailed descriptions tend to receive stronger engagement and lower bounce rates.
- Trust signals such as free shipping, return policies, and seller ratings continue to improve Shopping campaign performance across retail categories.
Impact of Campaign Automation and AI on Results
- More than 80% of advertisers currently use at least one automated bidding strategy.
- Automated bidding can increase conversions by 20% or more compared to fully manual approaches.
- Performance Max campaigns generate approximately 18% more conversions at a similar cost per action.
- Marketers save an average of 30% of their time by utilizing AI automation for campaign management.
- AI-powered campaigns typically deliver a 35% higher return on ad spend than traditional setups.
- Utilizing AI-generated creative assets increases click-through rates by up to 15% for retail advertisers.
- Predictive audience targeting improves conversion rates by roughly 25% by reaching high-intent users in real-time.
- Retailers adopting AI-powered bidding report up to a 12% reduction in cost per acquisition.
Frequently Asked Questions (FAQs)
The average Google Shopping ad click-through rate (CTR) is 0.86% globally in 2026.
The average Google Shopping cost per click (CPC) is approximately $0.66 per click in 2026, although top-performing campaigns often achieve lower costs.
Google Shopping campaigns deliver an average 1.91% conversion rate, while leading retailers can exceed 5% conversion rates.
The average Google Shopping campaign generates around 3x to 4x ROAS, while top-performing advertisers can achieve 8x or higher returns.
More than 7 million businesses worldwide actively advertise through Google Ads, including merchants running Google Shopping campaigns.
Conclusion
Google Shopping remains one of the most influential advertising channels for e-commerce brands. The platform continues to benefit from Google’s enormous search reach, growing mobile commerce, and expanding use of artificial intelligence. Retailers increasingly rely on Shopping campaigns because they deliver high-intent traffic, measurable sales results, and scalable customer acquisition opportunities.
At the same time, the advertising landscape has become more competitive. Rising costs, increased automation, and evolving privacy standards require brands to focus on product feed quality, first-party data, audience targeting, and campaign optimization. Businesses that embrace AI-driven tools such as Performance Max and continuously improve customer experiences will likely capture a larger share of online retail growth in the years ahead.
