
The internet now reaches billions around the world and continues to reshape commerce, education, and daily life. In sectors such as finance, companies rely on real‑time connectivity and online payment systems, in education, institutions deliver remote learning at scale thanks to expanding broadband access. This article presents key statistics to help you understand the scope, trends and implications of global internet usage.
Editor’s Choice
- At the start of 2025, approximately 5.64 billion people, or about 68.7% of the global population, were using the internet.
- Internet user numbers increased by roughly +2.6% (≈144 million new users) over the past year.
- The global internet penetration rate stood at 67.9% in early 2025.
- The region with the highest penetration rate is Northern Europe (97.7%), and the region with the lowest is East Africa (28.5%) in 2025.
- In the United States, there were about 322 million internet users, giving a penetration rate of 93.1% in early 2025.
- Annual growth of internet users has slowed compared to earlier years, with many markets approaching saturation.
- Despite growth, approximately 2.58 billion people worldwide remain offline at the start of mid‑2025.
Recent Developments
- Global online population reached 5.65 billion by July 2025, implying a penetration rate of 68.7%.
- Growth in internet users during 2024 was about +136 million (+2.5%).
- A key factor driving growth: mobile data cost declines and rising smartphone adoption in developing regions.
- Broadening of internet usage across more devices (smartphones, tablets, smart TVs) is shifting behaviour.
- Internet infrastructure investments (5G, fibre, satellite) are enabling access in previously underserved areas.
- The “offline” population of 2.6 billion continues to concentrate in lower‑income regions, illustrating the digital divide.
- In high‑income countries, penetration now exceeds 90%, shifting growth focus to emerging markets.
- Some threshold effects, as penetration increases, incremental user growth slows and shifts toward deeper usage rather than new users.
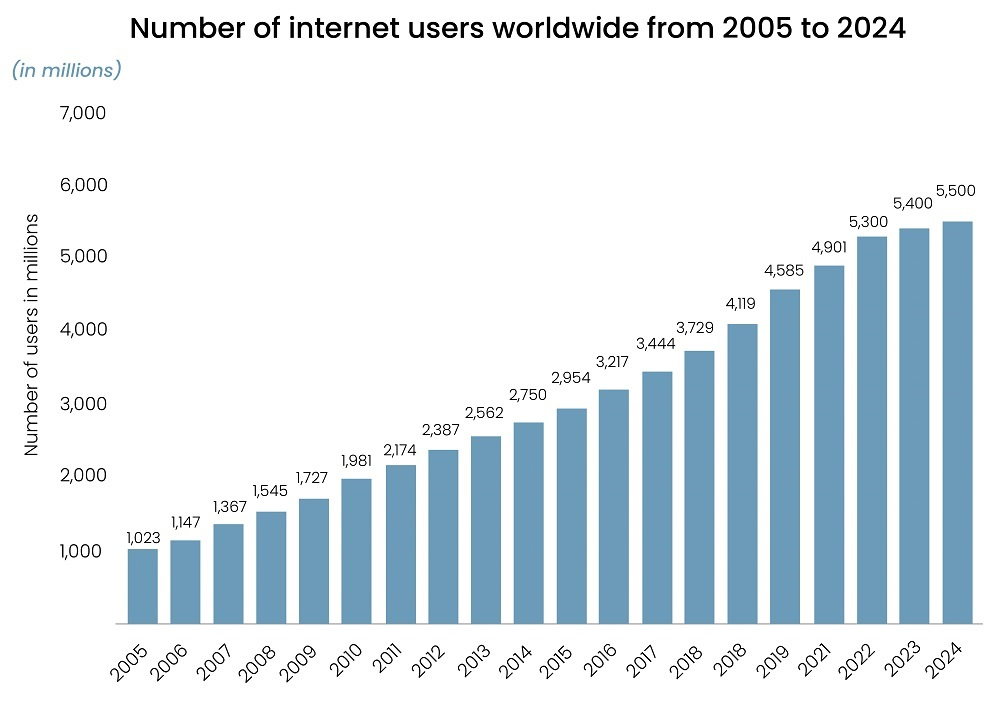
Global Internet Usage Growth
- The number of internet users worldwide has shown a steady increase from 2005 to 2024.
- In 2005, there were 1.02 billion internet users globally.
- By 2010, this number had almost doubled to 1.98 billion.
- Rapid growth occurred throughout the 2010s, reaching 3.44 billion users in 2017.
- In 2020, internet usage surged past 4 billion, reaching 4.12 billion, likely accelerated by the COVID-19 pandemic and the global shift to digital connectivity.
- The trend continued upward, hitting 5.3 billion users in 2022.
- By 2024, the estimated global number of internet users reached 5.5 billion, representing over two-thirds of the world’s population.
- From 2005 to 2024, the total increase was approximately 4.5 billion new users, a growth of over 430% in less than two decades.
- The average annual growth rate has slowed in recent years, suggesting that global internet adoption is approaching saturation in many regions.
- This long-term expansion highlights the transformative impact of digital technology, mobile internet access, and global infrastructure improvements.
Growth of Internet Users Over the Years
- The count of global internet users nearly doubled in the past decade, by 2025 5.6 billion users, up from 3 billion in the mid‑2010s.
- The annual growth rate in recent years is around +2.5% to +2.7%.
- Between 2019 (53% penetration) and early 2025 (68%), the share of the global population using the internet increased 15 percentage points.
- Growth in certain regions (low‑income) remains stronger than in mature markets, reflecting “last mile” potential.
- Despite high overall numbers, the number of new users added each year is declining in percentage terms as saturation approaches.
- The growth via mobile access (smartphones) has overshadowed fixed‑line growth in many regions.
- Earlier in the internet’s history, growth rates were much higher; the slower pace today reflects global scale and saturation in advanced markets.
- The next wave of growth is expected to come from under‑connected regions like Africa, South Asia and rural areas through mobile and satellite access.
Internet Usage Demographics (Age & Gender)
- In the U.S., about 98% of adults aged 30‑49 access the internet, and those over 65 access at 88%.
- Among U.S. adults, roughly 97% of women and 96% of men use the internet.
- Although comprehensive global age‑gender breakdowns for 2025 are sparse, older age groups and women in some regions still lag younger cohorts.
- Young adults (18‑29) typically show the highest rates of internet use and device adoption.
- The gender gap in internet access has narrowed significantly in high‑income countries. In the U.S., male/female rates are nearly equal.
- In lower‑income countries, age and gender divides remain more pronounced, often tied to device affordability or connectivity access.
- Educational level often correlates with higher internet use; the more formal the schooling, the higher the adoption rate.
- Rural residents and older age groups tend to have lower internet access compared with younger urban residents.
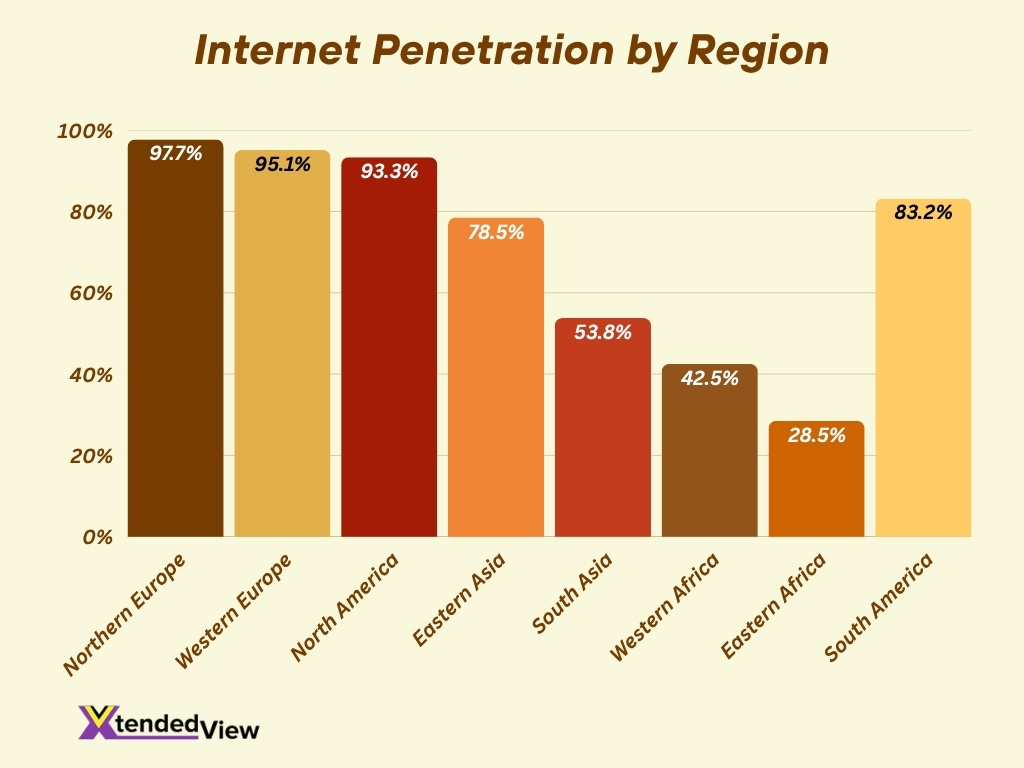
Internet Penetration by Region
- Northern Europe: 97.7% of the population are internet users.
- Western Europe: 95.1% penetration.
- North America: 93.3% penetration.
- Eastern Asia: 78.5% penetration.
- South Asia: 53.8% penetration, the lowest among major regions.
- Western Africa: 42.5% penetration.
- Eastern Africa: 28.5% penetration, showing major gaps.
- South America: 83.2% penetration.
- These figures highlight substantial regional disparity in internet access and adoption.
Top Countries by Number of Internet Users
- China leads globally with over 1.11 billion internet users in 2025.
- India is the second‑largest, with about 881 million users in early 2025.
- The United States has around 322 million internet users, reflecting a penetration rate above 90%.
- Indonesia reported around 212 million internet users, ranking high globally.
- Brazil counts approximately 183 million internet users, placing it fifth worldwide.
- Russia is reported to have about 133 million users and 92% penetration in some sources.
- Many smaller nations achieve near‑universal access; for example, the United Arab Emirates, Qatar, and Kuwait all report 100% internet penetration.
- Although user numbers are highest in large‑population countries, some smaller high‑income nations achieve higher penetration rates than the big numbers alone suggest.
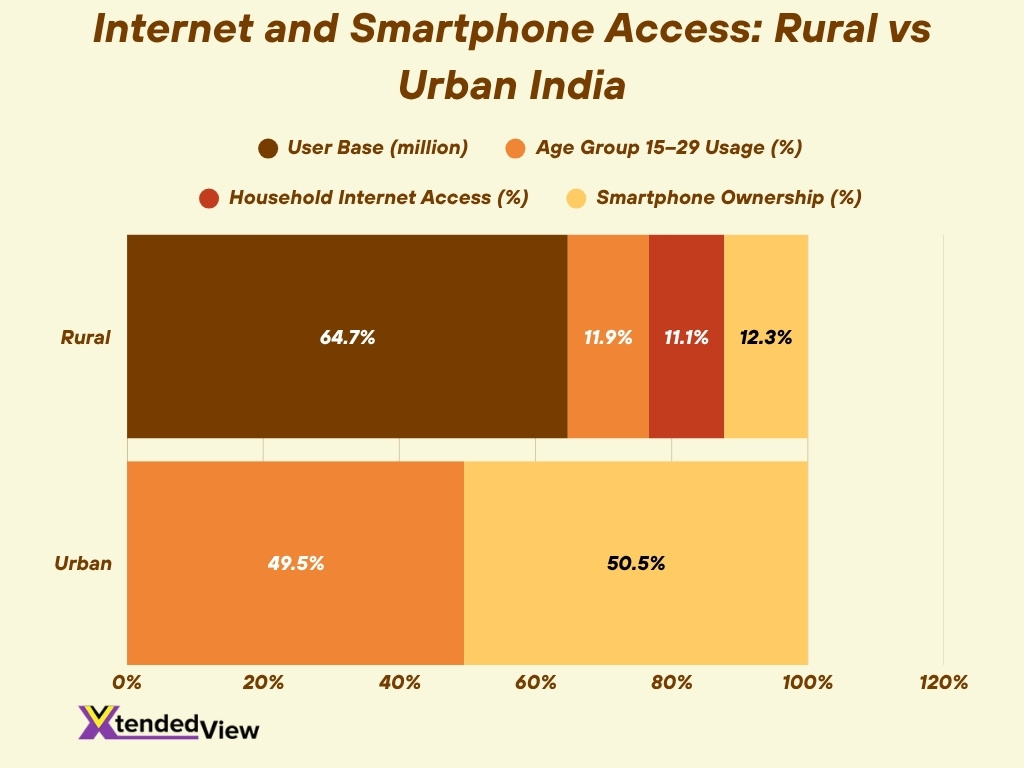
Urban vs. Rural Internet Usage
- In India, rural internet users are projected to reach over 504 million by 2025, surpassing urban user growth.
- In the Indian rural age group 15‑29 years, 92.7% used the internet at least once during the last three months (survey Jan–Mar 2025).
- In the same age group in urban India, the usage rate reached 95.7%.
- Globally, rural areas lag significantly. In Africa, rural internet usage is as low as 23%, compared with urban areas 57%.
- Household internet facility access in India, 86.3% of households had internet within the household premises as of Jan–Mar 2025.
- Smartphone ownership among mobile‑phone owners aged 15‑29 in rural India 95.5%, and in urban areas, 97.6%.
- The data underscores that device access and connectivity remain key gaps in rural zones, not just infrastructure alone.
- Growth in rural internet use is accelerating faster than in many urban markets, where saturation is nearing.
Mobile Internet Usage Trends
- As of 2025, over 64% of global website traffic comes from mobile devices.
- Roughly 96.3% of internet users access the internet via a mobile phone.
- Global average smartphone mobile‑data consumption per handset reached 21.6 GB/month by Q3 2024.
- Monthly global mobile data traffic reached an average of 157 exabytes in Q3 2024.
- In many emerging markets, mobile devices (smartphones) serve as the primary internet access point, rather than fixed‑line desktops.
- Mobile technologies and services generate 5.8% of global GDP, equating to $6.5 trillion in economic value in 2025.
- Mobile‑first architecture is now standard in many services (social media, streaming, e‑commerce) given device predominance.
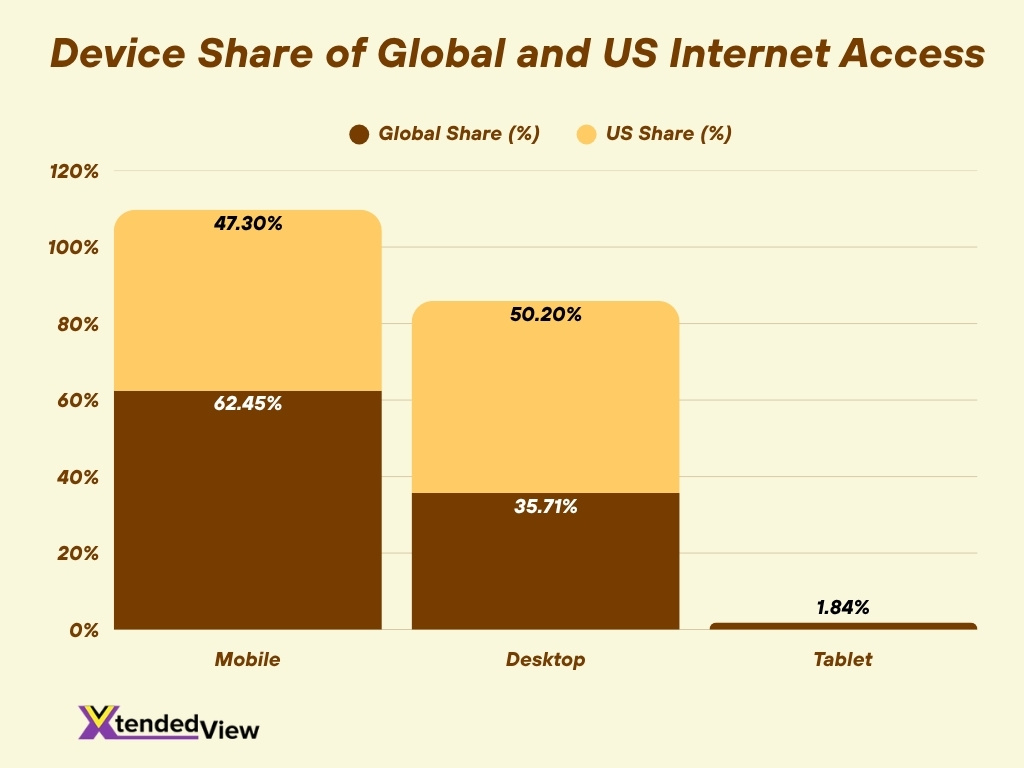
Devices Used for Internet Access
- By Q3 2024, 98% of global web access came from mobile users, and 97.8% of access was via smartphones.
- Mobile traffic share in the U.S. was 47.3% of web traffic, while desktop held 50.2%.
- Global device‑share for mobile internet traffic, 62.45% from mobile, 35.71% from desktop, 1.84% from tablet.
- In India, among 15‑29‑year‑olds in urban areas, 97.6% own a smartphone (among those who own a mobile phone).
- Tablets and smart TVs remain niche compared to mobile and desktop, and mobile continues to dominate access.
- The shift toward mobile access means websites and services increasingly prioritise mobile‑first design.
- Device fragmentation remains a challenge; across regions, users may shift between smartphones, laptops, and smart TVs depending on context and cost.
Average Daily Time Spent Online
- The average global adult internet user spends about 6 hours and 38 minutes online each day as of early 2025.
- That equates to roughly 33 hours and 27 minutes per week spent consuming online media.
- In the United States, the average screen time (internet‑connected devices) is around 6 hours and 40 minutes per day.
- Smartphone‑specific usage, on average, is 4 hours 37 minutes per day spent just using a phone.
- Internet‑connected screen time rose by 7.9% from 2013 to 2025.
- While the global average edged up only slightly (+2 minutes) from the prior year, it remains at record highs.
- For marketers and service providers, this increased time underscores the growing importance of the attention economy online.
Internet Connectivity & Broadband Access
- As of early 2025, 67.9% of the global population uses the internet.
- In India, smartphones are owned by 95.5% (rural) and 97.6% (urban) among 15‑29‑year‑olds.
- Household internet access in India, about 86.3% of households have internet access within their home premises.
- The global “offline” population remains about 2.6 billion people, the largest growth opportunities for connectivity.
- Next‑generation infrastructure (5G, fibre, satellite) is expanding in many emerging markets, boosting broadband access.
- Cost of data continues to fall in many regions, helping connectivity growth, e.g., India’s data cost per GB has scaled down dramatically in recent years.
- Despite higher connectivity in many places, access quality still varies widely; speed, latency, and cost remain differentiators.
Internet Speeds Worldwide
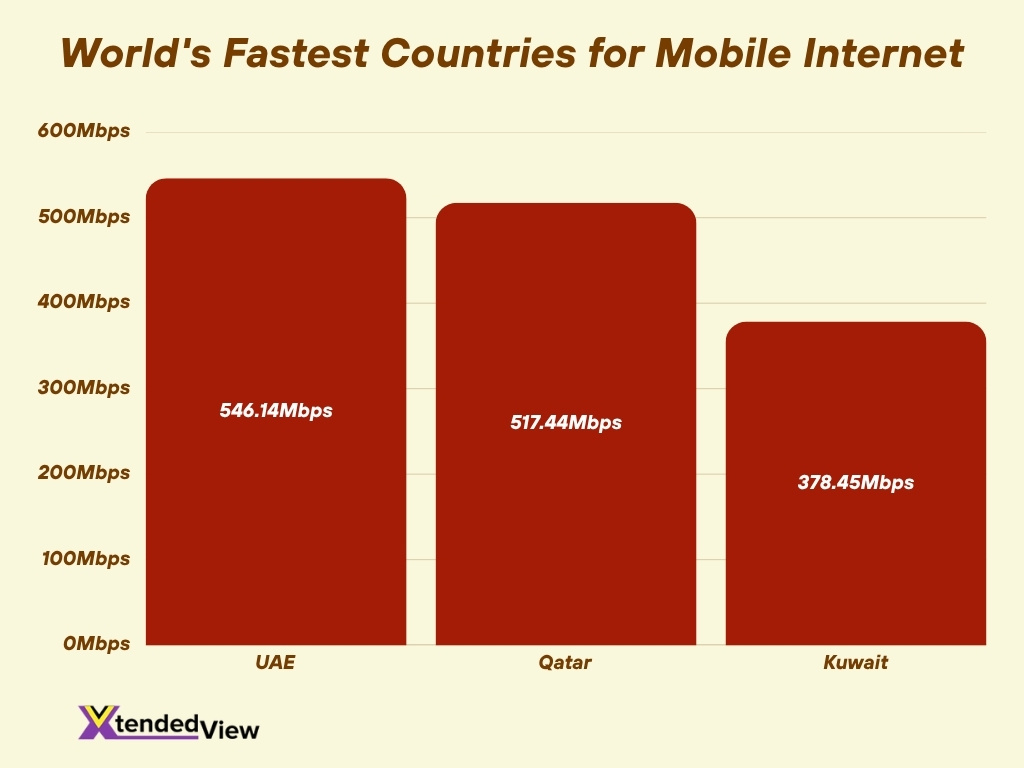
- The top country for mobile median internet speed in 2025 is the United Arab Emirates with 546.14 Mbps, followed by Qatar (517.44 Mbps).
- Kuwait ranks third with 378.45 Mbps median mobile speed.
- In many lower‑income regions, median speeds remain significantly lower, limiting richer online experiences.
- Fixed‑broadband speeds also vary widely across countries, influencing streaming, remote work, and education access.
- As infrastructure improves, countries with previously slow connectivity are experiencing faster speed gains year‑on‑year.
- Higher speeds correlate with higher consumer usage of video streaming, online gaming, and remote services.
- For service providers, ensuring speed and latency remain competitive is key to retaining user engagement.
Social Media Usage Statistics
- There are approximately 5.24 billion active social media user identities worldwide as of 2025, representing about 63.9% of the global population.
- Year‑on‑year social media user identity growth was around +4.1%.
- The average person spends around 2 hours and 24 minutes per day on social media globally.
- In the U.S., about 253 million social media user identities were recorded in January 2025, equivalent to 73% of the U.S. population.
- Among global internet users, the gender and platform split shows Facebook still leads with over 3.15 billion users and YouTube with 2.5 billion.
- Younger age groups dominate usage, and adults aged 18‑29 report among the highest social media participation levels.
- More than 46% of Americans say they view more user‑generated content on social platforms than movies or TV.
- Social media platform growth continues; for example, messaging friends/family on TikTok has risen 58% since Q4 2021 in certain geographies.
- In many markets, social commerce (shopping via social platforms) is becoming increasingly important for marketers and retailers.
- The majority of social media users now access these platforms via mobile devices, reinforcing the mobile‑first shift.
E‑commerce and Online Shopping Trends
- Global e‑commerce retail sales are projected to reach approximately $7.4 trillion in 2025.
- Another estimate puts online commerce sales at $8.3 trillion in 2025, indicating growth of more than 55% since 2021.
- In the U.S., e‑commerce sales in the second quarter of 2025 totalled about $292.9 billion and accounted for 16.3% of total retail sales.
- Online shopping participation around 2.77 billion people are expected to be online shoppers worldwide by 2025.
- In global online shopping trends, women shop online at slightly higher rates (≈72%) than men (≈68%), according to some sources.
- Mobile commerce (m‑commerce) continues to rise; in 2023, 72% of global e‑commerce sales derived from mobile devices, and the share is expected to increase further.
- Discovery of products via search remains critical; about 63% of global online shoppers begin their online product journey via Google search.
- New technologies influencing e‑commerce in 2025 include AI‑driven personalisation, AR try‑on experiences, voice commerce, and social shopping.
- Marketplaces continue to dominate, and retail‑media investments (internal brand advertising on e‑commerce sites) are growing; 44% of innovation leaders cited retail media as their top e‑commerce investment priority.
- The rate of growth in e‑commerce is slowing in many mature markets, e.g., global retail‑ecommerce sales growth is forecast to decelerate in 2025.
Digital Payments and Fintech Adoption
- Globally, more than 78% of internet users in 2025 use at least one fintech service monthly.
- Fintech adoption in the U.S. reached 74% in Q1 2025.
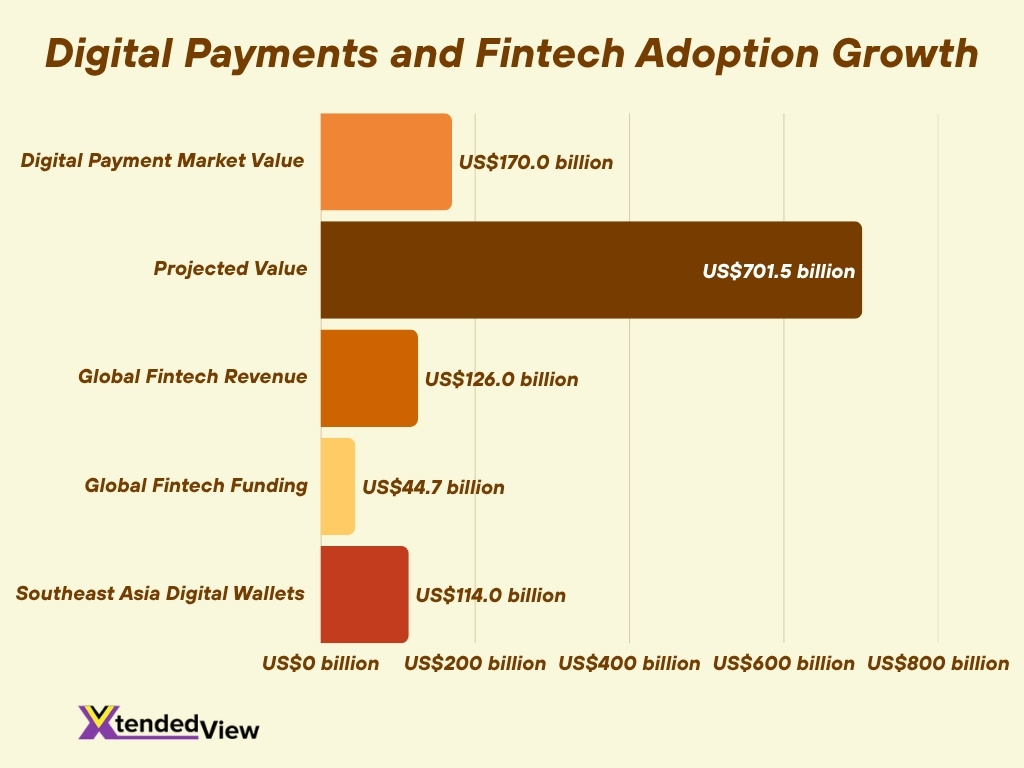
- The global digital payment market size is estimated at around $170 billion in 2025, and projected to hit around $701.5 billion by 2034 (CAGR 17.1%).
- Global fintech revenues in payments (scaled fintech) reached $126 billion in 2024 and continue to expand.
- Fintech industry revenues are expected to grow almost three times faster than traditional banks (fintech 15% CAGR vs traditional banking 6%) between 2022-28.
- In H1 2025, global fintech funding recorded $44.7 billion across 2,216 deals.
- In Southeast Asia, digital wallet payments are expected to exceed $114 billion by 2025.
- Fintech segments breakdown, digital payments account for 34% of firms’ responses in a WEF‑2025 study, followed by digital lending (21%), and insurtech (18%).
- Money transfer and payment adoption rates are 75% in many markets; overall fintech adoption was 64% as of 2023.
- B2B payments and real‑time payment infrastructures are identified as major growth areas in 2025.
Internet Privacy and Cybersecurity Trends
- Worldwide cybercrime costs are estimated to reach $10.5 trillion annually by 2025.
- Ransomware was involved in about 44% of data breaches in 2025, with a median ransom figure of $115,000.
- The global average cost of a data breach in 2024 was $4.88 million, marking a 10% increase year‑on‑year.
- Around 86% of organisations had adopted some form of “zero trust” model by 2025.
- Global cybersecurity spending was projected to grow by 12.2% in 2025.
- About 85% of global adults say they want to do more to protect their online privacy.
- In a global survey, 9 in 10 Americans believe online privacy is important, yet only 64% use tools such as ad blockers or password managers.
- Third‑party or vendor breach involvement doubled, with about 30% of data breaches involving a partner or external service in 2025.
- Supply‑chain attacks and software vendor vulnerabilities are increasingly common initial vectors (20% of breaches).
- The gap between threat sophistication (e.g., generative‑AI attacks) and organisational readiness remains wide; only 37% of organisations have processes to assess AI tool security.
Education & Online Learning Statistics
- As of early 2025, adult internet users worldwide spend on average 6 hours 38 minutes per day online, which includes education and learning activities.
- Online learning platforms, MOOCs, and hybrid education models gained further traction in 2024‑25 as internet access broadened; for instance, smartphone‑only households rose to 22% in the U.S., underlining the need to design learning for mobile.
- Teenagers in developed nations now spend over 7.6 hours per day online in 2025, with a significant portion of that time dedicated to educational and skill‑development content.
- The number of people using the internet for staying in touch with friends and family surpassed the share using it for “finding information” in the 16‑34 age group. This shift also supports peer‑learning and online collaboration in education.
- In emerging economies, increased broadband access and mobile penetration have enabled remote learning. More than 60% of internet users cite staying in touch or educational use as a major online motivation.
- Educational institutions worldwide are incorporating e‑learning and blended models, and programs aimed at digital literacy are increasingly targeting rural and under‑connected areas.
- The shift in online time‑use is leading platforms to offer shorter, mobile‑optimised learning modules and micro‑courses tailored for the 18‑34 demographic.
- Demand for lifelong learning and up‑skilling via internet platforms is rising, in many markets, >50% of workers plan to take at least one online skill course in 2025.
- Internet speed and connectivity quality remain key constraints in parts of the world, regions with median mobile speeds <50 Mbps still limit the viability of high‑quality video‑based online learning.
- Ongoing digital inclusion efforts are critical, despite gains; billions remain offline or in low‑bandwidth regimes, impacting the reach of online education initiatives.
Future Trends and Predictions in Internet Usage
- Growth of global internet users is projected to slow further as advanced markets approach saturation; most future growth will come from rural and lower‑income regions.
- Mobile‑first and smartphone‑only households will continue increasing. In 2025, many emerging markets report >90% of internet users accessing via smartphones.
- The rise of AI‑driven services (e.g., personalised learning, voice search, AR/VR experiences) will become standard online‑usage components, not just novel features.
- Internet traffic from streaming, cloud‑based services, and connected devices will grow, further emphasising broadband capacity, latency, and infrastructure improvements.
- Advanced payment and fintech services will integrate with internet usage more deeply (e.g., embedded finance, real‑time payments, super‑apps).
- Privacy and cybersecurity pressures will escalate, as more everyday services move online, users and regulators alike will demand stronger protections, zero‑trust architectures, and regulatory oversight.
- The digital divide (rural/urban, developed/developing) will remain a challenge; closing this gap will be a major focus of international development and national infrastructure policies.
- The concept of “internet usage” will expand beyond browsing and social media to include IoT devices, smart‑home connectivity, and connected services across daily life.
- Sustainability concerns will enter internet‑usage debates, with high data‑use, streaming, and device‑turnover, energy‑efficiency, e‑waste, and carbon footprints will become part of internet‑usage narratives.
- Overall, the internet in 2025 and beyond will be less about simply being connected and more about how you are connected, what you do online, and how deeply services are integrated into everyday life.
Frequently Asked Questions (FAQs)
About 5.56 billion, equal to roughly 67.9% of the global population.
Around 64.35% of global web traffic originates from mobile devices.
China leads with an estimated 1.11 billion internet users.
Northern Europe: approximately 97.9%; Eastern Africa: about 28.5%.
5G had a 35% share of mobile data traffic by the end of 2024, forecast to grow to 80% by 2030.
Conclusion
The internet landscape is defined by both scale and evolution. While more than two‑thirds of the world’s population is now online, the real story lies in how people use the connection, from mobile‑first access, booming fintech adoption, deepening social media engagement, to the pressing demands of privacy and cybersecurity. Across e‑commerce, education, and beyond, the growth now lies in depth rather than just breadth.
For businesses, policymakers, and consumers alike, understanding these trends is key to navigating the next phase of digital life. Dive into the full article for a comprehensive view of the numbers shaping internet usage today and tomorrow.