
Introduction
Apple continues to dominate the technology landscape through hardware, software, and services. The company is expanding its reach with more than 2.35 billion active devices globally, fueling its ecosystem across markets. Real‑world impacts are visible in sectors like mobile health (via Apple Watch) and subscription media (via Apple TV+ and Apple Music).
Editor’s Choice
Here are seven standout statistics that anchor this full article:
- Apple reported a record quarterly revenue of $124.3 billion in Q1 2025.
- In Q3 2025, revenue hit $94 billion, up 10 % year over year.
- Over 2.35 billion active devices are now in use worldwide.
- In 2024, Apple’s total annual revenue reached $391.04 billion.
- The Americas region generated about 42.72 % of Apple’s revenue in FY 2024.
- In Q2 2025, revenue was $95.4 billion, rising 5 % year over year.
- Apps and games on the App Store drove $1.3 trillion in developer billings in 2024.
These metrics set the stage. Now we’ll delve into Apple’s overview, revenue trends, and regional breakdowns.
Apple Overview & Key Facts
- Apple Inc. is a U.S.-based multinational technology company headquartered in Cupertino, California.
- Founded in 1976 by Steve Jobs, Steve Wozniak, and Ronald Wayne, Apple has grown into a global brand spanning hardware, software, and services.
- The company offers flagship product lines including iPhone, iPad, Mac, Apple Watch, and AirPods.
- Its services ecosystem includes the App Store, Apple Music, Apple TV+, iCloud, and more.
- Apple operates in more than 100 countries, with supply chain presence across Asia, Europe, and the Americas.
- It invests heavily in R&D and holds a large patent portfolio in consumer electronics.
- Its business model increasingly favors recurring revenue from services alongside hardware sales.
Apple Annual Revenue
- In fiscal year 2024, Apple’s annual revenue stood at $391.04 billion.
- That represented a growth of roughly 2.02 % from 2023, when revenue was $383.29 billion.
- In 2023, revenue had declined by –2.80 % from 2022’s $394.33 billion.
- The long‑term trend shows Apple steadily growing from ~$260 billion in 2019 to over $390 billion in 2024.
- The revenue curve has softened in recent years, but Apple continues to generate exceptional scale.
- Services (subscription, digital content) have become a higher-margin revenue stream compared to hardware.
- Apple’s diversification into wearables and accessories also cushions against hardware-only cyclicality.
Apple Quarterly Revenue
- In Q1 2025, Apple posted $124.3 billion, up 4 % year-over-year.
- Q2 2025 revenue was $95.4 billion, up 5 %.
- In Q3 2025 (quarter ending June 28, 2025), revenue hit $94 billion, up 10 %.
- Compared to the same quarter a year earlier, iPhone revenue grew ~13 %, Mac ~15 %, Services ~13 %.
- However, iPad revenue dropped ~8 % and Wearables/Home/Accessories revenue fell ~8–9 %.
- Across quarters, Apple’s revenue exhibits seasonality, strongest in Q1 (holiday quarter), weaker in mid‑year quarters.
- Exchange rate fluctuations and supply constraints also influence quarter-to-quarter results.
Apple Revenue Breakdown by Product
- In Q3 2025, iPhone revenue was approximately $44.6 billion, growing ~13.5 %.
- Services (including App Store, Apple Music, iCloud) contributed $27.4 billion, up ~13.3 %.
- Mac product line brought in $8.0 billion, growing ~14.8 %.
- Wearables, Home & Accessories saw revenue of $7.4 billion, down ~8.6 %.
- iPad revenue for the same quarter was about $6.6 billion, down ~8.1 %.
- In full‑year 2024, hardware (iPhone, Mac, iPad, wearables) remained the majority share of revenue.
- The Services and Other Products categories are growing in share over time, given their recurring nature.
- Apple’s newer menus like “Other Products” (AirPods, HomePod, etc.) add meaningful tail diversification.
Apple Revenue Breakdown by Region
- In fiscal year 2024, the Americas segment generated $167.05 billion, or ~42.72 % of total revenue.
- Europe contributed $101.33 billion, or ~25.91 %.
- Greater China revenue was $66.95 billion, ~17.12 %.
- Japan accounted for $25.05 billion, ~6.41 %.
- The rest of Asia Pacific added $30.66 billion, ~7.84 %.
- From 2023 to 2024, Europe saw ~7.46 % growth, while Greater China declined ~7.73 %.
- In Q1 2025, regional splits show North America, Europe, Greater China, and Japan contributing varying shares.
- Apple often sees stronger growth outside Greater China in recent quarters, due to competitive pressures in that region.
Apple Market Share (Global and Product‑wise)
- In Q1 2025, Apple’s global smartphone share rose to 19 %, up from ~16 % a year earlier.
- Apple held ~24.44 % of the mobile vendor market (mid‑2025).
- For iPads, Apple’s share in Q2 2025 was 33.1 %, down from 36.6 % in Q2 2024.
- In Q1 2025, Macs accounted for 8.7 % of the global PC/laptop/workstation market.
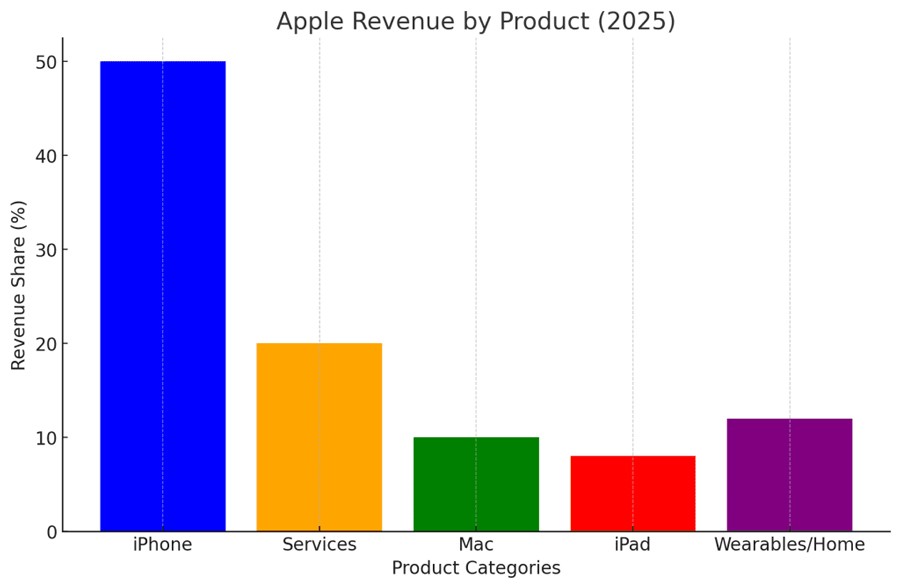
- In revenue share for Q1 2025, iPhone made ~49.12 %, Services ~27.94 %, Mac ~8.34 %, iPad ~6.71 %, leaving the rest to wearables/home.
- In fiscal 2024, iPhone itself was ~51.45 % of total Apple revenue, Services ~24.59 %.
- Apple dominates the premium smartphone segment; in 2025, it controlled ~62 % of that premium tier globally.
- Regionally, Apple leads in the U.S. (premium markets) and Japan, while in China and many developing regions, local brands exert strong pressure.
Number of Active Apple Devices Worldwide
- As of early 2025, Apple reported 2.35 billion active devices worldwide.
- That is a rise of ~150 million devices over the previous year (from ~2.2 billion).
- Since 2022, Apple added ~550 million active devices overall.
- Apple has not broken down exact counts for each category (iPhone, iPad, etc.) in the latest disclosure.
- The rising base slows marginal growth, suggesting saturation in developed markets.
- A large share of iPhone users also own at least one other Apple product (e.g., Watch, iPad), ~80 % is often cited.
- This broad base supports services and ecosystem retention.
- The device base is foundational to Apple’s recurring revenue from software, cloud, and services.
iPhone Annual Sales and Market Share
- In early 2025 (Q1), Apple shipped ~55 million iPhones, pushing global share to ~19 %.
- In April–May 2025, iPhone sales rose ~15 % year-over-year.
- In 2023, Apple shipped ~231 million iPhones globally.
- On a forecast basis, iPhone users in 2025 may number ~1.56 billion globally (≈20 % of population).
- In the U.S., iPhones dominate, with ~57 % of smartphone users.
- iPhones command a high premium segment share, maintaining pricing power vs volume brands.
- Apple regained the lead in China in certain months by releasing aggressive mid‑tier models.
- The iPhone continues to be the single biggest revenue driver in Apple’s portfolio.
iPhone Revenue
- In Q3 2025, iPhone revenue was $44.6 billion, up ~13.5 %.
- In fiscal 2024, iPhone accounted for $201.18 billion (51.45 % of Apple’s revenue).
- That was only ~0.3 % higher than 2023’s $200.58 billion, showing maturity in growth.
- Q1 2025’s revenue share for iPhone stood at ~49.12 %.
- The decline in iPhone’s proportional share is offset by growth in Services and wearables.
- Apple’s iPhone pricing strategy includes trade‑in offers, financing, and installment models to maintain unit demand.
- Currency fluctuations and tariffs can distort year‑over‑year revenue comparisons.
- Profit margins remain among the highest in consumer electronics due to tight cost controls.
iPad Statistics
- iPad’s share of revenue in fiscal 2024 was $26.69 billion, ~6.83 % of total Apple revenue.
- That represents a decline from 7.38 % in 2023.
- In Q2 2025, iPad market share globally was ~33.1 %, down from 36.6 % a year earlier.
- iPad shipments in 2023 were ~49 million units.
- Market trends, tablets experience slower refresh cycles, and shifting competition from large-screen phones.
- iPad’s role increasingly complements the ecosystem (education, creativity, portability).
- In recent quarters, iPad revenue has exhibited mild year-over-year declines.
- iPads remain important for Apple’s strategy in the creative and educational segments.
Mac Statistics
- In fiscal 2024, Mac revenue was $29.98 billion, ~7.67 % of Apple’s total revenue.
- That was an increase from the $29.36 billion in 2023.
- In Q1 2025, Macs accounted for ~8.7 % of the global PC/laptop market share.
- In Q3 2025, Mac revenue grew ~15 %, totaling $8.05 billion.
- Mac’s growth is driven by Apple silicon (M‑series chips) and tighter integration with iOS apps.
- The shift from Intel to Apple’s own chips has improved margins and performance.
- Mac caters to both consumer and professional segments, MacBook Air, MacBook Pro, iMac, Mac Studio.
- Mac’s future depends on innovation in areas such as AI, graphics, and hybrid computing use cases.
Apple Watch & Wearables Statistics
- In fiscal 2024, Wearables, Home & Accessories revenue was $37.01 billion, ~9.46 % of total.
- That was a decline from $39.85 billion in 2023.
- In Q3 2025, wearables/home revenue fell ~8.6 %, amounting to $7.4 billion.
- The category includes Apple Watch, AirPods, HomePod, AirTag, and services.
- Apple Watch remains the leading smartwatch globally in revenue and often in shipments.
- In trade‑in & upgrade cycles, wearables help tie users into the broader Apple ecosystem.
- The product line faces competition from lower‑cost brands but maintains an advantage via integration and health features.
- Emerging trends, health tracking, ECG, sleep metrics, and possible future AR/VR convergence.
Apple Services Revenue (Music, TV+, iCloud, etc.)
- In fiscal 2024, Apple’s Services revenue reached approximately $96.17 billion, representing ~24.59 % of total revenue.
- That figure marks a ~12.87 % increase over 2023’s services revenue of ~$85.20 billion.
- In Q3 2025, Apple recorded $27.42 billion in services revenue, a ~13 % year‑on‑year increase.
- Analysts project that by 2025, the services segment will capture one‑fourth of Apple’s total revenue.
- Per YCharts, current services revenue is estimated at $96.17 billion, up from ~$78.13 billion a year ago (≈ 23 % growth).
- The margins in services remain higher than in hardware, boosting Apple’s overall profitability.
- Sub‑streams like iCloud subscriptions, Apple Music, Apple TV+, Apple Arcade, and App Store fees are significant contributors.
- In 2025, Apple reported over 1.1 billion paid subscriptions across its services ecosystem.
App Store Statistics (Apps & Games)
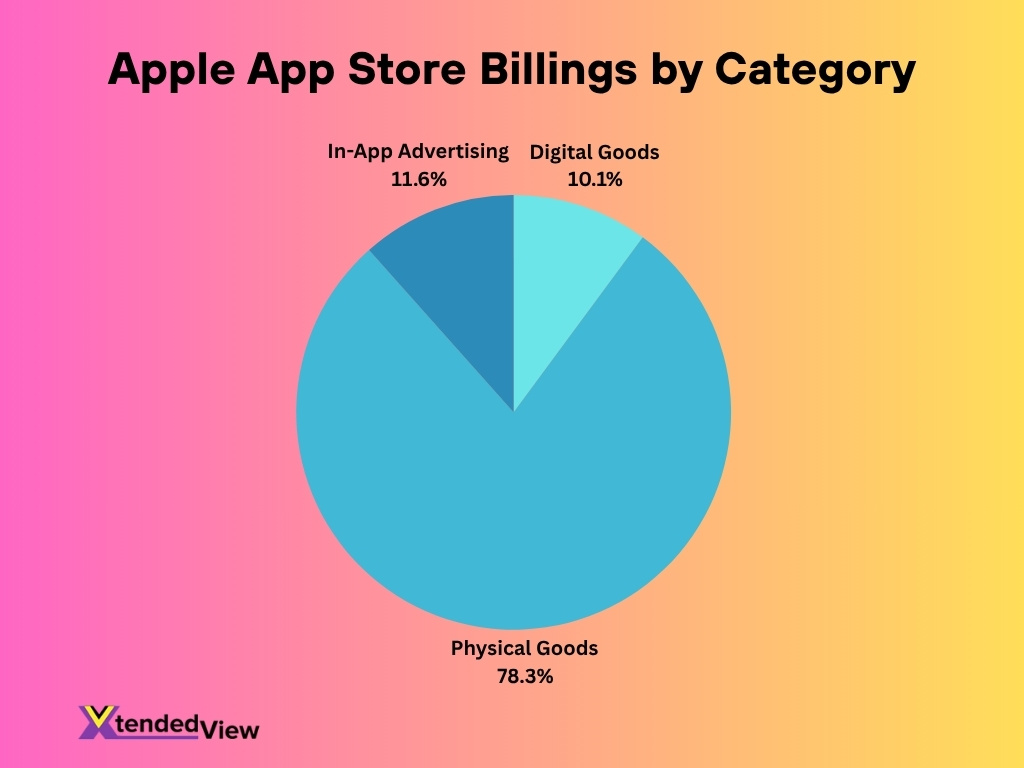
- In 2024, the App Store ecosystem facilitated nearly $1.3 trillion in billings and sales globally.
- Of that $1.3 trillion, $131 billion (≈ 10 %) was from digital goods & services, $1,014 billion (≈ 78 %) from physical goods & services, and $150 billion (≈ 12 %) from in‑app advertising.
- Over the past five years, the App Store ecosystem more than doubled in scale (from ~$514 billion in 2019 to ~$1.3 trillion in 2024).
- Apple estimates more than 813 million weekly visitors to the App Store globally in 2024.
- Physical goods & services (via iOS apps) grew ~162 % in the period 2019–2024.
- Digital goods & services grew ~109 % over the same span.
- In‑app advertising grew by ~131 % in that period.
- Apple’s commission structure applies to app purchases, in‑app subscriptions, and in‑app digital purchases, not on physical goods/services sold through apps.
Apple Consumer Loyalty & User Retention
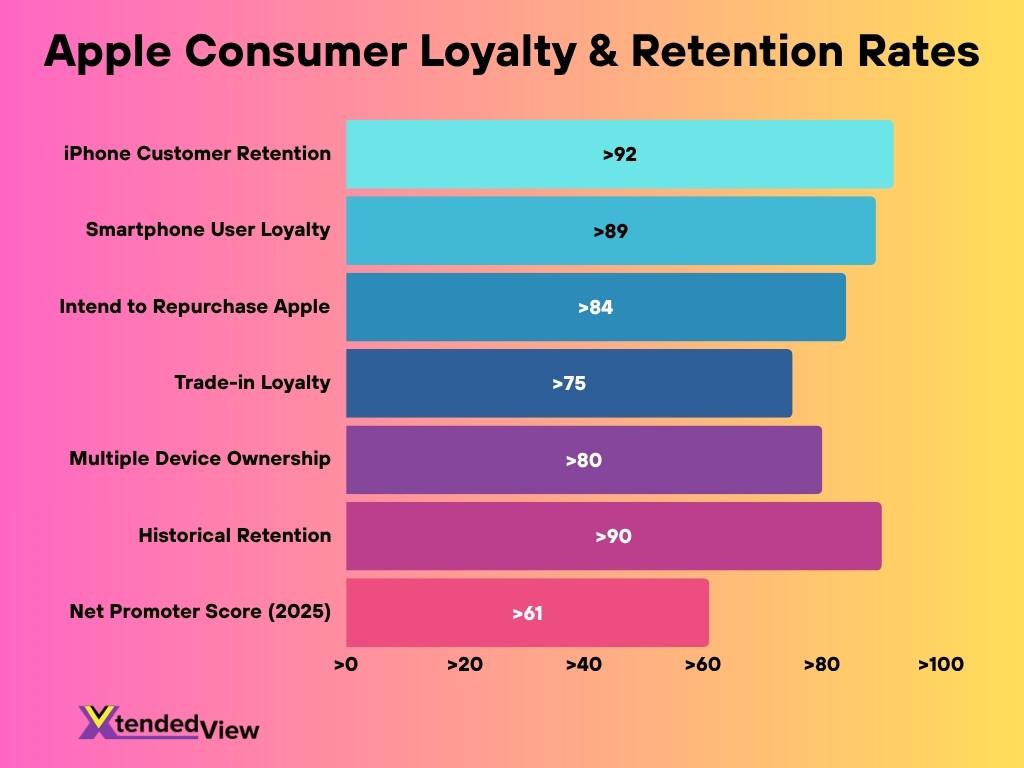
- Among iPhone users, the customer retention rate hovers near 92 %, well above many competitors.
- Apple’s Net Promoter Score (NPS) in 2025 is estimated at 61, higher than many peers.
- Overall, smartphone user loyalty to Apple remains strong (~89 %).
- Approximately 84 % of iPhone owners intend to purchase another Apple device when upgrading.
- Trade‑in loyalty is high; 74.6 % of trade‑in users stay within the Apple ecosystem.
- Over 80 % of iPhone users also own at least one other Apple device (e.g., iPad, Mac, Watch).
- Apple has consistently maintained retention > 90 % for several years.
Apple Research and Development (R&D) Statistics
- According to Apple’s 2024 Form 10‑K, the company employed approximately 164,000 full‑time equivalent employees.
- Apple invests heavily in innovation, especially in areas like AI, AR/VR, silicon, health tech, and services.
- Over the past decade, Apple’s cumulative R&D spend has reached tens of billions of dollars (across hardware, systems, and future tech).
- Apple reassigns resources to AI initiatives, per Q3 2025 commentary.
- R&D helps Apple maintain tight integration across hardware, software, and services, which strengthens its ecosystem advantage.
- Apple holds a vast patent portfolio across consumer electronics, design, power systems, AR/VR, and software.
- While exact R&D spend figures for 2025 are not yet publicly disclosed, R&D is foundational to sustaining growth in services, devices, and differentiation.
Apple Environmental & Sustainability Initiatives
- Apple has surpassed a 60 % reduction in global greenhouse gas emissions compared to 2015 levels.
- Its target is a 75 % cut by 2030, with remaining emissions offset via high‑quality carbon removal projects.
- In 2024, Apple’s Supplier Clean Energy Program enabled suppliers to procure 17.8 gigawatts of renewable electricity, avoiding ~21.8 million metric tons of CO₂e emissions.
- Apple reports that 24 % of materials shipped in its products came from recycled or renewable sources in 2024.
- The company achieved 99 % recycled rare earth elements in all magnets and 99 % recycled cobalt in all Apple‑designed batteries.
- Apple’s supply chain also reduced emissions from semiconductor and display manufacturing by ~8.4 million metric tons via abatement efforts in 2024.
- Apple’s zero waste program diverted 3.6 million metric tons of supplier facility waste from landfills.
- Through conservation efforts, Apple restored 150,000 acres of forests and protected 100,000 acres of native ecosystems.
- The company also saved 14 billion gallons of freshwater in 2024 via its Supplier Clean Water Program.
Frequently Asked Questions (FAQs)
Over 2.35 billion active Apple devices are in use as of early 2025.
Apple’s 2024 revenue was about $390.8 billion, representing ~2–3 % growth over 2023.
The iPhone contributed approximately 51 % of Apple’s total revenue in 2024.
In Q1 2025, Apple held about 19 % of the global smartphone market share.
The App Store ecosystem facilitated around $1.3 trillion in developer billings in 2024.
Conclusion
As of 2025, Apple’s trajectory continues upward, services now play a dominant role, App Store scale exceeds $1 trillion in annual economic activity, and user loyalty remains among the highest in tech. Meanwhile, Apple’s investments in R&D and sustainability signal its commitment to innovation and long-term responsibility. These figures underscore Apple’s unique position at the intersection of hardware, software, and green ambitions.