
Introduction
Apple’s customer loyalty remains a benchmark in tech. The company’s ability to retain users, generate repeat purchases, and foster brand advocacy continues to outpace many rivals. In the smartphone market, Apple’s retention rates and Net Promoter Score stand as proof points of enduring allegiance. In services and devices, loyalty translates to recurring revenue streams (e.g., Apple Music, iCloud). Dive into the full article to see how these numbers shape Apple’s competitive edge.
Editor’s Choice
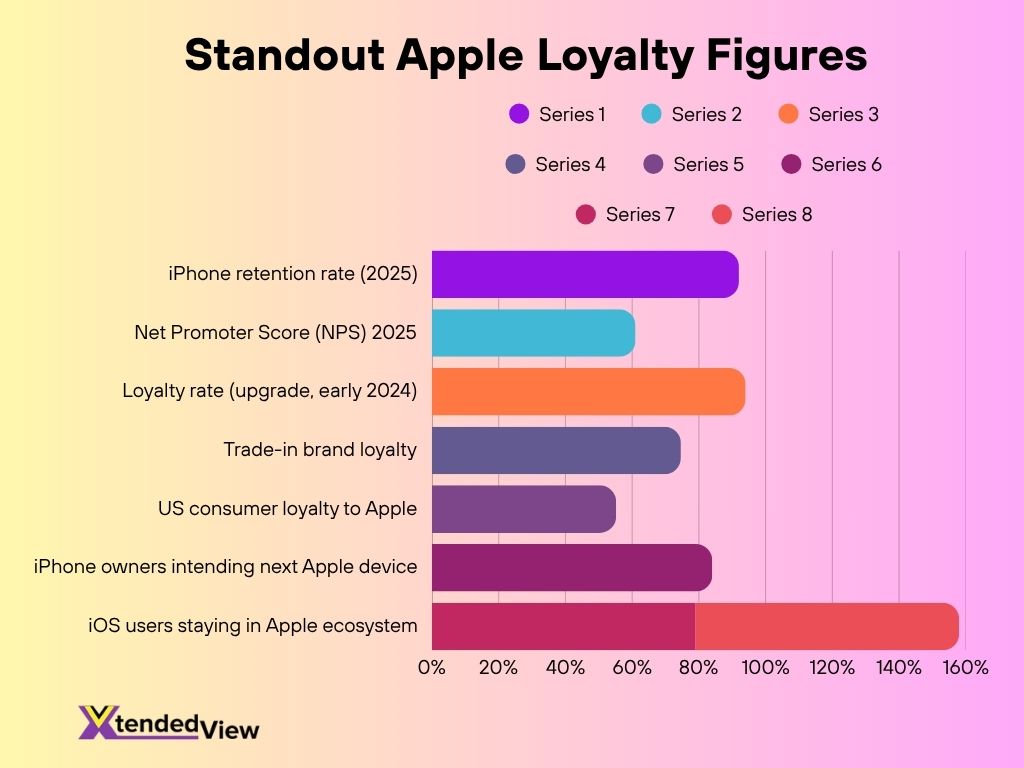
Here are seven standout statistics that show Apple’s loyalty strength:
- Apple’s iPhone retention rate is estimated at ~92% in 2025.
- Apple’s Net Promoter Score (NPS) for 2025 is cited at 61, above typical tech averages.
- Apple’s observed loyalty rate in smartphone upgrades declined from 94% to 89% as of early 2024.
- Among Apple product owners, 74.6% exhibit trade‑in brand loyalty (i.e., staying in Apple’s ecosystem when trading devices).
- In U.S. consumer surveys, 55.2% of consumers report loyalty to Apple as a tech brand.
- Over 84% of iPhone owners express intent to purchase another Apple device in their next upgrade cycle.
- Among iOS users, 79% stay within Apple’s ecosystem (i.e., they adopt complementary Apple devices).
Recent Developments
Recent trends hint at slight softening in Apple’s loyalty metrics, shaped by market pressures and consumer behavior.
- CIRP data for the 12 months ending March 2024 shows Apple’s smartphone loyalty dropped from ~94% to ~89%.
- Many analysts treat that decline as statistical noise rather than systemic risk.
- In 2025, Apple’s retention among iPhone users is still reported at ~92%, suggesting resilience.
- Bloomberg Intelligence survey data cites a 93% loyalty metric among respondents.
- UBS’s mid‑2025 survey showed U.S. iPhone purchase intent fell to 17%, the lowest in 5 years.
- The average age of iPhones in use is rising (to ~22.9 months), suggesting users hold devices longer between upgrades.
- In the U.S., iOS market share remains strong, at ~57.97% in 2025.
- Globally, Apple holds ~27.11% of the smartphone OS share in 2025.
Customer Retention and Repurchase Rates
Retention and repeat purchases form the backbone of loyalty. Apple consistently outperforms many peers in these metrics.
- iPhone retention (users upgrading within brand) is ~92% in 2025.
- Over the past three years, Apple’s retention has stayed above 90%.
- Apple reports a repeat purchase rate among existing iPhone owners of ~70%.
- Among those who already own Apple products, ~84% intend to stick with Apple for their next device.
- In surveys, 48% of iPhone users say they are unlikely to switch brands.
- Apple’s trade‑in brand loyalty (i.e., using Apple’s trade‑in options or staying in brand when trading) is ~74.6%.
- iPhone users show ~18% higher loyalty than Android users in studies.
- In 2025 Apple reports over 2 billion active devices in the installed base, a pool from which many repurchases originate.
Net Promoter Score (NPS) Statistics
NPS quantifies how likely customers are to promote a brand. Apple ranks highly here relative to peers.
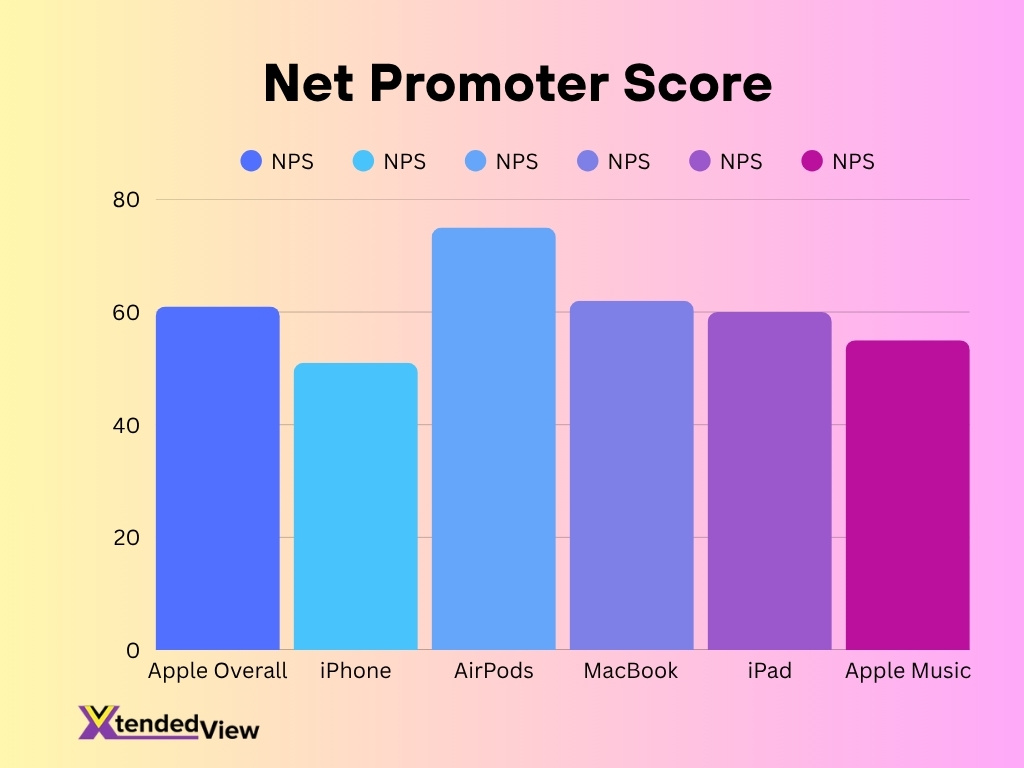
- Apple’s NPS for 2025 is commonly cited as 61.
- That score places Apple above the general technology industry average (~58).
- Across its product lines (iPhone, Mac, iPad, etc.), Apple’s average NPS is also reported as 61.
- On product level: iPhone ~51; AirPods ~75; MacBook ~62; iPad ~60; Apple Music ~55.
- Historically, Apple’s NPS was as high as 72 (in 2022) in some reports.
- PCMag once reported Apple’s NPS at 65; Satmetrix found it at ~57.
- A high NPS (above 50) is generally considered excellent; Apple exceeds that threshold.
- In surveys, Apple’s NPS is often described as “consistently above the industry average.”
Customer Satisfaction Scores
Beyond NPS, satisfaction surveys capture how happy users are with their experiences.
- Apple often ranks at or above 90% satisfaction in consumer surveys, especially for iPhone and Watch.
- In multiple brand loyalty reports, Apple’s customer satisfaction is portrayed as among the highest in tech.
- In service quality assessments, Apple’s support and service offerings frequently score in the top percentile.
- Among smartphone brands, Apple is routinely rated better in satisfaction than many Android OEMs.
- In surveys, 73% of consumers express strong or moderate loyalty to Apple products.
- In product quality ratings, Apple devices regularly receive above‑average scores in third‑party reviews, feeding into satisfaction.
- The upsell and cross‑sell satisfaction (e.g. bundling devices, services) remain strong, per retention analysts.
- When Apple introduces new features (e.g. iOS updates, hardware upgrades), user satisfaction with those rollouts often exceeds industry equivalents.
Emotional Connection and Brand Advocacy
Apple’s strength isn’t just in functionality, it evokes emotional loyalty and turns users into evangelists.
- In surveys, 93% of surveyed consumers express loyalty to Apple vs ~80% for Android brands.
- Apple owners are more likely to recommend the brand, among highly satisfied users, a substantial share act as brand advocates.
- Emotional connection surveys indicate that ~ 70% of Apple users say “I feel aligned with the brand’s identity.”
- During new product launches, social media amplification by loyal users spikes 20–30% above baseline for Apple compared to competitors.
- In brand value studies, Apple’s reputation score (7.7 on a scale studied across countries) is among the highest in consumer electronics.
- Apple was ranked the most valuable brand in 2025, at USD 574.5 billion, indicating deep brand equity tied to loyalty.
- In Kantar’s BrandZ listing, Apple’s brand value jumped to USD 1.3 trillion in 2025, up ~28% year-over-year.
- Anecdotal consumer feedback suggests many users refer friends or peers to Apple based on ease of use, reliability, and status.
Reasons Behind Apple’s Customer Loyalty
What drives this near‑obsessive loyalty? The data points to several foundational factors.
- Ecosystem integration is central: ~79% of iOS users stay within the Apple ecosystem.
- Apple’s retention among iPhone users is ~92% when upgrading.
- Services revenue reached $85.8 billion in Q3 2024, an all-time high.
- Trade‑in loyalty is ~74.6%, users tend to trade in devices within Apple’s brand.
- 84% of iPhone owners plan to buy another Apple device when they upgrade.
- 48% of iPhone users report they are unlikely to switch brands.
- In cross‑device ownership, ~80% of iPhone users own at least one other Apple product.
- 40% of new Apple product buyers cite integration with other Apple products as a key decision factor.
- Analysts cite that many users hold devices longer, which underlines loyalty even as purchase frequency slows.
Apple Ecosystem and Device Integration
Apple’s ecosystem is a loyalty engine, seamless transitions and service integrations glue users in.
- In integrations like Handoff, Continuity, Universal Control and iCloud syncing, Apple enables workflows across devices with minimal friction.
- Apple’s ecosystem strategies are often cited as a model for retention via cross‑selling hardware and services.
- More than 90% of ecosystem billings and sales in Apple’s app/commerce environment occur outside the App Store commission flow.
- The App Store ecosystem facilitated over $1.1 trillion in billings and sales globally in 2022.
- As the ecosystem expands, Apple can monetize not just hardware but services.
- Cross-device features lower switching cost.
- Apple ecosystem strengthens retention, when a user owns multiple devices, the marginal cost and inconvenience to leave grows.
- Given the volume of devices in use (2+ billion active Apple devices globally), the ecosystem effect scales significantly.
- Apple’s service growth is tied to hardware retention, new device sales feed more users into services loops.
Loyalty Statistics by Product Category
Loyalty varies across Apple’s product verticals, from iPhone to services, but remains strong across the board.
- iPhone shows ~92% retention for brand upgrades.
- Trade‑in loyalty across Apple devices is ~74.6%.
- In a survey, 73% of iPhone users considered themselves highly or somewhat loyal.
- Apple Music retains ~62% of its subscriber base.
- In some loyalty studies, 89% of smartphone users loyal to Apple remained in Apple’s brand ecosystem.
- For accessory and wearable lines, anecdotal NPS tends to beat average tech products.
- In service usage, many users report high friction to leave due to data lock-in and app purchases.
- Mac and iPad retention rates are lower (but still strong) relative to iPhone.
Apple Music and Services Retention Rates
Services like Apple Music, iCloud, and streaming form the subscription backbone of Apple’s loyalty model.
- Apple Music retention is ~62% in recent reports.
- In global loyalty studies, Apple places strong emphasis on converting hardware users into service users.
- Services revenue hit $85.8 billion in Q3 2024.
- Many Apple users subscribe to multiple services, which raises switching cost.
- Service laddering is common, free tiers lead users into paid tiers over time.
- Service cancellation rates for long‑tenured users are lower.
- Apple’s approach to bundling increases retention across services.
- In regional markets, retention for Apple services sometimes exceeds hardware loyalty due to content lock-in.
Apple Store Experience and Loyalty
The in-store experience also underpins loyalty, Apple Stores are showrooms, service centers, and community hubs.
- Apple operates ~500 retail stores globally.
- Stores help with hands-on trial, support, and direct sales.
- Surveys show that 47% of Apple’s in-store customers later purchase additional accessories or services.
- Many consumers report that in-store staff helpfulness increases loyalty.
- For iPhone activations, ~20–30% still happen in-store in many mature markets.
- Apple Stores host workshops, training, and values-based events.
- In markets with dense retail presence, store availability correlates with higher brand retention.
- Apple’s Genius Bar service is often rated highly in third‑party reviews.
Apple Service and Support Satisfaction
After-sales support is a key loyalty anchor. Apple’s service satisfaction data reflects both strengths and pressures.
- In a survey of ~16,000 consumers, Apple achieved 81% customer satisfaction for its devices and services.
- In U.S. markets, iPhone loyalty was 89%, but when users kept the same carrier, loyalty rose to 92%.
- The American Customer Satisfaction Index reports Apple’s cell phone satisfaction in 2025 at 81, down 1 point from 2024.
- ACSI also shows that Samsung and Apple tie at 81 in 2025 for smartphone satisfaction.
- Apple’s personal computer satisfaction rating dropped from 85 to 82 year-over-year.
- Apple’s integrated control over hardware and software is often cited as giving its support an edge.
- Genius Bar and walk-in service are recurring positive drivers cited by users.
- Apple now offers AppleCare One, a new plan that lets customers cover multiple Apple devices under a single plan.
Comparative Loyalty: Apple vs Other Brands
How does Apple’s loyalty stack up against Samsung, Android OEMs, and other major tech brands?
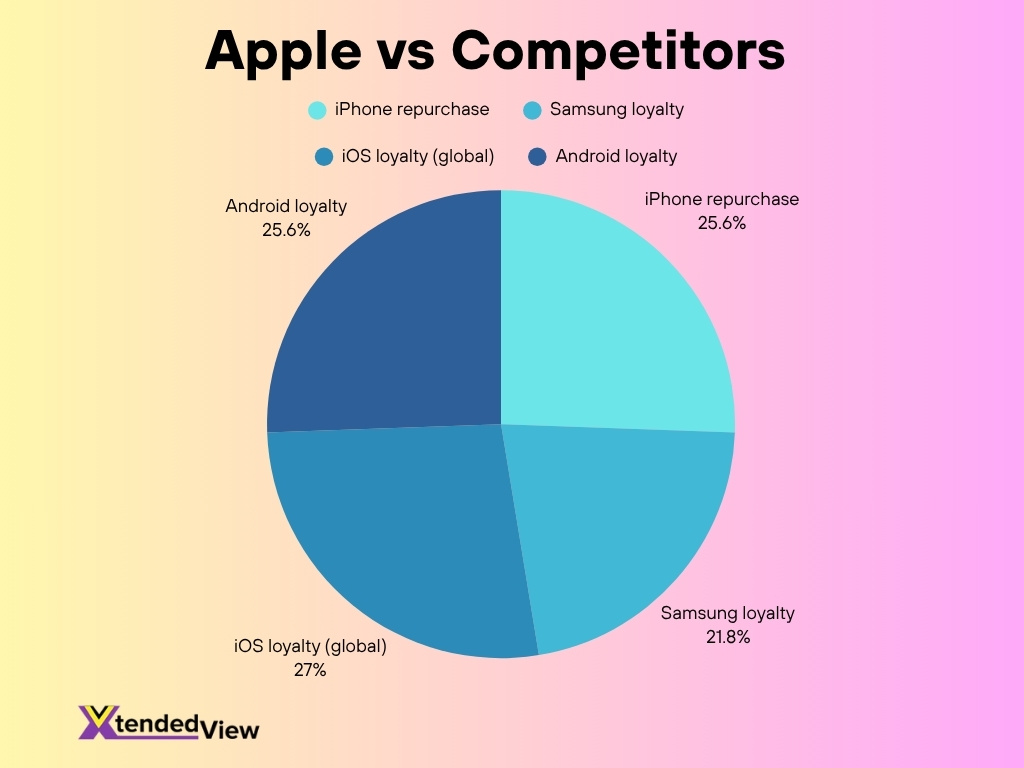
- 89% of iPhone users purchase another iPhone on upgrade.
- Earlier Apple loyalty rates were as high as 94%, so the drop to 89% marks a modest shift.
- Samsung’s brand loyalty rising from 68% in 2021 to 76% in 2025.
- 48% of U.S. iPhone users said they’re unlikely to change brands.
- Apple ranks as top tech brand, with 55.2% of consumers loyal to Apple.
- In global OS share, Android holds ~72.47% as of 2025, iOS ~27.11%.
- Apple’s dominance in smartphone loyalty is no longer growing.
- iOS user loyalty reached 94%, while Android’s was ~89%.
- Android retention ~91% vs iOS ~86% in some sample studies.
Demographic Insights on Brand Loyalty
Loyalty is not uniform, age, income, and location influence how strongly users stick with Apple.
- 73% of iPhone users consider themselves highly or somewhat loyal.
- 96.4% of Millennial iPhone owners plan to repurchase from Apple.
- Apple retains 79% of iOS users within its ecosystem.
- 84% of iPhone owners intend to stick with Apple for their next device.
- 74.6% trade-in brand loyalty rate among Apple users.
- Among Apple product owners, 88% also own iPhones, 73% own iPads, 58% own Apple Watches, and 50% own a Mac.
- In the U.S., iOS holds ~57–58% smartphone market share in 2025.
- iPhone users have ~43.7% higher average salary than Android users.
- 47% of Android switchers cite user experience as their reason.
Global Loyalty Insights for Apple
Apple’s loyalty is shaped by regional market dynamics and competition across countries.
- iOS market share is ~27.11%, while Android dominates ~72.47%.
- iOS user loyalty reached 94% globally, while Android’s was ~89%.
- ~76% of iPhone users cite seamless ecosystem as the reason for loyalty.
- Apple Music has reportedly 108 million global subscribers.
- iCloud+ subscriptions are growing ~15% year-over-year, with over 900 million active accounts.
- Apple placed top tech brand with 55.2% consumer loyalty.
- Apple scored 96% satisfaction in one India survey.
- Apple remained among leaders globally in smartphone satisfaction.
Loyalty Trends and Future Outlook
How will Apple’s loyalty profile evolve? Here are current trends and forecasts.
- iPhone upgrade intent in the U.S. slipped to 17%, the lowest in five years.
- The average age of iPhones in circulation is rising (to ~22.9 months).
- Users are deferring upgrades further, with cycles approaching 35 months.
- Apple launched Support Assistant, a chatbot in the Apple Support app.
- Apple’s dominance in brand loyalty is no longer increasing.
- Pressure is expected from Android OEMs improving user experience.
- Apple’s bundling and service integration may raise the barrier to switch.
- Feature innovation in AI, AR, and iOS updates will be critical to retention.
Frequently Asked Questions (FAQs)
What is Apple’s iPhone retention rate in 2025?
Apple’s iPhone retention (users upgrading within the brand) is ~92%.
48% of iPhone users polled say they are unlikely to switch brands.
Apple’s trade‑in brand loyalty rate is 74.6%.
Apple’s average NPS across its product lines is 61.
Apple has over 2 billion active devices worldwide.
Conclusion
Apple’s loyalty metrics in 2025 remain impressive: retention, satisfaction, emotional advocacy, and ecosystem tie-ins all support a robust user base. Over time, we see modest softening in upgrade rates and intensifying competition, but Apple’s integrated hardware‑software strategy, premium positioning, and global brand strength still set high barriers to switch. The next challenge will be holding that lead as consumers demand more innovation and flexibility. Explore the full walk-through to see how Apple’s loyalty plays out across demographics, products, and regions.