
Smart clothing blends textiles with sensors, connectivity, and data analytics to create garments that do more than cover the body. These products now support fitness tracking, remote patient monitoring, industrial safety, and military readiness. Healthcare providers increasingly use sensor-equipped garments to monitor chronic conditions, while sports organizations rely on biometric apparel to improve athlete performance and reduce injuries. As wearable technology moves beyond wristbands and into everyday clothing, the market is entering a new phase of growth. Explore the latest statistics to understand how smart clothing is reshaping consumer technology and connected apparel worldwide.
Editor’s Choice
- The global smart clothing market was valued at $2.15 billion in 2025 and is projected to reach $2.47 billion in 2026.
- Another industry estimate values the market at $5.9 billion in 2025, highlighting rapid expansion across regions and product categories.
- The market could reach $38.9 billion by 2033, growing at a CAGR of 26.8%.
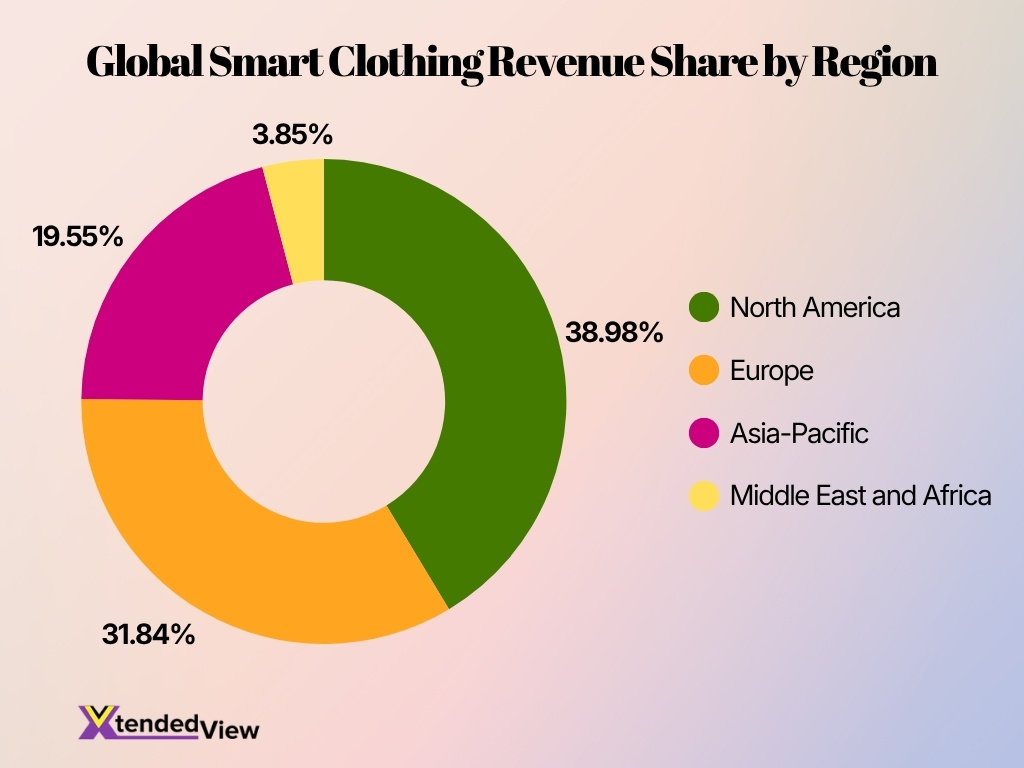
- North America accounted for nearly 39% of global smart clothing revenue in 2025, making it the largest regional market.
- The apparel category represented approximately 57% of total market revenue in 2025, outpacing footwear and wearable patches.
- The military and defense segment remained the largest end-use sector in 2025 due to rising investments in connected uniforms and health-monitoring systems.
- Asia-Pacific is expected to become the fastest-growing market as demand rises in China, India, Japan, and South Korea.
- Smart clothing and wearables are forecast to account for 38.6% of the broader fashion technology market in 2026.
- The global wearables market reached 49 million units shipped in Q2 2025, creating a larger ecosystem for smart apparel adoption.
Recent Developments
- In early 2026, industry analysts described smart clothing as entering the “Wearables 2.0” era, where technology integrates directly into everyday garments rather than external accessories.
- AI-enabled fabrics and embedded sensors have become major priorities for fashion and technology companies entering the smart apparel sector.
- The introduction of new AI-powered wearable devices in 2025 accelerated consumer interest in connected apparel and intelligent textiles.
- Several sports apparel companies increased investments in biometric shirts and connected fitness garments during 2025 and 2026.
- Advances in conductive fabrics and flexible electronics improved the accuracy of heart rate, temperature, and movement tracking.
- North America expanded research into smart uniforms for industrial workers and emergency responders in 2025.
- Fashion brands increasingly partnered with technology companies to develop products that combine functionality with conventional clothing designs.
- The shift toward personalized healthcare accelerated demand for garments capable of continuous biometric monitoring.
- Smart clothing manufacturers increasingly adopted miniaturized components, enabling lighter and more comfortable products.
- Industry reports indicate that sustainability and recyclable electronic textiles became a major innovation focus in 2025 and 2026.
E-Textiles and Smart Clothing Market Size Statistics
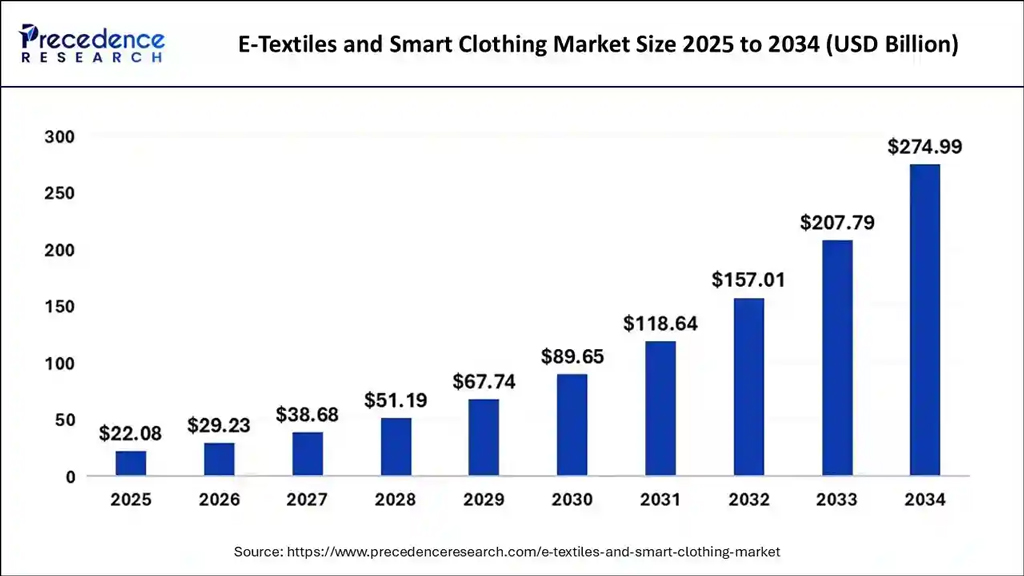
- The global e-textiles and smart clothing market is projected to reach $22.08 billion in 2025.
- The market is expected to grow to $29.23 billion in 2026, marking strong early expansion.
- By 2027, the market size is forecast to increase to $38.68 billion.
- The industry is projected to surpass $50 billion, reaching $51.19 billion in 2028.
- The market is expected to climb to $67.74 billion by 2029.
- In 2030, the global e-textiles and smart clothing market is forecast to reach $89.65 billion.
- The market is projected to exceed $100 billion, reaching $118.64 billion in 2031.
- By 2032, the market size is expected to grow further to $157.01 billion.
- The industry is forecast to surpass $200 billion, reaching $207.79 billion in 2033.
- By 2034, the global e-textiles and smart clothing market is projected to reach $274.99 billion, the highest value during the forecast period.
Smart Clothing Market Growth Rate and Forecast
- The smart clothing market is forecast to grow at a CAGR of 15.78% between 2026 and 2034.
- Another leading estimate projects a CAGR of 26.8% from 2026 to 2033.
- Industry researchers forecast a CAGR of 25.63% through 2030, driven by fitness and healthcare applications.
- Some market assessments project a CAGR of 27.4% through 2032.
- The market could expand nearly sixfold between 2026 and 2033, according to growth projections.
- Smart apparel growth continues to outpace the broader global fashion industry, which is expected to post only low single-digit growth in 2026.
- Rising demand for real-time health monitoring remains one of the strongest growth drivers.
- The adoption of IoT sensors and AI analytics is expected to accelerate commercial deployment over the next decade.
- Falling sensor costs and advances in conductive textiles continue to improve affordability and scalability.
- Growing consumer interest in personalized health and fitness data will likely sustain double-digit growth rates through the next decade.
Smart Clothing Adoption and Penetration Rates
- The global smart clothing market is expected to grow from $7.4 billion in 2026 to $38.9 billion by 2033, indicating a rapid increase in adoption across consumer and enterprise applications.
- North America accounted for approximately 38% of global smart clothing revenue in 2025, reflecting the region’s high penetration of connected apparel technologies.
- Asia-Pacific remains the fastest-growing market, supported by rising smartphone ownership and growing demand for wearable health technologies.
- Around 14% growth in smart clothing adoption was recorded in 2025, largely due to sports performance monitoring applications.
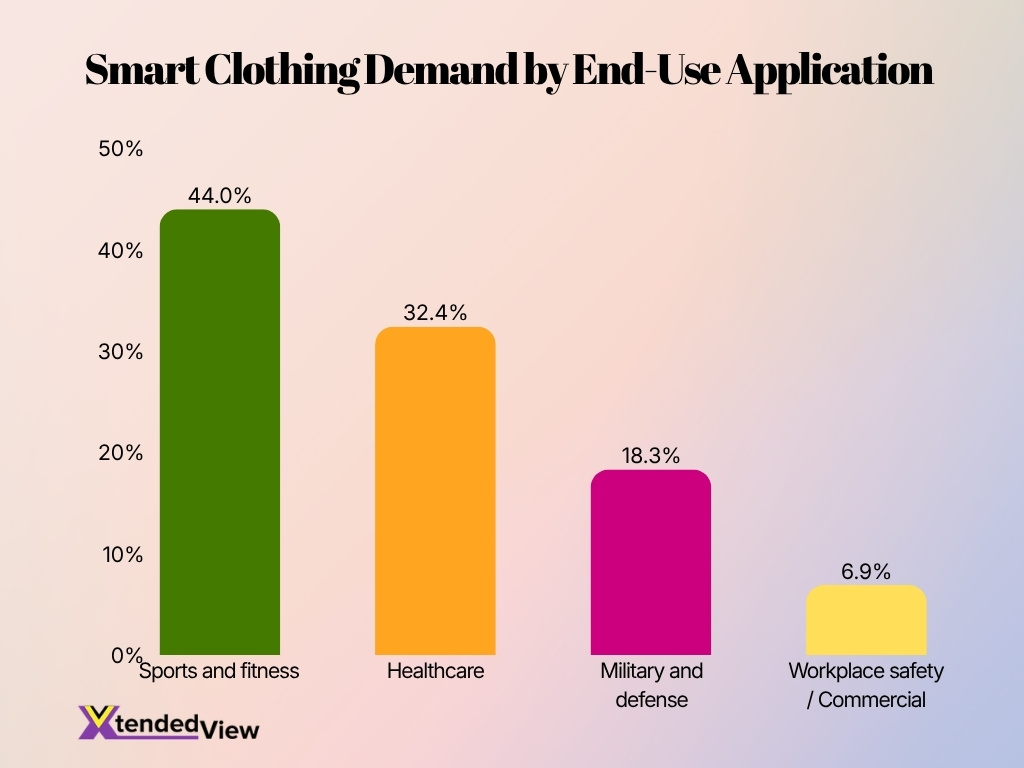
- Sports applications represented 44% of global smart clothing demand in 2025, making them the leading driver of market penetration.
- The U.S. smart clothing market alone was valued at $1.56 billion in 2024, highlighting strong consumer acceptance of connected garments.
- The global wearables ecosystem sold 49 million devices in Q2 2025, creating a larger installed base that supports future smart apparel adoption.
- Industry analysts expect smart garments to move from niche products to mainstream wellness and healthcare tools during the next decade.
- Growing demand for real-time biometric monitoring continues to expand smart clothing penetration among fitness enthusiasts and healthcare providers.
- Increased integration with mobile apps and cloud platforms has significantly improved consumer willingness to adopt connected apparel.
Regional Smart Clothing Market Statistics
- North America held 38.98% of global market share in 2025, making it the largest regional market.
- Europe represented approximately 31.84% of global revenue in 2025, with market value reaching $690 million.
- Asia-Pacific accounted for 19.55% of the global market in 2025.
- Asia-Pacific’s market size reached approximately $420 million in 2025.
- The Middle East and Africa contributed around 3.85% of global revenue in 2025.
- North America is expected to hold 42.6% of the broader fashion technology market in 2026, reinforcing its leadership in smart apparel.
- The United States remains the largest national market for smart clothing, supported by strong consumer spending and innovation ecosystems.
- Asia-Pacific is projected to become the fastest-growing region due to increasing demand among tech-savvy consumers.
- China and India are emerging as major growth engines for smart clothing manufacturing and adoption.
- Europe continues to benefit from rising demand for health-monitoring apparel and connected fitness products.
Smart Clothing User Demographics Statistics
- Women represented approximately 44.1% of the global smart clothing market in 2024.
- Over 70% of all wearable device users tracking health and fitness metrics globally are women.
- Fitness tracker usage among consumers aged 25 to 45 exceeded 51% in 2025.
- The healthcare sector accounts for nearly 48% of market growth due to older adults requiring monitoring.
- The sports and fitness demographic is expanding at an exceptional 28.44% growth rate globally.
- North America captures roughly 47% of the market share due to a large tech-savvy consumer base.
- The Asia Pacific region projects a massive 28.43% adoption growth rate driven by connected urban consumers.
- The mining sector held a dominant 39% share of end-use adoption for ensuring industrial worker safety.
- Personalized health insights remain a major purchasing factor for sensor-enabled clothing among adults under 45.
Revenue Share by Smart Clothing Product Type
- Apparel accounted for approximately 57% of global smart clothing revenue in 2025, making it the largest product category.
- Sensor-based textiles generated around $1.88 billion in revenue during 2024, leading the technology segment.
- Smart footwear remains one of the fastest-growing product categories because of rising interest in gait analysis and fitness tracking.
- Passive smart clothing represented 43% of the market in 2025, making it the dominant textile category.
- Ultra-smart garments are projected to record the fastest growth due to advanced AI and real-time analytics capabilities.
- Conductive textile products continue gaining traction as production costs decline and manufacturing processes improve.
- Connected sports shirts and compression garments account for a significant share of consumer purchases.
- Wearable patches and sensor-embedded undergarments are increasingly used in medical monitoring applications.
- IoT-connected textile products continue to expand across both consumer and industrial markets.
- The market is gradually shifting toward multifunctional garments that combine health monitoring, communication, and environmental sensing capabilities.
Smart Clothing Statistics by Application Segment
- The military and defense sector captured an 18.3% end-use share in 2025 through investments in connected uniforms.
- Sports and fitness applications represented 44% of the global smart clothing demand in 2025.
- Medical smart garments saw a 21% increase in 2025 driven by rehabilitation and chronic disease needs.
- Healthcare applications expanded to a 32.4% market share due to demands for continuous patient monitoring.
- Industrial smart clothing adoption increased by 18% across the manufacturing and logistics sectors in 2025.
- Connected apparel utilized for workplace safety monitoring accounted for a 6.9% share in commercial industries.
- Sports organizations relying on smart garments improved recovery performance tracking by nearly 30%.
- Defense agencies investing in soldier health monitoring garments are projected to drive a 24.8% growth rate.
- Emergency responders improved communication and physiological monitoring capabilities using smart textiles by over 15%.
Smart Sports and Fitness Clothing Statistics
- The global smart clothing market is projected to reach $9.97 billion by 2034 with a 15.7% CAGR.
- The sports and fitness segment holds the highest global application share at 44.9%.
- North America dominates the smart apparel industry by accounting for nearly 39% of global revenue.
- Upper wear garments like smart shirts and vests control 63.9% of the total product market.
- The specialized smart sports textile market is forecast to reach $6.52 billion by 2035.
- Traditional offline retail channels dominate the distribution space by generating 72% of sales.
- Active smart textiles that interact with physiological data represent over 43% of total textile usage.
- Over 15 million units of connected smart clothing were shipped globally as of 2023.
- Integrated compression wear with biometric sensors accounts for 45% of the specialized U.S. market.
- The broader smart fitness market is expected to exceed $106 billion in valuation by 2030.
Smart Healthcare and Medical Clothing Statistics
- The global healthcare smart clothing market is projected to grow at a 22.7% CAGR, reaching $1.35 billion by 2033.
- North America dominated the medical smart textile market with a 38.7% revenue share in 2025.
- Bio-monitoring applications command the largest market segment, holding a 42.1% share for continuous health tracking.
- Healthcare professionals drive demand, accounting for 81.09% of global medical clothing adoption.
- Approximately 68% of smart textile research is dedicated to physiological monitoring like heart and respiratory rates.
- Advanced medical smart textiles can simultaneously collect more than 20 distinct biometric parameters in real-time.
- The proper use of medical protective clothing can prevent up to 37% of occupational injuries among clinicians.
- The wearable medical technology segment within textiles is anticipated to expand at a 23.1% growth rate.
- Hospitals and clinics represent the largest end-user base, claiming 61% of the total market share.
- More than 45% of adults managing chronic conditions are accelerating the demand for remote monitoring garments.
Most Common Smart Clothing Technologies
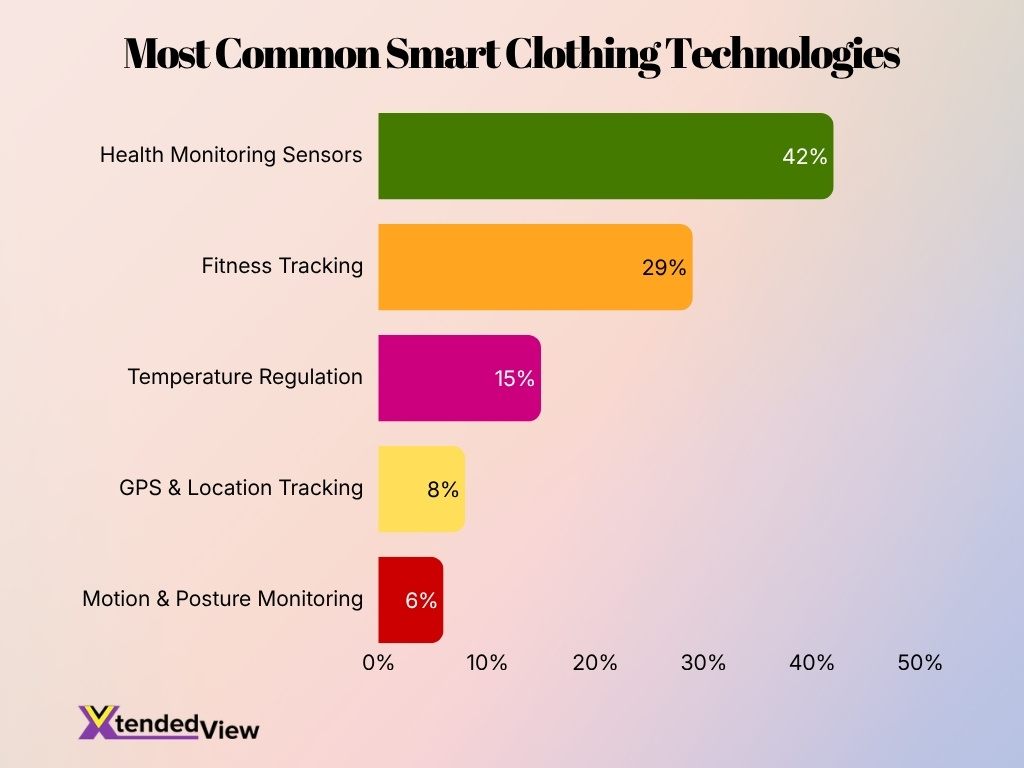
- Health monitoring sensors are the most widely adopted smart clothing technology, accounting for 42% of total adoption.
- Fitness tracking ranks second with a 29% adoption share, highlighting strong demand for wearable activity monitoring.
- Temperature regulation features make up 15% of smart clothing technologies, supporting enhanced comfort in varying conditions.
- GPS and location tracking account for 8% of adoption, primarily serving navigation and safety applications.
- Motion and posture monitoring represents 6% of adoption, reflecting its growing use in sports performance and rehabilitation.
- The top two technologies, health monitoring sensors and fitness tracking, together account for 71% of all smart clothing technology adoption.
- Advanced features such as temperature regulation, GPS tracking, and posture monitoring collectively contribute 29% of total technology adoption.
Smart Military and Defense Clothing Statistics
- The global smart textiles for military market is projected to reach $5.8 billion by 2032.
- North America holds a dominant 38% market share in the military wearables sector in 2025.
- The military wearables market is forecast to expand at a CAGR of 3.82% from 2026 to 2031.
- The combat uniform segment accounted for the largest global market share at 42.3% in 2025.
- Smart military uniforms with integrated health sensors have improved soldier survivability metrics by 18–22%.
- The Asia-Pacific region is expected to be the fastest-growing market with an 11.4% CAGR through 2032.
- The penetration of wearable sensor textiles in modern military uniforms reached 27% in 2025.
- Land forces represented the primary end-users by capturing 58.85% of the military wearables market in 2025.
Smart Workwear and Industrial Clothing Statistics
- The global smart clothing market is projected to reach $38.9 billion by 2033 with a 26.8% CAGR.
- The industrial protective clothing sector is estimated to grow to $35.6 billion by 2033.
- Smart textiles accounted for 5.8% of total global workwear sales in 2024.
- The manufacturing sector dominates consumption by accounting for 33% of total global workwear usage.
- Over 15 million units of smart clothing were shipped worldwide in 2023.
- Smart industrial uniforms featuring embedded sensors typically cost 30% to 45% more than traditional options.
- North America currently leads the smart clothing industry with a dominant 38% revenue share in 2025.
- Global demand for certified PPE-compliant garments has experienced a 40% increase since 2021.
- Chemical-defending protective clothing holds the largest product share at 31.9% of the safety market.
- Technological improvements in wash-safe conductive fibers have increased garment durability by 20%.
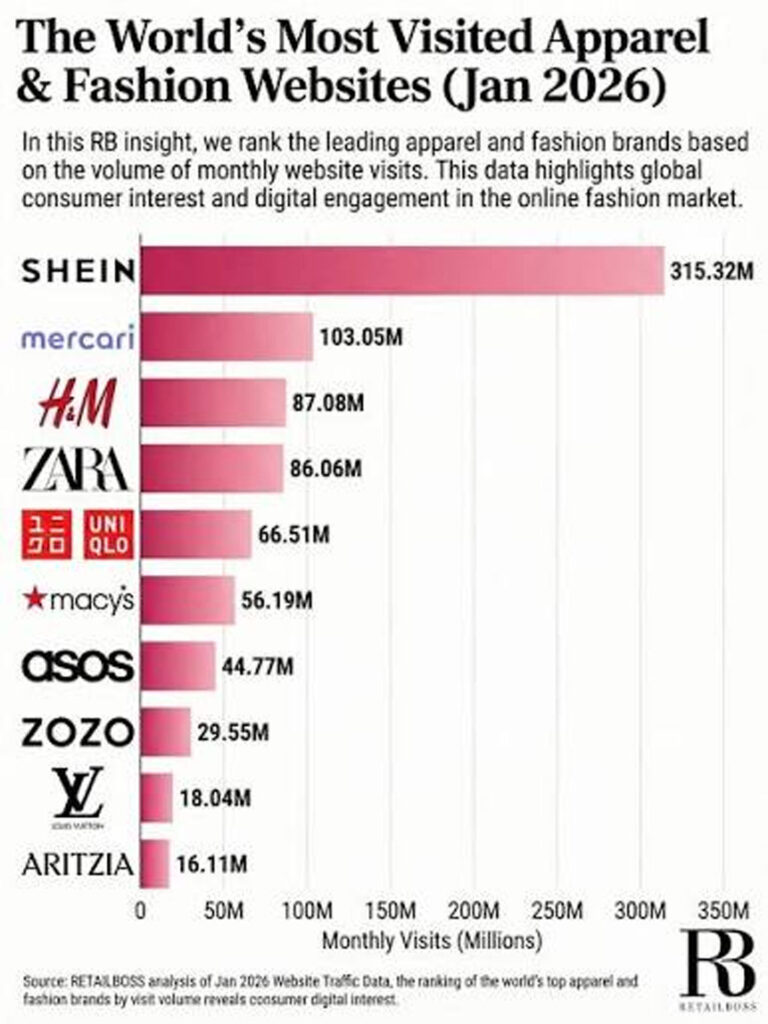
World’s Most Visited Apparel & Fashion Websites
- SHEIN dominated the ranking with 315.32 million monthly visits, receiving more than three times the traffic of the second-ranked website.
- Mercari secured second place with 103.05 million monthly visits, making it the only platform besides SHEIN to surpass 100 million visits.
- H&M ranked third with 87.08 million visits, narrowly outperforming Zara, which recorded 86.06 million.
- The difference between H&M and Zara was only about 1.02 million visits, highlighting intense competition.
- Uniqlo attracted 66.51 million monthly visits, placing it comfortably in the top five.
- Macy’s ranked sixth with 56.19 million visits, making it the only major department store in the top ten.
- ASOS generated 44.77 million monthly visits, reflecting its strong presence in the online fashion market.
- ZOZO recorded 29.55 million monthly visits, ranking eighth among the leading fashion websites.
- Louis Vuitton attracted 18.04 million monthly visits, making it the highest-ranked luxury fashion brand in the list.
- Aritzia rounded out the top ten with 16.11 million monthly visits in January 2026.
Investment and Funding Statistics in Smart Clothing
- The global smart clothing market secured a valuation of $5.9 billion in 2025 and is projected to reach $38.9 billion by 2033.
- Global investments in wearable technologies and smart fabrics exceeded $7 billion during the 2025 fiscal year.
- The digital health sector attracted over $10 billion in funding in 2025 to support smart healthcare apparel innovations.
- The U.S. government invested $22 million into the SMART ePANTS program to fund advanced biometric smart clothing.
- The smart clothing industry is projected to attract massive capital with a compound annual growth rate (CAGR) of 26.8% through 2033.
- North American developers dominated the investment landscape by capturing 38.98% of the global smart clothing market share in 2025.
- The sports and fitness segment drove major funding rounds, accounting for 44.94% of the global smart clothing market share in 2026.
- Over 75 key companies are heavily funded in this space, with the top five manufacturers controlling 48% of the overall market.
Smart Clothing Sensor and Component Adoption Statistics
- Sensor-based textiles generated approximately $1.88 billion in revenue during 2024.
- The global smart clothing market is projected to grow from $5.11 billion in 2024 to $17.32 billion by 2034.
- The market for conductive textiles is expected to expand from $3.1 billion in 2025 to $9.6 billion by 2035.
- The sensing component segment accounted for the largest functional market share of 37.3% in 2022.
- Active smart textiles featuring integrated sensors are predicted to capture a 45% market share by 2035.
- The sports and fitness sector is projected to account for 44.94% of smart clothing applications in 2026.
- The healthcare sector currently dominates smart clothing end-users by capturing over 48% of the market growth.
- Bluetooth connectivity modules dominate the smart garment ecosystem by occupying 44% of the current market share.
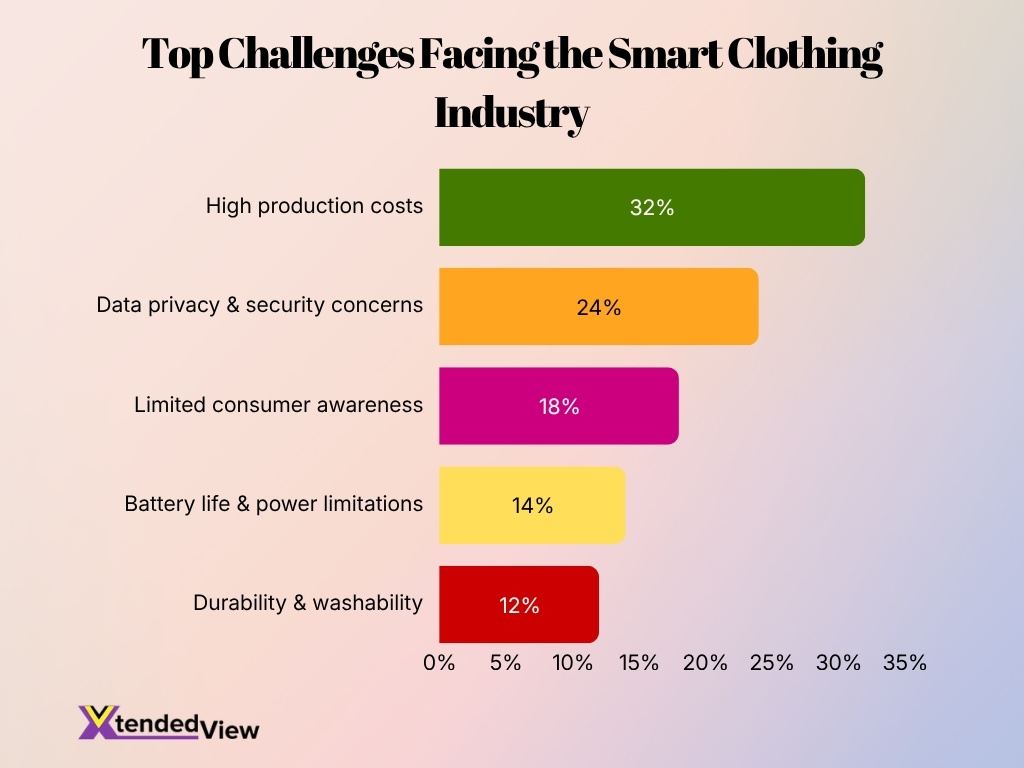
Top Challenges Facing the Smart Clothing Industry
- High production costs are the biggest challenge, accounting for 32% of the industry’s overall concerns.
- Data privacy and security concerns rank second at 24%, reflecting growing worries about wearable data protection.
- Limited consumer awareness represents 18%, showing that many potential buyers still lack knowledge about smart clothing.
- Battery life and power limitations contribute 14%, highlighting the need for longer-lasting wearable technology.
- Durability and washability account for 12%, emphasizing the importance of making smart garments more practical for everyday use.
Consumer Awareness and Perception Statistics of Smart Clothing
- Consumer awareness of wearable technology exceeded 80% in developed markets in 2025.
- Over 70% of wearable device users prioritize health monitoring when purchasing smart clothing.
- Around 50% of potential consumers express privacy concerns regarding biometric data collection.
- Nearly 80% of buyers cite comfort and appearance as crucial factors for their smart apparel purchases.
- Approximately 53% of customers hesitate to buy smart clothing if they feel the garments lack style.
- Younger demographics account for 74% of the consumer behavioral intentions to adopt connected clothing.
- At least 15% of end-users identify high price sensitivity as a major barrier to purchasing a smart garment.
- Over 80% of respondents stated that seamless integration with smartphones is their most important functionality factor.
Future Trends and Innovation Statistics in Smart Clothing
- The global smart clothing market is projected to reach $31.32 billion by 2032, growing at a CAGR of 26.23%.
- North America is expected to dominate the sector, capturing a 38.98% market share driven by early technology adoption.
- Healthcare applications currently dominate industry demand, representing over 48% of the current market growth.
- The Asia-Pacific region is anticipated to be the fastest-growing market, with an expected CAGR of 28.43% through 2035.
- Smart upper wear is projected to lead the product category, capturing approximately 63.71% of the total market share.
- The integration of Wi-Fi connectivity in smart garments is poised to register an outstanding 27.61% CAGR in the upcoming years.
- The retail and offline distribution channels are expected to maintain dominance by accounting for 72.06% of market sales.
- The sports and fitness sector is evolving rapidly and is expected to rise at an exceptional 28.44% growth rate.
Frequently Asked Questions (FAQs)
The global smart clothing market is projected to reach $7.4 billion in 2026, up from approximately $5.9 billion in 2025.
The global smart clothing market is forecast to grow at a 26.8% CAGR from 2026 to 2033, according to recent industry estimates.
North America accounted for approximately 38% of global smart clothing revenue in 2025, making it the largest regional market.
The apparel segment represented around 57% of total smart clothing market revenue in 2025, making it the leading product category.
The global smart clothing market is expected to reach approximately $38.9 billion by 2033, nearly seven times its 2025 value.
Conclusion
Smart clothing has evolved from a niche concept into one of the most promising segments within the wearable technology industry. Strong growth in healthcare, sports, military, and industrial applications continues to expand market opportunities worldwide. Advances in flexible electronics, AI-powered analytics, and conductive textiles are making connected garments more practical and accessible.
Although challenges related to cost, privacy, and durability remain, the long-term outlook for the industry is highly positive. With forecasts placing the market above $30 billion by the early 2030s, smart clothing is poised to become an integral part of healthcare delivery, workplace safety, and personal wellness.